Transcription
CIFER 2014Algorithmic tradingAutomated trading in financial marketsTutorialAistis RaudysVilnius University,Faculty of Mathematics and InformaticsNaugarduko st. 24, LT-03225 Vilnius, Lithuaniaaistis@raudys.com2014 February, London, UK
Summary Background Algorithmic trading methods– Technical (Trend, Mean reversion, Seasonality)– Arbitrage– Statistical arbitrage (Statarb)– Fundamental– High frequency trading (HFT) Optimizations2
Algorithmic/automated trading Classic way– Analyst analyses the market and makes a decision tobuy or sell some specific asset– Trader executes the trade Automated trading way– Analyst finds some reoccurring tradingopportunities and codes the logic into the algorithm– Computer performs analysis and executes the trade3
Algorithmic/automated trading Computer program makes a decision: buysand sells without human intervention Decision depends on– Human entered order (big order execution)– Single instrument market data (trend, TA, HFT)– Multiple instrument market data (statarb, trend)– Fundamental data (global macro, ratios)– News feed (event arbitrage)– Weather patterns ? Moon phases ?4
Algorithmic tradingLong termtrendfollowingHighfrequencytradingTrading frequency5
Also known as Algorithmic tradingAutomated tradingRobot trading / trading robotsProgram tradingMechanical tradingSystematic tradingHigh frequency tradingLow latency tradingUltra low latency tradingBlack-box tradingTrading modelsQuant trading6
Individual Trading strategyTrading systemTrading robotTrading algorithm (algo)A model7
Individual Trading strategyTrading systemTrading robotTrading algorithm (algo)A model?8
Pros / Cons of Algorithmic Trading Pros– Speed – can react quicker than human– Can be infinitely replicated– Emotionless– Will not quit or get sick– Can be tested using 20 years of historical data Cons– Cannot react to unknown changes– Is not able to see the big picture9
People - Quants MathematicsStatisticsSignal processingGame theoryMachine learningComputer scienceFinance and Economics10
Quant ?11
Quants and Models12
13
Strategy: One Moving AverageONEMA(9)Period 914
15
Algorithmic trading examples Execution of big orders Technical analysis– Trend Following– Mean reversion orcontra-trend– Chanel breakout HFT, Market making,scalping Arbitrage Statistical arbitrage(pairs trading) Seasonality Fundamental analysis Event arbitrage / newstrading Many unknown Moon phases / weather16
Arbitrage Buy low in one place, sell high in other placeSpeed is the main factorArbitrage opportunities exist for a very short timeArbitrage opportunities usually makes small profit– Hence big quantities I.E. Forex brokers, if one sells lower then other buys I.E. same stock traded in US and EU (LSE: BP, NYSE: BP) I.E. wheat traded in EU ir US– Keep in mind transportation, tax and other fees Moves liquidity from one market to another17
Arbitrage: illustrationBroker #1Broker #2sellPricePricePriceProfitPricebuyTimetTimet18
Arbitrage: 2 way example Suppose Walmart is selling the DVD of Shaft in Africa for 10.However, I know that on eBay the last 20 copies of Shaft in Africaon DVD have sold for between 25 and 30. Then I could go toWalmart, buy copies of the movie and turn around and sell them oneBay for a profit of 15 to 20 a DVD. It is unlikely that I will be ableto make a profit in this manner for too long, as one of three thingsshould happen: 1. Walmart runs out of copies of Shaft in Africa on DVD2. Walmart raises the price on remaining copies as they've seenan increased demand for the movie 3. The supply of Shaft in Africa DVDs skyrockets on eBay, whichcauses the price to fall.19
Arbitrage: 3 way example The basic formula for the relationship of three related currencypairs, having 3 different currencies, is as follows. AAA/BBB x CCC/AAA CCC/BBB Chance of triangular arbitrage occurs whenever this equation goeswrong. A triangle arbitrator buys BBB spending AAA, then buys CCCspending BBB and lastly returns to AAA selling CCC, capturing asmall profit. The chance of profit is maximized by utilizing marginfrom brokers and trading with higher amounts. For example take exchange rates EUR/USD 0.6522, EUR/GBP 1.3127 and USD/GBP 2.0129. With 500,000 one can buy 326100Euros, using that he can buy 248419.29 Pounds. He can now sell thepounds for 500043.19. Thus he can earn a profit of 43.19.20
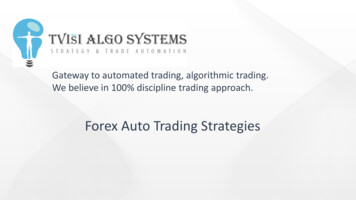
Long/Short equity (StatArb) AKA “pairs trading”Buy one and sell short the otherCan trade more than 2 instrumentsMostly known for equities– Similar companies prices move together– Difference moves mean reverting Suitable to correlated instruments :(crude/heating oilcorn/wheat) Moves liquidity from one asset to another21
Statistical Arbitragesellor orPriceStock 1Stock 2buyTime22
correlation: 0.78248070Cullen/frost BankersCommerce Bancshares 12201523
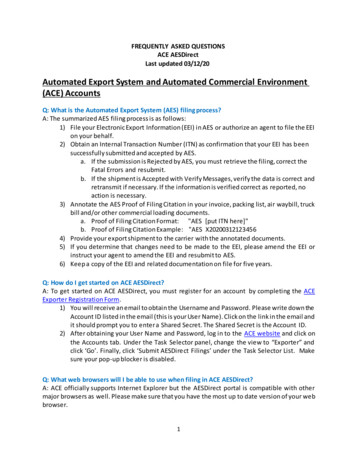
Mean reversion Price moves around the mean One instrument or spread between the two If the price deviates from the mean too muchtake the reverse direction position Similar to contra-trend type trading24
sellsellsellPriceme anbuybuyTime25
Cullen/frost Bankers vs. Commerce Bancshares Inc25price diff252d average20151050-5200220042006200820102012201426
Index arbitrage Stock index is composed of weighted stocks Some stocks lead, some lag the index If you can identify the lagger you can buy thestock and short the index Or you can short the leader and buy the index27
Index arbitrage: me28
Volatility arbitrage All comes to the fact that one can predictfuture volatility more accurately than others Usually one trades an option and its underlier Profit comes from the difference of impliedvolatility and realised volatility Usually one has immunity to marketmovements29
Market makers A.k.a. specialistsAlways quotes bid and offerSupplying liquidity to the marketGets some advantages for their workGenerates profit from small market movesMoves liquidity from one time to another30
Market makersPriceInvestor 1 wants to sell MM buys from investorInvestor 2 wants to buy sellMM sells to 31
32
Market maker33
High frequency trading / scalping Similar to market makers but no obligationalways stay in the market Position last sometimes only several sec/ms Profit per trade very small & volume is huge Sometimes profit is just liquidity rebate Very valuable as has low risk Problem - limited capacity Very crowded now - profits are shrinking34
Source: 08-03-10"Boston Shuffle". 1250 quotes in 2 seconds, cycling the ask price up 1 penny aquote for a 1.0 rise, then back down again in a single quote (and drop the bid sizeat that time for a few cycles).35
36
Simple HFT logic in easylanguage input: e(0),x(0); var: tick(minmove/pricescale); if marketposition 0 then buy next bar close e*tick limit; if marketposition 1 then sell next bar close x*tick limit;37
38
39
Trend following /momentum Classic technical analysis exampleBuy if prices are risingSell short if prices are fallingThe idea is the anticipation that trend willcontinue for a while The art is to detect the beginning of a trend asearly as possible40
Trend followingsellPricesellbuybuyTime41
42
43
Counter-trend / Contra-trend Classic technical analysis example The idea behind is that market moves inwaves or in a channel A trading system must identify top of thewave/channel and take opposite position Close after market goes back to trend44
Counter-trendsellsellbuyPricesellbuybuyTime45
46
trenPriceTrend following andcounter-trend canwork at the sametimedTime Both can work but on different time frames For example:– Counter-trend on the daily basis– Trend following on 3 month basis47
Channel breakout A type of mean reversion Most famous example is Bollinger bands Around the price one draws a channel whereprise sits most of the time If price brakes out of the channel:– Take the trade in the same direction– Or take the trade in opposite direction48
Bollinger49
Bollinger50
News trading Thomson Reuters, Dow Jones, and Bloombergprovide news feed (some claim low latency) Algorithm can analyse text, content, keywordsstocks tickers and then buy or sell Sources: Facebook, Twitter, Google, . Voice recognition from TV announcements Speed matters a lot here .51
Sesonality End of Year effectHarvesting effectHeating oil and heating season effectPolitical seasonality : 4 year US presidentialelection Other seasonality– During the day– During the month End of tax year effect52
Corn – yearly average53
5volume by business day in the year (in 9604 stocks)x 10actual21d average9.598.5average volume87.576.565.554.51234567month8910111254
4x 10:0011:0012:0013:0014:0015:0016:0055
Fundamental analysis Company accounts report analysis Country economy analysis Typical/classic investment type If fundamental data is availablethen process can be automated Reuters and Bloomberg and others providefundamental numbers56
1 . Discounted Cash Flow (DCF): While the concept behind discounted cash flow analysis is simple,its practical application can be a different matter. The premise of the discounted cash flow methodis that the current value of a company is simply the present value of its future cash flows that areattributable to shareholders. Its calculation is as follows:If we know that a company will generate 50 per share in cash flow for shareholders every year intothe future; we can calculate what this type of cash flow is worth today. This value is then comparedto the current value of the company to determine whether the company is a good investment,based on it being undervalued or overvalued.2. Ratio Analysis: Financial ratios are mathematical calculations using figures mainly from thefinancial statements, and they are used to gain an idea of a company’s valuation and financialperformance. Each valuation ratio uses different measures in its calculations. For example, price-tobook compares the price per share to the company’s book value.The calculations produced by the valuation ratios are used to gain some understanding of thecompany’s value. Valuation ratios are also compared to the historical values of the ratio for thecompany, along with comparisons to competitors and the overall market itself.3. Price- Earning Ratio (P/E Ratio): A valuation ratio of a company’s current share price comparedto its per-share earnings. Calculated as:In general, a high P/E suggests that investors are expecting higher earnings growth in the futurecompared to companies with a lower P/E. It’s usually more useful to compare the P/E ratios ofone company to other companies in the same industry, to the market in general or against thecompany’s own historical P/E.The P/E is sometimes referred to as the “multiple”, because it shows how much investors are willingto pay per dollar of earnings. If a company were currently trading at a multiple (P/E) of 20, theinterpretation is that an investor is willing to pay 20 for 1 of current earnings.57
Other Quant Application Areas Another Big area is Pricing Used mostly by major investment banks Quant construct models to price options andother derivative instruments Must do it right: credit default swaps,collateralized debt obligations and syntheticCDOs played major role in 2007-2008 crisis58
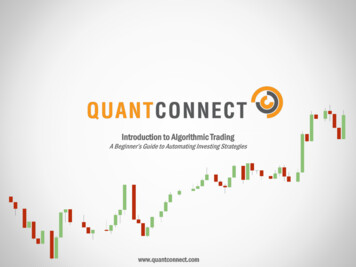
Trading strategy optimization Optimization is very important process inautomated trading a.k.a. calibration, tuning For example: what periods of 2MA to use tomaximize the profit ? One needs to check different combinations tofind the best ones Brute force and Genetic are most popular Simulated annealing and other heuristics59
2 Moving average heatmap0.6100.420304005060-0.2Sharpe RatioSlow period0.27080-0.490-0.6100204060Fast period8010060
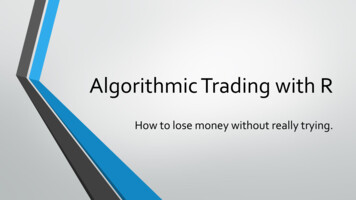
In sample / Out of Sample The same as in pattern recognitionOptimise your model on one set (older)Test performance on new/unseen dataResults in out of sample are worseOptimization process is importantThe best result in sample is not the best in outof sample (aka past performance is notnecessarily indicative of future results)61
Typical Trap7x 10in sampleout of sample5profit43210200420062008time2010201262
Diversificationr1, sharpe 1.6, dd 11r1 r2 r3 r4, sharpe 3.2537, dd 3.1r2, sharpe 1.6, dd 3, sharpe 1.6, dd 9.2r4, sharpe 1.6, dd 015020025030063
Algorithmic trading funds Altegris 40 Index– http://www.managedfutures.com64
Algorithmic trading funds Barclay Systematic Traders Index– http://www.barclayhedge.com65
Literature Trading and Exchanges: Market Microstructure forPractitioners by Larry Harris Inside the Black Box: The Simple Truth AboutQuantitative Trading by Rishi K Narang New Trading Systems and Methods New TradingSystems and Methods by Perry J. Kaufman Options, Futures & Other Derivatives by JOHN C HULL Algorithmic Trading: Winning Strategies and TheirRationale by Ernie Chan, 2013 Tradeworx, Inc. Public Commentary on SEC MarketStructure Concept Release, 201066
Thank You67
68
Additional Slides69
Metatrader70
71
72
73
Deltix74
Other vendos QuantHouseOpenQuantNinja TraderMulticharts.75
Ultra Fast Databases Fast data need to be processed fast In memory databases are wildly used CSQL - http://www.csqldb.com/ SQLite – can work in memory rc sqlite3 open(":memory:", &db); Some commercial– TimesTen – ORACLE– kdb KX systems Non SQL
Tutorial Aistis Raudys Vilnius University, Faculty of Mathematics and Informatics Naugarduko st. 24, LT-03225 Vilnius, Lithuania aistis@raudys.com 2014 February, London, UK CIFER 2014. Summary Background Algorithmic trading methods –Technical (Trend, Mean reversion, Seasonality) –Arbitrage –Statistical arbitrage (Statarb) –Fundamental –High frequency trading (HFT .