Transcription
Method Detection Limits MDLsMethod Reporting Limits MRLsLevels of Quantitation LOQs
NorthernPikeBefore it came out of thewater did you know it wasa pike?Photo compliments of ND Gameand Fish
Muskie or could you havelured this muskieinstead?Photo compliments ofND Game and Fish
How do you know before you know ?
Or Do you know what you knowwhen you know it?
Its foggy and the Mallards are allmixed together
How do you know the difference betweenthe drakes and the hens?
KnowledgeToolsExperience. the necessities of agreat hunt Gets Results!Photo compliments of ND Gameand Fish
We know what tolook for.We know how lowwe can look.We know how highwe can look.DefensibleLaboratory Results
How do I know it’s the right thing the right level and how sure can I be that “it is what it is” ?
Great another acronym
QCQU@P IDL LOD LFB PT QCS ICP GSMSPCB FID SOS LRB CAB LFM DUP LFMD SOPLCR LDR MLQ MDLs LQ ODLSTW HELPFIA ISE MS ECD PH EPA LOL NDELCPMRLs @S@P DBP THM SOC VOC ASTMPDQ IRS SDWA CWA LOQ ODW CRM AOACOMG
QCQU@P IDL LOD LFB PT QCS ICP GSMSPCB FID SOS LRB CAB LFM DUP LFMD SOPLCR LDR MLQ MDLs LQ ODLSTW HELPFIA ISE MS ECD PH EPA LOL NDELCPMRLs @S@P DBP THM SOC VOC ASTMPDQ IRS SDWA CWA LOQ ODW CRM AOACOMG
QC QU@P IDL LOD LFB PT QCS ICP GSMSPCB FID SOS LRB CAB LFM DUP LFMD SOPLCR LDR MLQ MDLs LQ ODLSTW HELPFIA ISE MS ECD PH EPA LOL NDELCPMRLs @S@P DBP THM SOC VOC ASTMPDQ IRS SDWA CWA LOQ ODW CRM AOACOMG
IDL Instrument Detection Level“ concentration that produces a signal greater than fivetimes the instrument’s signal:noise ratio “ or “1.645 times the standard deviation of blank analysis”.From Standard Methods For the Examination ofWater and Wastewater
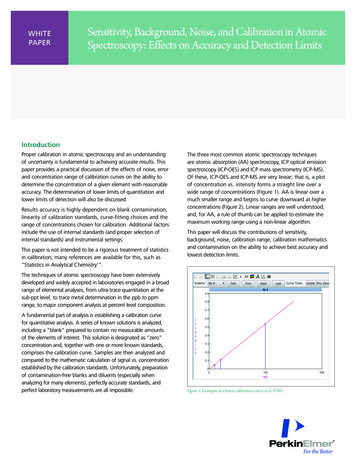
IDL observed and/or calculatedamount.Signal/Noise2-5xSignal/Noise
IDL observed and/or calculatedamount.IDL is about 0.009mg/L
MDLs Method DetectionLimits/Levels is defined as the minimum concentration of asubstance that can be measured and reported with 99%confidence that the analyte concentration is greater thanzero and is determined from analysis of a sample in agiven matrix containing the analyte.40 CFR APPENDIX B TO PART 136
MDLs Method DetectionLimits/Levels“ the constituent concentration that, when processeedthrough the entire method, produces a signal that has99% probability of being different from the blank.”Standard Method For the Examination of Waterand Wastewater
Blah Blah Blah
The laboratory limbo “HowloooowwwwZero IDLs can you go?”MDLsInstrument signal about 5x signal:noise 99%certain that the signal analyte
The MDL Statistically calculated concentration where you wouldexpect to “qualitatively” identify the analyte 50% of analyses at this level will fall above the MDL(detected). 50% of analyses at this level will fall below thislevel (not detected) Math applied to a process
MDL the math MDL t(n-1,1-α 0.99) (S) where: MDL the method detection limit t(n-1,1-α .99) the students' t value appropriate for a 99%confidence level and a standard deviation estimatewith n-1 degrees of freedom. See Table. S standard deviation of the replicate analyseshttp://www.ecfr.gov/cgi-bin/textidx?SID 4f01ee455bc83d7085022ca63dcf0080&node 40:24.0.1.1.1.0.1.8.2&rgn div9
MDLs the process1.2.3.4.5.6.7.8.9.Observe instrument signal, method baselineUse the QC chart for Blanks to determine standard deviation.2-4x the standard deviation estimated MDL concentration.Spike that concentration into matrix.Process 7 of those matrix spikes and analyze. Must be repeatedif 50-150% recovery is not obtained. Ugh!Plug results into mathematical formula and ‘VOILA MDL!Spike/10 Calculated MDL Spike ConcentrationRe-evaluate and re-do if this is not the case.Are we there yet? The process is usually “a study”.
MDL the math applied tothe processMDL Calculation Form% recovery : 50-150Analyte:Total NitrogenMethod:SM 4500-PJInstrument:FIA 8500Analyst:Spike/10 MDL l MDL study!Fortification Level (mg/L)Result% 5Mean0.046814SD0.003287RSD(SD/Mean) x 100MDLSD x 3.14 for 7 replicates7.0204050.01032
MDLs are an estimated, processedand calculated amount.Required component of each new analyst’s demonstration ofcapability.Required process each time a major element of the method ischanged.Required as a function of time: annually, semi-annually etc. Affected by:MethodInstrumentation and DetectorsAnalyst experienceMatrix qualityEnvironmental conditions of the Laboratory
MRLs Minimum ReportLimits/Levels“The Lowest Concentration Minimum Reporting Level(LCMRL) is defined as the lowest spiking concentrationat which recovery of between 50 and 150% is expected99% of the time by a single analyst.” Definition provided byEPA Office of Groundwater and Drinking Water
MRLs Minimum ReportLimits/Levels“(MRL) – the minimum concentration that can bereported as a quantified value for a target analyte in asample. Defined concentration is no lower than theconcentration of the lowest calibration standard for thatanalyte and can only be used if acceptable QC criteria forthis standard are met.” Definition provided by Standard Methodsfor the Examination of Water and Wastewater
Say what?
MRLs are a processed and quantitated amount.If 10 ppm is my MRL:1. I spike a matrix with 10 ppm2. If I get a result of 5-15 ppm I am confident that my system andmethod are working at this lowest level.What happens if I don’t get the expected 50-150% recovery? System out ofcontrol assess the system from sample preparation through dataanalysis. Fix the problem and begin anew.
MRLs Minimum ReportLimits/Levels Required QC for methods Mandatory Limits can be defined within CFR and/or withinpromulgated methods. Can be required as part of sample batch QC Method may require an MRL to be processed through same extractionas samples. And/or: MRL concentration is the lowest standard in the calibration curve.
MRLs are affected by: Sample dilutions. A sample diluted at 1:2 will increasethe MRL by a factor of 2. Matrix cleanliness. A sample that needs to be cleaned upmay need to be diluted or processed differently. This couldresult in loss of analyte, loss of method sensitivity andresulting in an increased MRL. Change in Method. Different detector, eluant, carrier gas,inlet liner, glassware and any other number of thingsused throughout the process. Change in Quantitation. Calibration curves change withincreasing orders of magnitude. If analysis is performed atlarge orders of magnitude, this can substantially affect thelower end of the curve and thereby “mess with the MRL”.
LOQ Level of QuantitationThe range of detectable concentration of analyte greaterthan the detection limit where the accuracy (precision &bias) demonstrated by the laboratory achieves theobjectives of the intended purpose.
Oh puh leeze.English?English?
LOQ Numbers! Results!rangeTheof detectable concentration of analyte greater than the detectionlimit where the accuracy (precision & bias) demonstrated by the laboratoryachieves the objectives of the intended purpose.The range is the concentrations of standards used in thecalibration curve. From the MRL to a higher definedconcentration.
LOQ Numbers! Results!The range of detectable concentration of analyte greater than the detection limitwhere the accuracy (precision & bias) demonstrated by the laboratoryachieves the objectives of the intended purpose.The accuracy objectives are the rest of the QC itemswithin a method : “goodness of fit” of the calibrationcurve; concentration of measured analyte is bracketedby concentrations above and below the measuredanalyte; % recovery of analyte is achieved ; etc.
LOQ more acronyms LDR : Linear Dynamic Range. The range of analyteconcentration where the response to analyte ratio islinear. This linear response is observed past thehighest calibration standard LCR: Linear Calibration Range. The range ofcalibration standards where the response to analyteratio is linear. LOQ : Limit/Level of Quantitation. The entirecalibration range where data quality objectives can bemet.
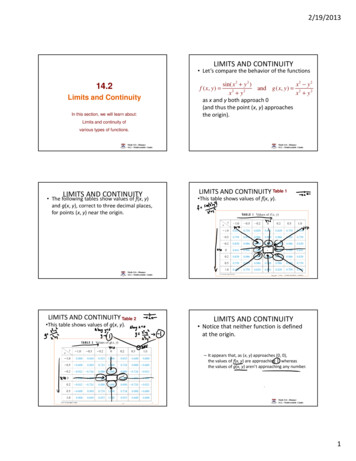
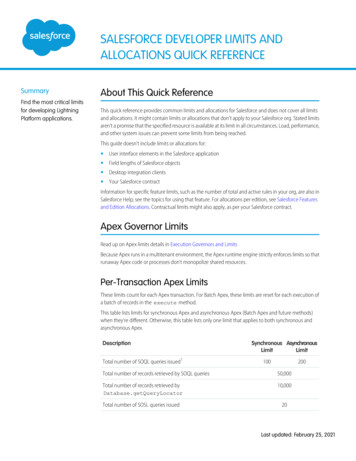
Linear Dynamic RangeLinear Dynamic RangeHighest CalibrationStandardRange past the lastcalibration standardwhere the analyteresponse toconcentration is linear
LOQ more acronyms LDR : Linear Dynamic Range. The range of analyteconcentration where the response to analyte ratio islinear. This linear response is observed past thehighest calibration standard LCR: Linear Calibration Range. The range ofcalibration standards where the response to analyteratio is linear. LOQ : Limit/Level of Quantitation. The entirecalibration range where data quality objectives can bemet.
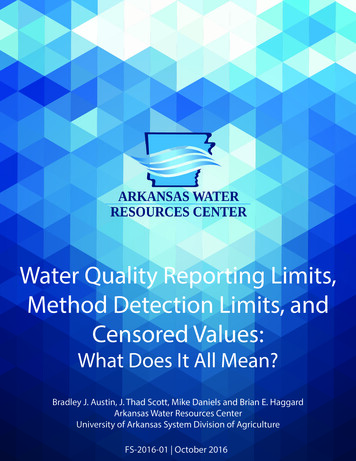
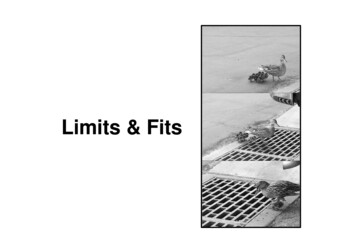
Linear Calibration RangeThree portions of this“Calibration Curve”1. -2.3.-MRL areaLinear portionExceeded linearity
LOQ more acronyms LDR : Linear Dynamic Range. The range of analyteconcentration where the response to analyte ratio islinear. This linear response is observed past thehighest calibration standard LCR: Linear Calibration Range. The range ofcalibration standards where the response to analyteratio is linear. LOQ : Limit/Level of Quantitation. The entirecalibration range where data quality objectives can bemet. Can also be defined as Operational Range.
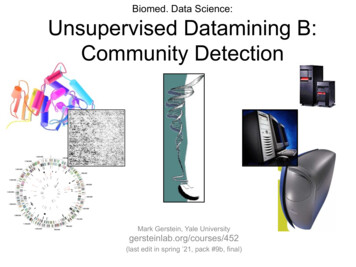
LOQ What happened?Calibration CurvesLinear Curve : proportional responsewith increasing concentration. Ananalysts dream!Plateau : shows high end roll-off,indicating saturation. The system hasbeen gob smacked! Too much analytefor the system capabilities!Poor Response follows a gobsmacking or needs maintenance. Torestore instrument response: clean thesystem; replace system components; etc
Umm Gob Smacked?
Toxaphene Standard @ report level
Dahn dahn daaa Gob Smacked
QC QU@P IDL LOD LFB PT QCS ICP GSMSPCB FID SOS LRB CAB LFM DUP LFMD SOPLCR LDR MLQ MDLs LQ ODLSTW HELPFIA ISE MS ECD PH EPA LOL NDELCPMRLs @S@P DBP THM SOC VOC ASTMPDQ IRS SDWA CWA LOQ ODW CRM AOACOMG
08-C666
Cu cleanup No SULFUR
Gob Smacking isn’t limited toinstruments
NOOOOOOOOOOOOOO No limits No levels No choicesOOO
Hang in there almost done!
From the beginning Instrument is on.Zero IDLs MDLs MRLs LOQ
A signal is present whereyou expect analyte. Signalis 5x larger than“instrument on” baseline.OBSERVATION and/ormath from QC charts.Zero IDLs MDLs MRLs LOQ
Real life sample QualitativeProcess at low levels math 99% sure this signal is from theanalyte.Zero IDLs MDLs MRLs LOQ
I canQUANTITATEat this concentrationwith50-150% confidenceZero IDLs MDLs MRLs LOQ
Results definitely on the radar!Results! Defensible takeit to the bank Results! Alldata quality objectives aremet.Zero IDLs MDLs MRLs LOQ
Relationships between the limitsand levels.IDLs MDLs MRLs LOQ1 : 2 : 4 : 10
Knowledge Tools ExperienceIDLMDLMRLLOQResults
One more time what affects thelimits and levels? Method of choice Instrumentation Eluant, carrier gas, columns, detectors Matrix quality: clean up or dilute or use anotherinstrument Multiple analytes in sample: exceed calibration curveor overwhelm system. DILUTION
Choices didn’t you saysomething about choices?Choices may be available. The lab is your greatestresource for information and available technology.Consult the lab for how best your needs can be met.BUT we are still waiting for that magical instrumentthat takes anything and gives you everything!
Questions?
Limits/Levels is defined as the minimum concentration of a substance that can be measured and reported with 99% confidence that the analyteconcentration is greater than zero and is determined from analysis of a sample in a given matrix containing the analyte. 40 CFR APPENDIX B TO PART 136