Transcription
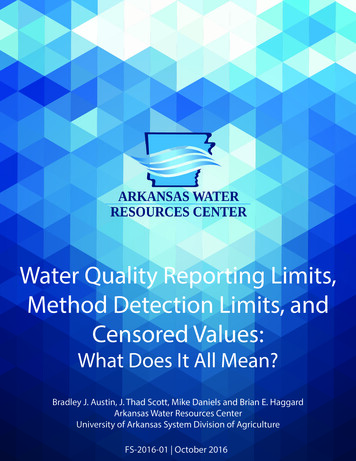
Marine Pollution Studies Laboratory at the Moss Landing Marine LaboratoriesIntroduction to Reporting LimitsNational Water Quality Monitoring Council Webinar SeriesJanuary 25, 2017Beverly H. van Buuren, Principal InvestigatorQuality Assurance ServicesMarine Pollution Studies Laboratory at the Moss Landing Marine LaboratoriesMoss Landing, CaliforniaEmail: bvanbuuren@mlml.calstate.eduPhone: 206-297-1378 All slides and content copyright protected. Must receive permission prior to use or reproduction.Transparent Accountable Scientifically DefensibleSlideSlide 111Slide
Marine Pollution Studies Laboratory at the Moss Landing Marine LaboratoriesMarine Pollution Studies LaboratoryMoss Landing Marine LaboratoriesThe Marine Pollution Studies Laboratory (MPSL) is a collaborative researchconsortium of scientists at Moss Landing Marine Laboratories (MLML).Services Quality Assurance Data Management Field SamplingScope Monitoring Assessment Compliance Research Spill Response Emerging Contaminants Wastewater Treatment Litigation SupportTransparent Accountable Scientifically DefensibleSlideSlide 222Slide
Marine Pollution Studies Laboratory at the Moss Landing Marine LaboratoriesQuality Assurance ServicesSince 1998, partnering with the academic, government, and private sectors tobuild tools and processes that enhance the transparency, accountability, andscientific defensibility of environmental data collection, analysis, and reportingCalifornia Department of Fish and WildlifeCALFED Science ProgramBuild Large-Scale QA ProgramsCalifornia State Water Resources Control BoardNational Oceanic and Atmospheric AdministrationUnited States Geological SurveyUnited States Environmental Protection AgencyPesticide IndustryPharmaceutical IndustryProvide Project QA ServicesMining IndustryTimber IndustryTransparent Accountable Scientifically DefensibleSlideSlide 333Slide
Marine Pollution Studies Laboratory at the Moss Landing Marine LaboratoriesAgenda Introduction Definitions Examples Intro to Determining Program/Project Reporting Limits Reporting Limits in Databases and Reports Working with a Laboratory and Reporting Limits Documents for Communicating Reporting Limits ConclusionTransparent Accountable Scientifically DefensibleSlideSlide 444Slide
Marine Pollution Studies Laboratory at the Moss Landing Marine LaboratoriesDesired Outcome A general understanding of common detectionand quantitation terms An understanding that there are differencesbetween detection and quantitation limits An introduction to determining RLs An appreciation for linking RLs to data use (e.g.,decision making)Transparent Accountable Scientifically DefensibleSlideSlide 555Slide
Marine Pollution Studies Laboratory at the Moss Landing Marine LaboratoriesText and References There are several slides with a significantamount of text and definitions. There are also several slides that show toolsand list web site addresses. We will not be going over these verbatim; theyare included so that you may use the slides lateras a reference.Transparent Accountable Scientifically DefensibleSlideSlide 666Slide
Marine Pollution Studies Laboratory at the Moss Landing Marine LaboratoriesIntroductionTransparent Accountable Scientifically DefensibleSlide 7
Marine Pollution Studies Laboratory at the Moss Landing Marine LaboratoriesWhy Reporting Limits MatterTransparent Accountable Scientifically DefensibleSlideSlide 888Slide
Marine Pollution Studies Laboratory at the Moss Landing Marine LaboratoriesData Use - ExamplesAbility to make recommendations and/or decisionsrelated to Improved WaterSupplyCritical Speciesand HabitatLong-termWater ResourcesWhy Reporting Limits MatterTransparent Accountable Scientifically DefensibleSlideSlide 999Slide
Marine Pollution Studies Laboratory at the Moss Landing Marine LaboratoriesDesired Outcome A general understanding of common detectionand quantitation terms An understanding that there are differencesbetween detection and quantitation limits An introduction to determining RLs An appreciation for linking RLs to data use (e.g.,decision making)Transparent Accountable Scientifically DefensibleSlide10Slide 1010Slide
Marine Pollution Studies Laboratory at the Moss Landing Marine LaboratoriesConcentrationAction Limit(or water quality standard)Reporting LimitPractical Quantitation LimitMinimum LevelMethod Detection LimitTransparent Accountable Scientifically DefensibleSlide11Slide 1111Slide
Marine Pollution Studies Laboratory at the Moss Landing Marine LaboratoriesEPA 1631EPA 1631CTR Water0.0002 ug/L0.0005 ug/L0.05 ug/LRL PQL0.0015 ug/L0Non-DetectDetected but not QuantifiedMethodDetectionLimitQuantifiedQuantified w/ Stat. RigorMinimum ReportingLevelLimit PQLActionLimitConcentrationTransparent Accountable Scientifically DefensibleSlide12Slide 1212Slide
Marine Pollution Studies Laboratory at the Moss Landing Marine LaboratoriesDefinitionsTransparent Accountable Scientifically DefensibleSlide 13
Marine Pollution Studies Laboratory at the Moss Landing Marine LaboratoriesConcentrationAction Limit(or water quality standard)Reporting LimitPractical Quantitation LimitMinimum LevelMethod Detection LimitTransparent Accountable Scientifically DefensibleSlide14Slide 1414Slide
Marine Pollution Studies Laboratory at the Moss Landing Marine LaboratoriesMethod Detection LimitMethodSample Prep Analyses Lab MDLTransparent Accountable Scientifically DefensibleSlide15Slide 1515Slide
Marine Pollution Studies Laboratory at the Moss Landing Marine LaboratoriesMethod Detection Limit 40 CFR Appendix B to Part 136 - Definition and Procedure for theDetermination of the Method Detection Limit - Revision 2o Google: e-CFR title 40 part 136, go to App. B Definition: The method detection limit (MDL) is defined as the minimummeasured concentration of a substance that can be reported with 99%confidence that the measured concentration is distinguishable frommethod blank results. (EPA 821-R-16-006 December 2016) The MDL for an analytical procedure may vary as a function of sampletype. The procedure requires a complete, specific, and well-definedanalytical method. It is essential that all sample processing steps of theanalytical method be included in the determination of the methoddetection limit.Transparent Accountable Scientifically DefensibleSlide16Slide 1616Slide
Marine Pollution Studies Laboratory at the Moss Landing Marine iles/2016-12/documents/mdlprocedure rev2 12-13-2016.pdfTransparent Accountable Scientifically DefensibleSlide17Slide 1717Slide
Marine Pollution Studies Laboratory at the Moss Landing Marine LaboratoriesMethod Detection Limit Final rule update signed on December 15, 2016 The new process takes background contamination into consideration inthe determination of detection limits. This will reduce false positives dueto blank bias. MDLs will be representative of lab performance over time, compared tocapturing MDL data on a single day. Allows the lab to combine data from more than one instrument tocalculate a lab-wide MDL, rather than individual instrument-specificMDLs. Fact sheet available at: -documents FAQ available at: uent-questions#questions-murTransparent Accountable Scientifically DefensibleSlide18Slide 1818Slide
Marine Pollution Studies Laboratory at the Moss Landing Marine LaboratoriesMethod Detection Limit Process Summary A lab determines its MDLs based on a minimum of seven spiked samples andseven method blank samples that go through all steps of the method. The spiking concentrations used to determine an MDL are between 1 and 10times the estimated MDL and should be re-evaluated annually. The samples used for the MDL must be prepared in at least three separatebatches and analyzed on three separate days. Existing data may be used forMDL calculation as long as it is collected on different days. Calculate the spiked sample MDL (MDLs) by using standard deviation of theresults and the appropriate student’s t-value and the blank sample MDL (MDLb)by using the mean results and the appropriate Student t-value. Select the greater value between MDLs and MDLb as the initial MDL. During any quarter in which samples are being analyzed, prepare and analyzea minimum of two spiked samples on each instrument, in separate batches.Routine method blanks can be used to calculate MDLb At least once every thirteen months, re-calculate MDLs and MDLbTransparent Accountable Scientifically DefensibleSlide19Slide 1919Slide
Marine Pollution Studies Laboratory at the Moss Landing Marine LaboratoriesMethod Detection LimitMethodSample Prep Analyses Lab MDLThe higher value of seven spike replicates or seven blank replicatesMDL lowest level signal producedA signal is detectedTransparent Accountable Scientifically DefensibleSlide20Slide 2020Slide
ConcentrationMarine Pollution Studies Laboratory at the Moss Landing Marine LaboratoriesMinimum LevelMethod Detection LimitTransparent Accountable Scientifically DefensibleSlide21Slide 2121Slide
Marine Pollution Studies Laboratory at the Moss Landing Marine LaboratoriesMinimum LevelEPA/StdMethodorSOPMethod MDL Factor MLML lowest point on calibration curveTransparent Accountable Scientifically DefensibleSlide22Slide 2222Slide
Marine Pollution Studies Laboratory at the Moss Landing Marine LaboratoriesTransparent Accountable Scientifically DefensibleSlide23Slide 2323Slide
Marine Pollution Studies Laboratory at the Moss Landing Marine LaboratoriesMinimum LevelA minimum level at which the analytical system shall giverecognizable mass spectra (background corrected) and acceptablecalibration points.Transparent Accountable Scientifically DefensibleSlide24Slide 2424Slide
Marine Pollution Studies Laboratory at the Moss Landing Marine LaboratoriesExample: EPA Method 1631 – Mercury in Water“The method detection limit for Hg hasbeen determined to be 0.2 ng/L when nointerferences are present. The minimumlevel of quantitation (ML) has beenestablished as 0.5 ng/L. An MDL as low as0.05 ng/L can be achieved for low Hgsamples by using a larger sample volume,a lower BrCl level (0.2%), and extracaution in sample handling.”Transparent Accountable Scientifically DefensibleSlide25Slide 2525Slide
Marine Pollution Studies Laboratory at the Moss Landing Marine LaboratoriesMinimum Level US EPA Method 1631 Revision E, 2002, Page 32, Office of Water The lowest level at which the entire analytical system must give arecognizable signal and acceptable calibration point for theanalyte. It is equivalent to the concentration of the lowest calibrationstandard, assuming that all method-specified sample weights,volumes, and cleanup procedures have been employed. The ML is calculated by multiplying the MDL by 3.18 and roundingthe result to the number nearest to (1, 2, or 5) x 10n, where n is aninteger. Minimum levels are used in some US EPA methods.Transparent Accountable Scientifically DefensibleSlide26Slide 2626Slide
Marine Pollution Studies Laboratory at the Moss Landing Marine LaboratoriesMinimum LevelEPA/StdMethodorSOPMethod MDL Factor MLML lowest point on calibration curveA signal is quantifiedTransparent Accountable Scientifically DefensibleSlide27Slide 2727Slide
Marine Pollution Studies Laboratory at the Moss Landing Marine LaboratoriesMethod Detection LimitMinimum LevelEPA/StdMethodorSOPSample Prep Analyses Lab MDLThe higher value of 7 spike replicates or7 blank replicatesMethod MDL Factor MLML lowest point on calibration curveA signal is quantifiedMDL lowest level signal producedA signal is detectedTransparent Accountable Scientifically DefensibleSlide28Slide 2828Slide
ConcentrationMarine Pollution Studies Laboratory at the Moss Landing Marine LaboratoriesPractical Quantitation LimitMinimum LevelMethod Detection LimitTransparent Accountable Scientifically DefensibleSlide29Slide 2929Slide
Marine Pollution Studies Laboratory at the Moss Landing Marine LaboratoriesPractical Quantitation LimitInstrument Analyst Factor PQL** or **PQL 3 times lowest point on calibration curveTransparent Accountable Scientifically DefensibleSlide30Slide 3030Slide
Marine Pollution Studies Laboratory at the Moss Landing Marine LaboratoriesTransparent Accountable Scientifically DefensibleSlide31Slide 3131Slide
Marine Pollution Studies Laboratory at the Moss Landing Marine LaboratoriesPractical Quantitation Limit Subjective definitions ? A quantity set at two to ten times above the method detectionlimit (MDL). By raising the MDL by a factor of two to ten, servingas a “safety factor,” commercial labs hope to quantify theenvironmental sample concentrations with a degree of certainty. The degree of the factor (2-10) is decided by the analytical labdepending upon the skill and experience of the analyst, thequality of the instrument, and the nature of the sample objectives.Transparent Accountable Scientifically DefensibleSlide32Slide 3232Slide
Marine Pollution Studies Laboratory at the Moss Landing Marine LaboratoriesPractical Quantitation LimitUnnamed Western State Water Quality Control DivisionUS EPA Region III Fact Sheet 2006Common Practice – 3 times the lowest level standardTransparent Accountable Scientifically DefensibleSlide33Slide 3333Slide
Marine Pollution Studies Laboratory at the Moss Landing Marine LaboratoriesPractical Quantitation LimitInstrument Analyst Factor PQLA signal is quantified** or **PQL 3 times lowest point on calibration curveA signal is quantified with statistical rigorTransparent Accountable Scientifically DefensibleSlide34Slide 3434Slide
Marine Pollution Studies Laboratory at the Moss Landing Marine LaboratoriesMethod Detection LimitMinimum LevelPractical Quantitation LimitTransparent Accountable Scientifically DefensibleSlide35Slide 3535Slide
ConcentrationMarine Pollution Studies Laboratory at the Moss Landing Marine LaboratoriesReporting LimitMinimum LevelMethod Detection LimitTransparent Accountable Scientifically DefensibleSlide36Slide 3636Slide
Marine Pollution Studies Laboratory at the Moss Landing Marine LaboratoriesReporting LimitProgramDocumentsProgram Data Use RL(Action Limit)Transparent Accountable Scientifically DefensibleSlide37Slide 3737Slide
Marine Pollution Studies Laboratory at the Moss Landing Marine LaboratoriesThe minimum value below which data aredocumented as non-detects.Question: Does this mean the RL MDLQuestion: What does “are documented” meanTransparent Accountable Scientifically DefensibleSlide38Slide 3838Slide
Marine Pollution Studies Laboratory at the Moss Landing Marine Laboratorieshttps://water.usgs.gov/owq/OFR 99-193/level.htmlTransparent Accountable Scientifically DefensibleSlide39Slide 3939Slide
Marine Pollution Studies Laboratory at the Moss Landing Marine LaboratoriesRichard M. Lindstrom, NIST – See Slide ransparent Accountable Scientifically DefensibleSlide40Slide 4040Slide
Marine Pollution Studies Laboratory at the Moss Landing Marine -lide/164-166.pdfTransparent Accountable Scientifically DefensibleSlide41Slide 4141Slide
Marine Pollution Studies Laboratory at the Moss Landing Marine LaboratoriesTransparent Accountable Scientifically DefensibleSlide42Slide 4242Slide
Marine Pollution Studies Laboratory at the Moss Landing Marine LaboratoriesDifferent Definitions - Examples An instrument-dependent quantity based on the lowest point on the calibration curve. ((UnnamedNorth Eastern State) Department of Environmental Protection) A limit imposed upon the reporting lab. The RL is usually demanded by the client or regulatoryguidelines, and is basically associated with method detection limits (MDLs) or practical quantitationlimits (PQLs). (Unnamed Western State Regional Water Quality Control Board ) Reporting Limit (RL)—is the lowest concentration at which an analyte can be detected in a sample andits concentration can be reported with a reasonable degree of accuracy and precision. A criterion of 20% accuracy and 20% RSD for replicate determinations is often used to define “reasonable”. Theacceptable ranges depend somewhat on the analytical methodology used. For samples that do notpose a particular matrix problem, the RL is typically about three to five times higher than the MDL.Similar to the MDL, the RL is a laboratory-specific number, which may change with time. When asample has to be diluted before analysis, either because of matrix problems or to get the instrumentresponse within the linear dynamic range, the RL is raised by a factor corresponding to the dilutionfactor. (Unnamed Federal Sanitation and Radiation Laboratory)Transparent Accountable Scientifically DefensibleSlide43Slide 4343Slide
Marine Pollution Studies Laboratory at the Moss Landing Marine LaboratoriesTerm is UndefinedReporting Limitas a termpizzaProject or programmust have a written definitionTransparent Accountable Scientifically DefensibleSlide44Slide 4444Slide
Marine Pollution Studies Laboratory at the Moss Landing Marine LaboratoriesReporting LimitProgramDocumentsProgram Data Use RL(Action Limit)Transparent Accountable Scientifically DefensibleSlide45Slide 4545Slide
Marine Pollution Studies Laboratory at the Moss Landing Marine LaboratoriesData Use - ExamplesAbility to make recommendations and/or decisionsrelated to Improved WaterSupplyCritical Speciesand HabitatLong-termWater ResourcesWhy Reporting Limits MatterTransparent Accountable Scientifically DefensibleSlide46Slide 4646Slide
Marine Pollution Studies Laboratory at the Moss Landing Marine LaboratoriesDependent on METHODMethod Detection LimitMinimum LevelDependent on USEReporting LimitPractical Quantitation LimitData Use in DecisionsAnalytical MethodTransparent Accountable Scientifically DefensibleSlide47Slide 4747Slide
Marine Pollution Studies Laboratory at the Moss Landing Marine LaboratoriesReporting LimitProgramDocumentsProgram Data Use RL(Action Limit)A signal is quantified and is more robust if it incorporatesstatistical rigorTransparent Accountable Scientifically DefensibleSlide48Slide 4848Slide
Marine Pollution Studies Laboratory at the Moss Landing Marine LaboratoriesMethod Detection LimitPractical Quantitation LimitMinimum LevelReporting LimitTransparent Accountable Scientifically DefensibleSlide49Slide 4949Slide
ConcentrationMarine Pollution Studies Laboratory at the Moss Landing Marine LaboratoriesReporting LimitMinimum LevelMethod Detection LimitTransparent Accountable Scientifically DefensibleSlide50Slide 5050Slide
Marine Pollution Studies Laboratory at the Moss Landing Marine Laboratories MDL Method Detection LimitDetectedLOD Limit of DetectionDetected ML Minimum LevelQuantifiedLOQ Limit of QuantificationQuantified PQL Practical Quantitation LimitQuantifiedIf 3x the lowest point on calibration curveQuantified with Statistical Rigor RL Reporting LimitQuantifiedMay be defined as quantified with statistical rigorTransparent Accountable Scientifically DefensibleSlide51Slide 5151Slide
Marine Pollution Studies Laboratory at the Moss Landing Marine LaboratoriesConcentrationAction Limit(or water quality standard)Reporting LimitPractical Quantitation LimitMinimum LevelMethod Detection LimitTransparent Accountable Scientifically DefensibleSlide52Slide 5252Slide
Marine Pollution Studies Laboratory at the Moss Landing Marine LaboratoriesReporting LimitProgramDocumentsProgram Data Use RL(Action Limit)Transparent Accountable Scientifically DefensibleSlide53Slide 5353Slide
Marine Pollution Studies Laboratory at the Moss Landing Marine LaboratoriesAction Limit(or water quality standard)ConcentrationProtective of StandardReporting LimitPractical Quantitation LimitMinimum LevelMethod Detection LimitTransparent Accountable Scientifically DefensibleSlide54Slide 5454Slide
Marine Pollution Studies Laboratory at the Moss Landing Marine LaboratoriesProtection of LimitActionLimitConcentrationTransparent Accountable Scientifically DefensibleSlide55Slide 5555Slide
Marine Pollution Studies Laboratory at the Moss Landing Marine LaboratoriesExamplesTransparent Accountable Scientifically DefensibleSlide 56
Marine Pollution Studies Laboratory at the Moss Landing Marine LaboratoriesExample: Unnamed Midwestern StateEnvironmental Protection AgencySame as “Action al MDLPracticalQuantitation LimitCarbon Tetrachlorideμg/L0.02 (EPA 180.1)0.525Chlorobenzeneμg/L0.03 (EPA 200.8)2.014Chloroformμg/L0.2 (EPA 200.8)2.5117From Document’s Text:“PQL variation may be due to such issues as ground water matrix interference,analytical method, laboratory, laboratory personnel or a change inanalytical instruments. Such variability is not unexpected and reflects thenature of PQLs.”Transparent Accountable Scientifically DefensibleSlide57Slide 5757Slide
Marine Pollution Studies Laboratory at the Moss Landing Marine LaboratoriesExample: Unnamed Western StateDepartment of EcologySame as “Minimum Level”Same as “Action Limit”ParameterUnitsTypical MDLLaboratoryQuantitation LevelBenchmarkMalathionμg/L0.02 (EPA 8141A)0.525Mirexμg/L0.03 (EPA 8081A)2.014Simazineμg/L0.2 (EPA 200.8)2.5117ConcentrationTransparent Accountable Scientifically DefensibleSlide58Slide 5858Slide
Marine Pollution Studies Laboratory at the Moss Landing Marine LaboratoriesExample: Unnamed Southwestern StateCommission on Environmental Quality Surface Water Quality Standards are written by the ### under the authority of theClean Water Act and the ### Water Code. The standards are effective for CleanWater Act purposes when approved by the EPA. Limit of Quantification (LOQ) Criteria are located in Appendix AExample: Unnamed North Eastern StateDepartment of Environmental Protection Reporting Limit (RL) is defined as the concentration of the lowest standard in thecalibration curve for organics and the lowest concentration standard used in thecalibration of the method and for inorganics, derived from the concentration of thatanalyte in the lowest level check standard (which could be the lowest calibrationstandard in a multi-point calibration curve).Transparent Accountable Scientifically DefensibleSlide59Slide 5959Slide
Marine Pollution Studies Laboratory at the Moss Landing Marine LaboratoriesDeterminingReporting LimitsTransparent Accountable Scientifically DefensibleSlide 60
Marine Pollution Studies Laboratory at the Moss Landing Marine LaboratoriesHow do I determine program/project RLs? Program/project RLs should be based on the data use.o This may include, but is not limited to, water quality standards, assessmentthresholds, TMDLs, regulatory contexts, and the use of results with other testing(such as toxicity testing). Labs are great resources for information! Other programs, states, projects, etc are great resources forinformation It is important to understand that you cannot set RLs below thelowest level of state-of-the-art analytical capabilities. Consider cost/benefito Lower RL may mean fewer resources for field samplesTransparent Accountable Scientifically DefensibleSlide61Slide 6161Slide
Marine Pollution Studies Laboratory at the Moss Landing Marine LaboratoriesData Use – ExamplesAbility to make recommendations and/or decisionsrelated to Improved WaterSupplyCritical Speciesand HabitatLong-termWater ResourcesWhy Reporting Limits MatterTransparent Accountable Scientifically DefensibleSlide62Slide 6262Slide
Marine Pollution Studies Laboratory at the Moss Landing Marine LaboratoriesHow do I determine program/project RLs? Program/project RLs should be based on the data use.o This may include, but is not limited to, water quality standards, assessmentthresholds, TMDLs, regulatory contexts, and the use of results with other testing(such as toxicity testing). Labs are great resources for information! Other programs, states, projects, etc. are great resources forinformation It is important to understand that you cannot set RLs below thelowest level of state-of-the-art analytical capabilities. Consider cost/benefito Lower RL may mean fewer resources for field samplesTransparent Accountable Scientifically DefensibleSlide63Slide 6363Slide
Marine Pollution Studies Laboratory at the Moss Landing Marine LaboratoriesTransparent Accountable Scientifically DefensibleSlide64Slide 6464Slide
Marine Pollution Studies Laboratory at the Moss Landing Marine LaboratoriesExample: California Toxics Rule On May 18, 2000, EPA promulgated numeric water quality criteriafor priority toxic pollutants and other provisions for water qualitystandards to be applied to waters in the state of California. EPApromulgated this rule - also known as the California Toxics Rule(CTR) - based on the Administrator's determination that numericcriteria are necessary in California to protect human health and theenvironment. (EPA) CTR values can be used as guidance for setting action limits andRLs that are protective of human health and aquatic life. Specific CTR standards can be found in 40 CFR t Accountable Scientifically DefensibleSlide65Slide 6565Slide
Marine Pollution Studies Laboratory at the Moss Landing Marine LaboratoriesProcess for Determining Reporting LimitsSelect ParameterDetermine Action LimitEstablish RLCheck MethodsCheck Lab MDL & RLTransparent Accountable Scientifically DefensibleSlide66Slide 6666Slide
Marine Pollution Studies Laboratory at the Moss Landing Marine LaboratoriesSelect ParameterDetermine Action LimitMercury, total waterCTR water 0.05 ug/LEstablish RLCheck MethodsCheck Lab MDL & RLTransparent Accountable Scientifically DefensibleSlide67Slide 6767Slide
Marine Pollution Studies Laboratory at the Moss Landing Marine LaboratoriesEstablish RL10x CTR 0.005 ug/LRLCTR Water0.005 ug/L0.05 ug/LProtection of LimitActionLimitConcentrationTransparent Accountable Scientifically DefensibleSlide68Slide 6868Slide
Marine Pollution Studies Laboratory at the Moss Landing Marine LaboratoriesSelect ParameterMercury, total waterDetermine Action LimitCTR water 0.05 ug/LEstablish RL10x CTR 0.005 ug/LCheck MethodsUse National Environmental MethodsIndex to find methods: www.nemi.govCheck Lab MDL & RLTransparent Accountable Scientifically DefensibleSlide69Slide 6969Slide
Marine Pollution Studies Laboratory at the Moss Landing Marine LaboratoriesTransparent Accountable Scientifically DefensibleSlide70Slide 7070Slide
Marine Pollution Studies Laboratory at the Moss Landing Marine LaboratoriesRL 0.005 ug/LMethod #SourceDetectionLevelDetectionType200.8EPA0.2 ug/LMDL200.7EPA7 ug/LMDL245.1EPA0.2 ug/LRNGEI-1462USGS0.5 ug/LRNGEI-7462USGS0.5 ug/LRLD6502ASTM1 ug/LML1631EPA0.0002 ug/LMDL245.7EPA0.0018 ug/LMDLTransparent Accountable Scientifically DefensibleSlide71Slide 7171Slide
Marine Pollution Studies Laboratory at the Moss Landing Marine LaboratoriesSelect ParameterDetermine Action LimitEstablish RLCheck MethodsCheck Lab MDL & RL1631 Minimum Level 0.0005 ug/L Cost 51-200245.7 Minimum Level 0.005 ug/L Cost 51-200Transparent Accountable Scientifically DefensibleSlide72Slide 7272Slide
Marine Pollution Studies Laboratory at the Moss Landing Marine Laboratories0EPA 1631EPA 1631RLCTR Water0.0002 ug/L0.0005 ug/L0.005 ug/L0.05 ug/LProtection of imitActionLimitPractical Quantitation Limit3x lowest level point on calibration curve0.0015 ug/LConcentrationTransparent Accountable Scientifically DefensibleSlide73Slide 7373Slide
Marine Pollution Studies Laboratory at the Moss Landing Marine Laboratories0EPA 1631EPA 1631RLCTR Water0.0002 ug/L0.0005 ug/L0.005 ug/L0.05 ug/LProtection of ReportingLimitActionLimitPractical Quantitation Limit3x lowest level point on calibration curve0.0015 ug/LConcentrationTransparent Accountable Scientifically DefensibleSlide74Slide 7474Slide
Marine Pollution Studies Laboratory at the Moss Landing Marine LaboratoriesSelect ParameterDetermine Action LimitEstablish RLBack and forthprocessCheck MethodsCheck Lab MDL & RLTransparent Accountable Scientifically DefensibleSlide75Slide 7575Slide
Marine Pollution Studies Laboratory at the Moss Landing Marine Laboratories0EPA 1631EPA 1631RLCTR Water0.0002 ug/L0.0005 ug/L0.005 ug/L0.05 ug/LProtection of ReportingLimitActionLimitPractical Quantitation Limit3x lowest level point on calibration curve0.0015 ug/LConcentrationTransparent Accountable Scientifically DefensibleSlide76Slide 7676Slide
Marine Pollution Studies Laboratory at the Moss Landing Marine LaboratoriesEPA 1631EPA 1631CTR Water0.0002 ug/L0.0005 ug/L0.05 ug/LRL PQL0.0015 ug/L0Protection of StandardMethodDetectionLimitMinimum ReportingLevelLimit PQLActionLimitConcentrationTransparent Accountable Scientifically DefensibleSlide77Slide 7777Slide
Marine Pollution Studies Laboratory at the Moss Landing Marine LaboratoriesReporting Limits inDatabases and ReportsTransparent Accountable Scientifically DefensibleSlide 78
Marine Pollution Studies Laboratory at the Moss Landing Marine LaboratoriesReportingWhen reporting da
the determination of detection limits. This will reduce false positives due to blank bias. MDLs will be representative of lab performance over time, compared to capturing MDL data on a single day. Allows the lab to combine data from more than one instrument to calculate a lab-wide MDL, rather than individual instrument-specific MDLs.
