Transcription
7/16/20201Calculating & UsingMethod Detection LimitsA Joint Presentation fromWater Environment Federation&American Public Health Association21
7/16/2020How to Participate Today Audio Modes Listen using Mic &Speakers Or, select “UseTelephone” and dial theconference (pleaseremember long distancephone charges apply). Submit your questions usingthe Questions pane. A recording will be availablefor replay shortly after thiswebcast.3Today’s ModeratorDale BakerLaboratory Director andEnvironmental Coordinator42
7/16/2020Today’s Speakers History of Method Detection Limits &Regulatory Programs Elizabeth Turner Evaluating Blanks Jeff Bennett Calculating MDLs Mary Johnson5Our Next SpeakerElizabeth TurnerQuality Program Manager63
7/16/2020History of Method DetectionLimits & Regulatory ProgramsElizabeth Turner7Why Method Detection Limits? Make quantitation meaningful Needed for risk assessmentRegulatory Programs Statistical analysis Protection of human health and theenvironment to a large degree depends onthe ability to measure accurately thepresence or absence of contaminants ofconcern.84
7/16/2020Detection Limit Can you see me now (2 pt) Can you see me now? (6pt) Can you see me now? (8pt) Can you see me now ? (12 pt) Can you see me now (18 pt) Can you see me now? (24)At what font size can you see words?9Analytical detection limits are:developed by statisticians, applied by analytical laboratories, and used by policy makers, regulators, andlawyers. - Michael Brisson105
7/16/2020Lloyd Currie - 1968 Introduced terms of – “critical level” (LC),“critical value” (CRV); the “detection decision”;with a 50% confidence level “minimum detectable value” (MDV), “detectionlimit” (LD) with a 99% confidence level “determination limit”, “minimum quantifiablevalue” (MQV); limit of quantitation” (LOQ);commonly “quantitation limit” (LQ) requiredprecision, accuracy, false negative error rate andqualitative identification criteria for theintended purpose.11126
7/16/2020EPA - 1981 Method detection limit (MDL) was firstpublished in a paper by John Glaser andothers at EPA’s laboratory in Cincinnati in1981 in Environmental Science andTechnology MDL based on Currie’s work Employs low-level spikes rather thanbackgrounds Uses Student’s t-test to allow for varyingnumber of replicates13Various Procedures American Council of Independent Laboratories (ACIL)Proposed Procedures for Determining the MethodDetection Limit and Quantitation Limit (ACILprocedure) Hubaux-Vos Detection Limit Procedure ASTM Interlaboratory Detection Estimate (IDE) EPA MDL, 40 CFR Part 136, Appendix B ASTM Interlaboratory Quantitation Estimate (IQE) EPA OGWDW Lowest Concentration MinimumReporting Level (LC-MRL) for Quantitation ISO/IUPAC USGS LT-MDL147
7/16/2020EPA Method Detection Limit 1984 – 2017 40 CFR 136 Appendix B The method detection limit (MDL) is definedas the minimum concentration of asubstance that can be measured andreported with 99% confidence that theanalyte concentration is greater than zeroand is determined from analysis of a samplein a given matrix containing the analyte.15Procedure 7 low level spikes 2 – 10x the expected MDL MDL T(n-1,1-α 0.99) (S) Performed annually Usually done under ideal conditions168
7/16/2020Limitations of MDL Procedure 1.11 Assumption of normal distribution andconstant standard deviation Narrow estimate of method variability Assumption instrument variability isconstant Assumption variability is the same for allinstruments Assumption of normal distribution Focused on false negatives, ignored falsepositives17EPA Must Change Procedure In 1999, several industry groups filed suit againstEPA (Alliance of Automobile Manufacturers, et al.v. EPA, No. 99-1420, (D.C. Cir.)) – re: EPA Method1631E October 2000, the parties reached a settlementagreement that required EPA to assess existingAgency and alternative procedures fordetermining detection and quantitation limitsand sign a notice for publication in the FederalRegister on or before February 28, 2003, and toinvite comment on the assessment.189
7/16/2020EPA Must Change Procedure 2002 USEPA issues a Technical Support Documentof Detection and Quantitation Regulations underthe Clean Water Act (TSD). 2003 Draft revised MDL published 2003 Consensus letter submitted to AssistantAdministrator of Office of Water signed by 31parties urging EPA to consider a scientificallysound approach to the detection andquantification issue. 2004- proposed MDL procedure was withdrawn19Federal Advisory Committee 2004 - Federal Register notice published that a neutral partyis seeking a broad group of stakeholders willing to worktogether to define and address concerns about the waydetection and quantitation values are calculated and used tosupport CWA programs. Formed in 2005 Composed of state government, environmental laboratories,regulated industry, public utilities, the environmentalcommunity, and EPA To provide advice and recommendations on approaches forthe development of detection and quantitation proceduresand uses of these procedures in Clean Water Act program2010
7/16/2020Committee RecommendationsDecember 2007 – 196 page Committeereport A 1% false positive rate be used fordetection. Need for Detection Limit andQuantitation Limit estimates that reflectnormal, routine operations. Ongoing verification of detection limitand quantitation limit21EPA Must Change Procedure 2009 EPA Pilot study for 200.7 and 625 concluded that additionaldata generated using other analytical methods and morelaboratories are needed to fully assess the applicability of theseprocedures to Clean Water Act Programs 2010 TNI forms Environmental Methods Measurement ExpertCommittee based on a USEPA grant to address Calibration,Detection, Quantification and other measurement issues. 2013 TNI EMEC (renamed Chemistry committee) completes workon a MDL revision and submits to EPA 2014 EPA completes internal review of the revised MDL and makesminor modifications 2015 EPA publishes revised MDL as part of a Methods Update Rule 2017 Signed by EPA Administrator Scott Pruitt2211
7/16/2020EPA MDL Procedure 2 2017 Method Update Rule 40 CFR 136 Appendix B The method detection limit (MDL) isdefined as the minimum measuredconcentration of a substance that can bereported with 99% confidence that themeasured concentration is distinguishablefrom method blank results.23MDL Changes Initial study over 3 days Use of blanks The MDL now requires that the samples used tocalculate the MDL are representative oflaboratory performance throughout the year,rather than on a single date (MDLv) A laboratory has the option to pool data frommultiple instruments to calculate one MDL thatrepresents multiple instruments. (Not forDrinking Water) Recalculate every 13 months2412
7/16/2020MDL Influenced By Sample Matrix Preparation Steps Instrument (age, maintenance) Technology (GC-MS GC-FID) Analyst Skill Environmental Conditions25EPA MDL Procedure 2 Analyze 7 blanks and 7 blanks preparedand analyzed in at least 3 batches over 3separate days. Multiple Instruments A minimum of two spiked samples and twomethod blank samples prepared andanalyzed on different calendar dates. Calculate MDLs and MDLb MDL is higher of MDLs and MDLb TNI Tip – use LOQ for MDL spike2613
7/16/2020MDL Verification Samples During any quarter in which samples are beinganalyzed, prepare and analyze a minimum of 2spiked samples on each instrument, in separatebatches, using the same spiking concentrationused for the initial MDL study. Evaluate MDLv against acceptance criteria Ensure that at least 7 spiked samples and 7method blanks are completed for the annualverification. Missed a verification?27Annual Verification Every 13 months recalculate MDLs and MDLb Data from last 24 monthsMDL verification spikes and method blanks The verified MDL is the greater of the MDLsor MDLb . If the verified MDL is within 0.5 to 2.0 timesthe existing MDL, and fewer than 3% of themethod blank results have numerical resultsabove the existing MDL, then the existingMDL may optionally be left unchanged2814
7/16/2020Action LimitCONCENTRATIONPurpose DependentReporting LimitMinimum LevelMethod DependentMethod Detection Limit29Minimum Level The lowest level at which the entire analyticalsystem must give a recognizable signal andacceptable calibration point for the analyte. It isequivalent to the concentration of the lowestcalibration standard, assuming that all methodspecified sample weights, volumes, and cleanupprocedures have been employed. The ML is calculated by multiplying the MDL by3.18 and rounding the result to the numbernearest to (1, 2, or 5) x 10n, where n is aninteger. Minimum levels are used in some US EPAmethods.3015
7/16/2020Reporting Limits May or maynot be equal to quantitationlimit Lowest standard must be at or belowlimit No federal method for determination Many states have own process forestablishing for regulatory programs31Regulatory Reporting LimitsAllowable concentration levels for acontaminant in a particular environmentalmedium (e.g., soil, air, or water) are oftenbased on health-related risk assessments andare sometimes lower than levels that can bequantitated in a laboratory. For this reason,the lowest quantifiable level frequentlybecomes the de facto regulatory limit formonitoring and compliance purposes.3216
7/16/2020Use in NPDES Permits MDLs serve as base for Reporting Limit Protective of Water Quality Standards State defined reporting limits Must use sufficiently sensitive method33Reporting Limits for NPDES Southwest state – 3x MDL of mostsensitive method for analyte or minimumlevel Central State- 5X method MDL Eastern state – 5X method MDL Eastern State – report everything to MDL3417
7/16/2020Other Regulatory Uses Ambient monitoring (305) Pretreatment and Stormwater Water Quality Criteria 303(d) listing for Total Maximum Daily Loads Drinking Water monitoring (MCLs andreporting limits) Remediation (Protective ConcentrationLevels)35Key Take Aways Detection Quantitation Detection limits will vary by laboratory Detection limits are utilized by regulatorsto assess:Establish Permit Limits Risk Compliance 3618
7/16/2020Our Next SpeakerJack BennettTechnical Manager,Analytical Laboratory37Evaluating BlanksJack Bennett3819
7/16/2020WEF Method Detection Limit WebinarJack BennettALAB Technical ManagerJuly 16, 2020LLNL-PRES-811878This work was performed under the auspices of the U.S. Department of Energy by Lawrence LivermoreNational Laboratory under contract DE-AC52-07NA27344. Lawrence Livermore National Security, LLC39Gathering Data The MDL must be calculated in the units that are reported forsamples.— Not the units from the calibration curve.— Use the nominal sample weight or volume and take through allcalculations. The results used for the MDL calculation must not be censored.— This really applies to blanks, although it could apply if the MDL spike isaround the reporting limit.— Can’t use “less than” or “Not Detected” or “zero” if the instrument givesa numerical result. This is most common for metals, methods with “common” blank contaminants,and some automated wet chem methods.LLNL-PRES-811878404020
7/16/2020Gathering Data If you have a LIMS and normally do not report below theReporting Limit (RL), create a LIMS test code without the logic tocensor the data. If you don’t have a LIMS, you can use a spreadsheet to do thecalculations.— Many instruments have an option to export a file, which can be used topopulate a calculations spreadsheet. In Excel, the Legacy Wizard is (in my opinion) more user friendly than the newWizard.— Its very important to keep up with “filing” the data as it is generatedrather than gathering it once a year. Especially important for blanks.LLNL-PRES-8118784141LLNL-PRES-811878424221
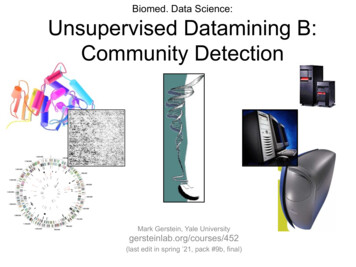
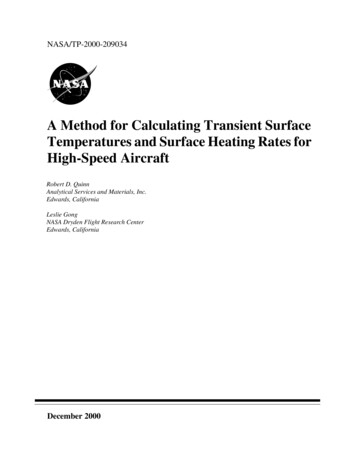
7/16/2020The Blank MDL – Why? The original MDL method was based on an assumption that theblanks were essentially zero.— Normal distribution tightly around zero. Without going into too much detail, Lloyd Currie’s paper “Limitsfor Qualitative Detection and Quantitation: Application toRadiochemistry” Anal. Chem. 40, 586‐593 (1968) was theseminal paper on the concept of detection limits. He proposed that the point where there was a random chanceof a false positive being 1% was the Critical Level (Lc).LLNL-PRES-8118784343The Blank MDL – Why? The concentration that gave that point was the Detection Limit(LD). This figure from his paper illustrates the difference between theblank population and the detection limit population:LLNL-PRES-811878444422
7/16/2020“Limits for Qualitative Detection andQuantitation: Application to Radiochemistry”Anal. Chem. 40, 586‐593 (1968)LLNL-PRES-8118784545The Blank MDL – Why? Curries approach was to minimize false positives. When EPA produced their original MDL procedure in 1984, theirapproach was to minimize false negatives.— They set their procedure so that the MDL was at the Lc. Blank MDL/Lc Currie LD Blanks were not included in the EPA MDL calculation. As methods got more sensitive, labs were reporting falsepositives.— False positives can have consequences.LLNL-PRES-811878464623
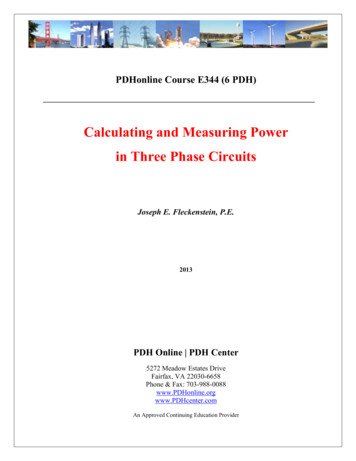
7/16/2020Potential of False PositivesLLNL-PRES-8118784747The Blank MDL – Why? In 1999, EPA was sued over a low‐level mercury MDL method andlost. It took until 2016 for them to figure out a new MDL procedure.— Why not just use Curries procedure? It is not practicable for a typical lab.– Need to run lots of samples. Including blanks in the procedure is a way to reduce false positiveswhen reporting results below the RL. Not perfect, but not going to change. What else – can use for solids and other methods that can’tpractically be spiked.— Not a requirement, but (maybe) a “best practice”.LLNL-PRES-811878484824
7/16/2020Blanks in the MDL Rev 2 Initial MDL for Method Blanks:— Can use routine Method Blanks. Must be within the last 24 months.— If no routine Method Blanks, at least 7 Method Blanks processed throughthe entire sample prep and analysis process on three separate calendardays. If multiple instruments are used, must be run on all instruments. A minimum of two blanks prepared on different days is required for eachinstrument. Statistical outlier removal procedures should not be used.49LLNL-PRES-81187849Calculating the Initial Blank MDL (MDLb) Three options:— Option 1 – No method blanks give numerical results, the MDLb does notapply. A negative number as a result is a numerical result. Results below the current MDL or RL are numerical results. An example of a non‐numerical result is a chromatography method when apeak is not present.— Option 2 – Some (but not all) results give a numerical result, set the MDLbto the highest method blank result. If using routine method blank data and there are 100 method blanks, set theMDLb to 99th percentile.– Estimating the 99th percentile is acceptable.LLNL-PRES-811878505025
7/16/2020Calculating the Initial Blank MDL (MDLb)— Option 3 – All the method blanks give either positive or negativenumerical results, calculate the MDLb as:MDLb 𝑥̅ tstudents(Sb)where:MDLb the MDL based on method blanks.𝑥̅ mean of the method blank results.(use zero for the mean if the mean is negative)tstudents Students t‐value for the 99th percentile.Sb Sample standard deviation.— If existing data is being used and there are more than 100 methodblanks, the 99th percentile value of the results can be used.LLNL-PRES-8118785151LLNL-PRES-811878525226
7/16/2020Ongoing Verification for Method Blanks The data only has to be collected if samples are being analyzedin a quarter.— There is guidance in the EPA MDL FAQ about low volume tests tion‐limit‐frequent‐questions The verification / recalculation is done every 13 months ideallyusing data from the last 24 months.— Only use data from acceptable batches.— The 99th percentile value is not listed as an option for ongoing verificationof methods with lots of blanks, however:— “The laboratory has the option to use only the last six months of methodblank data or the fifty most recent method blanks, whichever criteriayields the greater number of method blanks”. Must use data from all acceptable batches.LLNL-PRES-8118785353Ongoing MDL Verification Criteria Fewer than 3% of the method blank results can have resultsgreater than the existing MDL.— If more than 3% of the method blanks are greater than the existing MDL,must use the new verification MDL. MDL Evaluation Criteria:— If the verified MDL (i.e. MDL calculated using the verification data) is: Within 0.5 to 2 times the existing MDL. Fewer that 3% of the method blank results are above the existing MDL.— Then the existing MDL may continue to be used.— Otherwise, use the newly calculated verification MDL. The verification MDL is the greater of the method blank MDL or the Spike MDL— However, if more than 5% of the MDL Verification Spikes do not returnpositive numerical results, then the original MDL must be re‐performedusing a higher spiking level.LLNL-PRES-811878545427
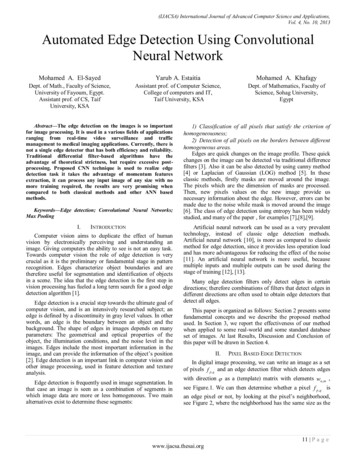
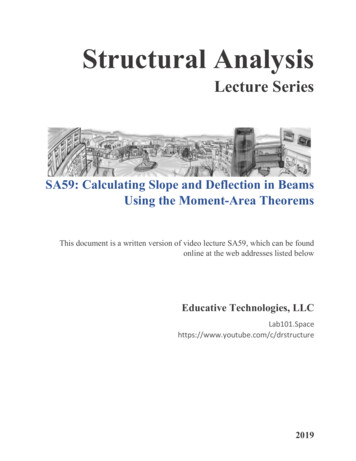
7/16/202055MDL Study EPA MDL Procedure Revision 2 ‐ MDL Annual Verification (Spikes)LRF NumberSample IDMDL 1MDL 2MDL 3MDL 4MDL 5MDL 6MDL 7MDL 8MDLV 1MDLV 2MDLV 3MDLV 4MDLV 5MDLV 6MDLV 7MDLV 8MDLV 9MDLV 10MDLV 11MDLV 12MDLV 13MDLV 14MDLV 15MDLV 16MatrixDateSpike Level, ug/gStd Dev# of samplesMethodEPA 3050B/6010DYear2019Instrument ICP 71.8371.2721.55324Original MDLNew Spike MDLVerification MDLDo 95% of thespikes return apositive numericalresult?Is the original MDLVerified?Use VerificationMDL?Soil/SolidSb 206.836 As 193.696 Ba 233.527 Rad Be 313.107 Cd 214.440 Cr 205.560 Co 228.616 Cu 324.752 Pb 220.353 Mo 202.031 Ni 231.604 Se 196.026 Ag 328.068 Tl 190.801 V 292.402 Zn 210011.6000Deg. 58Students T YYYY5628
7/16/2020Takeaways: Develop a system to keep track of when MDLV’s are due.— This is especially important for low volume tests. Automate the calculations as much as possible.— Spreadsheets work nicely, and there is more than one way to get to yourdesired result. Figure a way that makes sense to you.— Remember to (ideally) have someone else check your calculations. Start with an easy test.57LLNL-PRES-81187857This work was performed under the auspices of the U.S. Department of Energy byLawrence Livermore National Laboratory under Contract DE‐AC52‐07NA27344.DisclaimerThis document was prepared as an account of work sponsored by an agency of the United Statesgovernment. Neither the United States government nor Lawrence Livermore National Security, LLC,nor any of their employees makes any warranty, expressed or implied, or assumes any legal liabilityor responsibility for the accuracy, completeness, or usefulness of any information, apparatus,product, or process disclosed, or represents that its use would not infringe privately owned rights.Reference herein to any specific commercial product, process, or service by trade name, trademark,manufacturer, or otherwise does not necessarily constitute or imply its endorsement,recommendation, or favoring by the United States government or Lawrence Livermore NationalSecurity, LLC. The views and opinions of authors expressed herein do not necessarily state or reflectthose of the United States government or Lawrence Livermore National Security, LLC, and shall not beused for advertising or product endorsement purposes.5829
7/16/2020Our Next SpeakerMary JohnsonLaboratory Manager59Calculating MDLsMary Johnson6030
7/16/2020A Tool for Calculating MDLsAnalyte:Spike Conc:Units:Method:Replicate12345678AverageStd DevDeg of Freedomt(n-1)Analyte Name(spike concentration must be a numerical value)unitsMethod Reference or V/0!#DIV/0!#DIV/0!MDLs MDL based on spiked samplesMDLb MDL based on blanks#NUM!0.016MDL is greater of MDLs and MDLb#NUM!61Spreadsheet Tabsmdl s:spreadsheet for calculating mdl based on spiked samplesmdl b:spreadsheet for calculating mdl based on blank samplesexample data:spreadsheet with sample data used in this presentationpassword:spreadsheet with password for unlocking mdl s and mdl bdisclaimer:as stated6231
7/16/2020A DisclaimerThese spreadsheets were put together by members of theAssociation of Public Health Laboratories and the WEFLaboratories Practices Committee. The authors have attemptedto align procedures with the EPA's Definition and Procedure forthe Determination of the Method Detection Limit, Revision 2(EPA821-R-16 006).The authors make no representation or warranty of any kind,whether expressed or implied, concerning the accuracy,completeness, suitability, or utility of any information orprocess presented here, nor do they assume any liability.63MDL CalculationThe MDL is the greater of MDLs and MDLbMDLs t(n-1, t-α 0.99) * SsMDLb X (t(n-1, t-α 0.99) *Sb)You need a minimum of 7 spiked samplesfor the MDLs calculation and 7 blanksamples for the MDLb calculation.6432
7/16/2020MDLsMDLs t(n-1, t-α 0.99) * SsWhereMDLs the method detection limit based on spiked samplet(n-1, t-α 0.99) Students t-value at 99% for standard deviation withn - 1 degrees of freedomSsstandard deviation of the spiked samples 65Data Needed: Spiked Samples Minimum of seven spiked samples Must use most recent available data Data must be from at least three separatebatches analyzed on three separate days Data must have been generated within last 24months Analysis results must be a numerical valuegreater than zero No statistical outlier data removal for initial MDL6633
7/16/2020Spiked Samples: Practicalities Spiking level is typically 2 – 10 times theexpected MDL Analyzing two MDL samples each quarteris a practical way to collect enough datato calculate the MDL each year. Use only data associated with acceptablecalibration and batch QC.67Example Data: MDLsA laboratory tests for ammonia using a specificion meter. Each quarter they analyze two 0.100mg/L ammonia samples. The results of theseanalysis are used to calculate MDLs.test datemg/L Ammoniatest datemg/L 1/1/20190.0966834
7/16/2020It’s Easier with a SpreadsheetAnalyte:Spike Conc:Method:Replicate12345678AverageStd DevDeg of Freedomt(n-1)Ammonia0.100 mg/LSOP 301, Ammonia by Specific Ion Electrode (SM 4500-NH3 g/Lmg/Lmg/L#DIV/0!#DIV/0!-1#NUM!MDLs MDL based on spiked .0#NUM!69MDLs Calculation#VALUE!AAnalysisResultAverage: average(A1:A8)Standard Deviation stdev(A1:A8)12345678(n – 1) Degrees of Freedom count(A1:A8)-1Students t(n-1, t-α 0.99)Average Std Dev Deg of Freedom t(n-1) #DIV/0!#DIV/0!-1#NUM!MDL #NUM! ABS(TINV(2*0.99,A9))MDLMDLs t(n-1, t-α 0.99) * Ss A12 * A107035
7/16/2020MDLs Calculation12345678Average Std Dev Deg of Freedom t(n-1) MDLs 0.0960.0930.00672.998In this example, the MDLscalculation produced an MDLs of0.017 mg/L.MDLs t(n-1, t-α 0.99) * Ss 2.998 * 0.006 0.0170.01771Where to find Students t valuesEPA’s Method Detection Limit Publication:EPA 821-R-16-006NIST.gov da/section3/eda3672.htmOr just use the spreadsheet function forStudents t.7236
7/16/2020Organize Your InformationAnalyte:Spike Conc:Method:Replicate12345678AverageStd DevDeg of Freedomt(n-1)Ammonia0.100 mg/LSOP 301, Ammonia by Specific Ion Electrode (SM 4500-NH3 0870.0880.1040.0950.0880.0960.0930.00672.998MDLs MDL based on spiked .01773Is Your MDL Reasonable?Is the calculated MDL 0 ?Is the calculated MDL 0.1 * spikeconcentration?Is the spike concentration calculatedMDL?Is the spike concentration between 1 and10 times the MDL?7437
7/16/2020Is Your MDL Reasonable?In our example, for ammonia by specificion electrode:Spike Concentration 0.100 mg/LAverage of eight replicates 0.093Standard deviation 0.006MDLs 0.01775Is Your MDL Reasonable? Is the calculated MDL 0 ?0.017 0 Is the calculated MDL 0.1 * spike concentration?0.017 0.1 * .100 Is the spike concentration calculated MDL?0.100 0.017 Is the spike concentration between 1 and 10times the MDL?0.017 0.100 0.177638
7/16/2020Do your spike results makesense?Replicate12345678AverageStd DevDeg of 4.688.096.092.95.7Does the % recovery foreach replicate makesense?Are all spike resultswithin 2 standarddeviations of the mean?77We’re not done yet.Remember: the MDL is the greater of MDLsand MDLbWe still need to calculate MDLb7839
7/16/2020Data Needed: Method Blanks Minimum of seven method blanks Must use most recent available data Data must be from at least threeseparate batches analyzed on threeseparate days Data must have been generated withinthe last 24 months.79How should we evaluate methodblank data? If none of the method blanks give numericalresults, MDLb does not apply If some, but not all, of method blanks givenumerical results, MDLb is the highestmethod blank result. If more than 100method blanks, set MDLb to number no lessthan 99th percentile. If all method blanks have numerical results,MDLb X (t n-1, t-α 0.99) *Sb)8040
7/16/2020MDLbMDLb X (t n-1, t-α 0.99) *Sb)WhereMDLb the method detection limit based on blank samplesX mean of the method blank resultst(n-1, t-α 0.99) Student’s t-value at 99% for standard deviation with n-1degrees of freedomSbstandard deviation of the method blank analyses 81Example Data: MDLbContinuing our ammonia analysis example, let’sassume the laboratory tested ammonia twelvetimes the previous year and thus have 12 blankresults.test datemg/L Ammoniatest datemg/L /1/20190.005812/1/20190.00548241
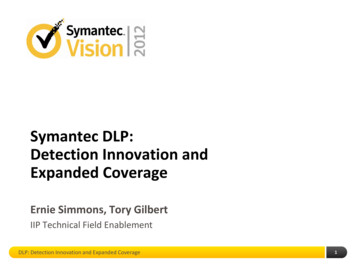
7/16/2020MDLb CalculationAtestdateBanalysisresultCD12average Sb, std dev 345count deg of freedom students t (n-1) 67Average: IF(average(B1:B12) 0,0,average(B1:B12))Standard Deviation stdev(B1:B12)#DIV/0!#DIV/0!0-1#NUM!MDLb X t (n-1)(Sb)89101112 #DIV/0!Count: count(B1:B12)Degrees of Freedom D3-1Students t ABS(TINV(2*0.99,D4))MDLb X (t(n-1, t-α 0.99) *Sb) D2 (D3 * D4)83MDLb .002900.01230average Sb, std dev .00710count deg of freedom students t (n-1) 002300.00540In this example, theMDLb calculationproduced an MDLb of0.016 mg/L.2.718MDLb X t (n-1)(Sb) 0.0168442
7/16/2020So what is the MDL?The MDL is the greater of MDLs and MDLbFor our example:MDLs 0.017MDLb 0.016So our MDL 0.017 mg/L85MDL vs. RLMDL – Method Detection LimitRL - Reporting LimitThe RL is the smallest concentration that isreported by a laboratory. The RL may bethe lowest standard used when making acalibration curve.8643
7/16/2020ReferencesDefinition and Procedure for the Determination of theMe
Method Detection Limits A Joint Presentation from . analyte concentration is greater than zero and is determined from analysis of a sample in a given matrix containing the analyte. Procedure 7 low level spikes 2 - 10x the expected MDL MDL T(n-1,1-α 0.99) (S)