Transcription
Water Quality Reporting Limits,Method Detection Limits, andCensored Values:What Does It All Mean?Bradley J. Austin, J. Thad Scott, Mike Daniels and Brian E. HaggardArkansas Water Resources CenterUniversity of Arkansas System Division of AgricultureFS-2016-01 October 20161
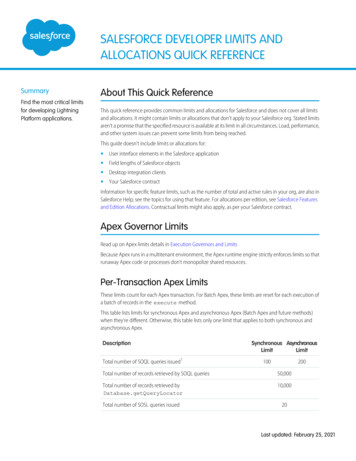
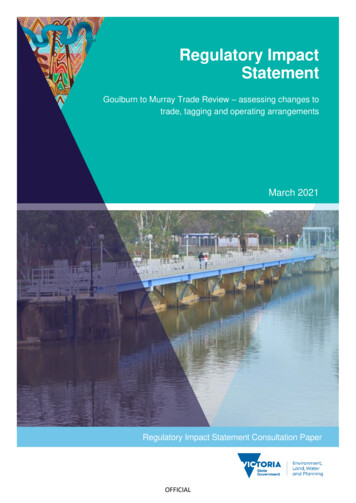
Water Quality Reporting Limits, Method DetectionLimits, and Censored Values: What Does It All Mean?Bradley J. Austin, J. Thad Scott, Mike Daniels, and Brian E. HaggardArkansas Water Resources CenterUniversity of Arkansas System Division of AgricultureThe Arkansas Water Resources Center (AWRC) maintains a fee-based water-quality lab that is certifiedby the Arkansas Department of Environmental Quality (ADEQ). The AWRC Water Quality Lab analyzeswater samples for a variety of constituents, using standard methods for the analysis of water samples(APHA 2012). The lab generates a report on the analysis, which is provided to clientele, and reportsthe concentrations or values as measured.Often times the concentrations or values might be very small, even zero as reported by the lab –what does this mean? How should we use this information? This document is intended to help ourclientele understand the analytical report, the values, and how one might interpret information nearthe lower analytical limits.Every client wants the analysis of their water sample(s) to be accurate and precise, but what do wereally mean when we say those two words? These words are often used synonymously or thought ofas being the same, but the two words mean two different things. Both are equally important whenanalyzing water samples for constituent concentrations.So, What Is The DifferenceBetween Accuracy and Precision?Accuracy of an analysis describes howclose the measured values are to thetrue values (Table 1).High AccuracyLow Precision2Precision of an analysis describes howsimilar measured values are to eachother, regardless of how accurate orinaccurate the analysis may be (Table 1).Low AccuracyHigh PrecisionHigh AccuracyHigh Precision
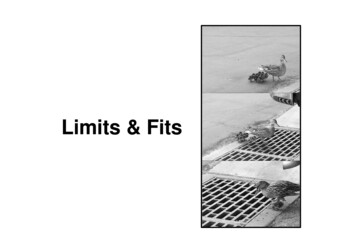
Table 1: Glossary of TermsTermAccuracyPrecisionSignificant DigitsReporting Limit (RL)Method DetectionLimit (MDL)Censored DataDefinitionDescribes how close a measured value is to the true value.Degree of similarity between measured values among duplicates orreplicates of a sample, independent of the accuracy of the values.The number of digits within a measured value that carry meaning.The lowest quantified level within an analytical methods operationalrange.Minimum concentration measured with 99% confidence that thetrue value is greater than zero.Reported value that provides some information about the measuredvalue but limits the accuracy of the values by grouping data intospecific categories (i.e., below MDL, between MDL and RL etc.).Both accuracy and precision are equallyimportant when analyzing water samples.What Are Significant Digits?Significant digits are the number of digits within a value that carry meaning and are determined by thelevel of accuracy and precision that can be attained for each specific method and constituent (Table1). So, the number of significant digits or places beyond the decimal will vary between constituents,as well as with the accuracy and precision of the actual measurements. The significant digits are alsotied to the lower limits of quantification, or how small of a concentration we can actually measure.The goal of water quality analysis (and all analyses) is to have high accuracy and precision. However,every analytical method has a lower limit related to the physical properties of the instrumentationand human error in chemical preparation. As the lower limits of a method are reached, accuracy andprecision of reported values decrease. The AWRC Water Quality Lab derives reporting limits (RLs)and method detection limits (MDLs) for each of the constituents analyzed at the lab to aid in theunderstanding of what the reported values in your water quality analysis report mean.Every analytical method has a lower limitrelated to the physical properties of theinstrumentation and human error inchemical preparation.3
Reporting LimitThe reporting limit, commonly known as the RL, is the lowest concentration of a constituent thatcan be reliably measured with accuracy and precision (Table 1). In many cases, a calibration curve isused to measure the concentration of a constituent in a sample. The AWRC Water Quality Lab reportsthe RL as the lowest non-zero standard that’s used in the calibration for a given analysis. RLs canchange over time, and generally do so to meet the needs for determining MDLs for each constituentas described below.Method Detection LimitThe method detection limit, commonly known as an MDL, should be viewed as the lower concentrationlimit of a constituent that the analytical equipment and technician is capable of detecting (Table1). Concentrations or values below this lower limit should be interpreted cautiously because theconcentration or reported value is lower than what can be measured with sufficient accuracy. TheMDL is based on statistics, and the AWRC Water Quality Lab calculates MDLs every year for eachconstituent.What is The MDL? The MDL for a specific constituent is theminimum concentration that can bemeasured with 99% confidence that theconstituent concentration is greater thanzero (U.S. EPA, 1997; Oblinger Childress etal., 1999). The MDL is a statistically derived valueand, as indicated in the name, is specific tothe method used; additionally it is specificto the laboratory conducting the analysis.Measured values at or belowthe MDL should be interpretedcautiously because the truevalue is lower than what can bemeasured with sufficient accuracy.MDLs can change over time for various reasons, including new or aging equipment, chemical reagents,concentration evaluated, etc. However, these variations should be relatively small in magnitude –but, still it is very common and required for certification to calculate MDLs every year and that’s whatthe AWRC Water Quality Lab does.How is The MDL Calculated?Similar to the U.S. Geological Survey, the AWRC Water Quality Lab follows methods set by the U.S.Environmental Protection Agency (U.S. EPA) to determine the MDLs for almost all constituentsanalyzed in the Lab.12The lab technician adds the constituent to seven blanks (water that does not have the constituentin it at measurable concentrations); the constituent is added at a set concentration equivalent tothe lowest calibration standard or RL.Following the analysis of the seven water samples where the constituent was added, the MDL iscalculated as the standard deviation across the samples multiplied by the Students’ t-value (i.e.,3.14 for n 7) for the 99% confidence interval (U.S. EPA, 1997; Oblinger Childress et al., 1999).4
The MDL must be less than the RL but greater than 1/10 of that concentration. For example if theconcentration for the RL for soluble reactive phosphorus (SRP) is 0.010 mg/L, the MDL should be lessthan 0.010 mg/L but greater than 0.001 mg/L (i.e., 1/10 RL MDL RL).If the MDL is greater than the RL, the procedure must be repeated using a higher concentration forthe RL. Similarly, if the MDL is lower than 1/10 of the RL, the procedure must be repeated using alower concentration for the RL (Rosecrance, 2000).The MDL must be less than the RL but greater than 1/10 of the RL1/10 RL MDL RLHow Should You Interpret Values LessThan the MDL and/or RL? Why are TheseConsidered Estimated Values?The AWRC Water Quality Lab reports the concentrations as measured – we do not censor data thatis greater than zero and above the reported level of significant digits for a constituent (i.e., show thevalues as less than ( ) the MDL or RL). Therefore, the analytical reports provided to clientele mighthave reported values which are less than the MDL and or RL. The lab reports the concentration datalike this to allow clientele to determine how concentrations less than the lower limits of detection willbe interpreted. It is important to remember that values below the MDL may be difficult to distinguishbetween an actual measured value and background noise of the analytical equipment.5
Interpreting Values Less than the MDL and RL Con. For example, if you get your water quality analysis report back and the reported value of a watersample for SRP is 0.001 mg/L but the MDL is 0.002 mg/L, you cannot say for certain that theactual concentration is different from zero.Reported values that fall between the RL and MDL should also be considered as estimated values, butwe would generally have more confidence in the accuracy of these measures – that is, these valuesare probably good estimates of the actual concentrations. However, measured values falling withinthis range are approaching the analytical limits of the lab’s equipment and methods and our clienteleshould be aware that these values are less than the RL. Keeping with the same example, if your reported SRP value is 0.004 mg/L and the RL is 0.005mg/L, it is certain that the actual concentration is greater than zero but we cannot be certain ofthe accuracy of the reported value. However, if the reported value is 0.006 mg/L, as this value is greater than the RL we should havehigh confidence in the accuracy of the reported value.With this understanding in mind, all values below the MDL and RL are estimated and denoted withan “E” to the left of the value in each analytical report. These values should be analyzed and reportedwith caution, realizing that the values reported may not be true to what is actually present in thesample. The AWRC Water Quality Lab allows its clientele to determine the best way to handle thesevalues.With few exceptions the AWRC reportsvalues as they are measured to allow ourclientele the ability to determine the bestway to analyze and report their own data.6
What Are Censored Data, and Why Can TheseValues Be Problematic?Censored data relate to values that fall below specific detection limits for a particular constituent(Table 1). If a concentration falls below the applicable MDL, instead of reporting that measuredvalue, water-quality labs might report the MDL with a less than sign next to the value. Returning to the first example where the measured SRP value fell below the MDL, some labsmay report 0.002 mg/L, instead of 0.001 mg/L.Additionally, some labs may report only the MDL for any measured value that falls between theMDL and RL. In the example where the measured SRP value was 0.004 mg/L, between the RL and MDL, somewater-quality labs might report 0.002 mg/L (the MDL) instead of 0.004 mg/L.While this provides more information about the true value of the constituent for the sample thanjust reporting 0, data about the true value of the constituent is lost. The AWRC water quality labreports values as they are measured even when these are less than the MDL and RL, instead ofreporting the MDL. This allows researchers or clientele to control how they prefer to analyze andreport data.The AWRC Water Quality Lab only reports censored data when the measured value is negative andor below the reported level of significant digits for a constituent. In the event of a negative valuemeasured for a constituent, zero is reported. Similarly, a zero is reported when the measured valuefor a constituent is lower than the reported level of significant digits. For example, the measuredvalue for SRP in a sample is 0.0002 mg/L; however, since the number of significant digits reportedfor this constituent is 3, when the measured value is rounded to three significant digits the reportedvalue will be 0.000 mg/L. So, it is not necessarily that there is no SRP in the water sample – it is thatthere is no measureable concentration of SRP in the water sample at the lab’s level of accuracy,precision, and significant decimal places.Values below the MDL may be difficult to distinguish betweenan actual measured value and background noise of the analyticalequipment.7
Literature CitedAPHA (American Public Health Association). 2012. Standard Methods for the Examination of Water and Wastewater (22nd edn.).American Public Health Association: Washington D.C. 1496 pp.Oblinger Childress, C.J., W.T. Foreman, B.F. Connor, and T.J. Maloney. 1999. New reporting procedures based on long-term methoddetection levels and some considerations for interpretations of water-quality data provided by the U.S. Geological SurveyNational Water Quality Laboratory. U.S. Geological Survey. Open-file report 99-193.Rosecrance, A. 2000. The three “Rs” for relevant detection, reliable quantitation and respectable reporting limits. Environ. TestingAnal. 9(6):13.US Environmental Protection Agency, 1997. Guidelines establishing test procedures for the analysis of pollutants (App. B, Part 136,Definition and procedures for the determination of the method detection limit): U.S. Code of Federal Regulations, Title 40,revised July 1, 1997, p. 265-267.How to Cite This Fact SheetAustin, B.J., J.T. Scott, M. Daniels, B.E. Haggard. 2016. Water Quality Reporting Limits, Method Detection Limits, and Censored Values:What Does it All Mean?. Arkansas Water Resources Center, Fayetteville, Arkansas, FS-2016-01: 8 pp.Arkansas Water Resources Center479.575.4430awrc@uark.eduCollege of Engineering203 Engineering HallUniversity of ArkansasFayetteville, AR 727018
Water Quality Reporting Limits, Method Detection Limits, and Censored Values: . Similarly, a zero is reported when the measured value for a constituent is lower than the reported level of significant digits. For example, the measured value for SRP in a sample is 0.0002 mg/L; however, since the number of significant digits reported .