Transcription
FURNACE CO EMISSIONS UNDER NORMALAND COMPROMISED VENT CONDITIONSFURNACE #4 - HIGH-EFFICIENCY INDUCEDDRAFTOctober 2000Prepared by Christopher J. BrownRonald A. JordanDavid R. TucholskiDirectorate for Laboratory SciencesThe United States Consumer Product Safety CommissionWashington, D.C. 20207
1.INTRODUCTION . 12.TEST EQUIPMENT AND SETUP . 1a.Furnace. 1b.Test Chamber and Furnace Closet . 2c.Vent Blockage Device and Vent Disconnect. 3d.Measuring Equipment. 4i)Furnace Operating Parameters. 4ii)Gas Sampling Systems. 5iii) Air Exchange Rate . 5iv) Room Temperature, Pressure, and Relative Humidity . 5v)Natural Gas . 6vi) Data Acquisition System . 63.TEST METHODS AND PROCEDURES . 6a.Furnace Installation. 6b.Furnace Input Rate. 6c.Test Matrix. 7d.Test Procedures. 74.DATA REDUCTION . 8a.Equilibrium Determination . 8b.Air Exchange Rate . 8c.Emission Rate . 9d.CO Air-Free . 95.RESULTS AND DISCUSSION . 10a.Baseline Tests (Normal Vent). 10b.Blocked Vent Tests . 10i)Degree of Blockage. 10ii)Location of Vent Blockage . 10iii) Input Rate. 11iv) Cycling. 11c.Disconnected Vent Tests . 11i)Location of Vent Disconnect . 11ii
ii)Input Rate. 13iii) Cycling. 13d.Observations . 14i) Furnace Performance when tested “As Received” and 12 Percent Above “AsReceived”. 146.CONCLUSIONS. 14ACKNOWLEDGMENTS . 15REFERENCES . 16APPENDIX A: FURNACE SPECIFICATIONS AND SETUP. 17APPENDIX B: CHAMBER AND FURNACE CLOSET DESCRIPTION . 20APPENDIX C: MEASUREMENT OF FURNACE OPERATING PARAMETERS. 22APPENDIX D: GAS SAMPLING SYSTEM. 24APPENDIX E: FURNACE TEST MATRIX . 26APPENDIX F: DERIVATION OF AIR EXCHANGE RATE AND EMISSION RATE. 28APPENDIX G. TEST DATA RESULTS . 32iii
EXECUTIVE SUMMARYCPSC began a test program in 1999 to evaluate the carbon monoxide (CO) exposure hazardposed to consumers when a furnace vent pipe is blocked or disconnected. This report describesthe test results of a high-efficiency induced draft furnace (Furnace #4); it does not address theassociated health effects.Tests were conducted in an environmentally controlled chamber with the furnace installed insidea closet located within the chamber. The chamber provided a well-mixed environment in whichto measure the CO concentration and also allowed for the air exchange rate to be controlled. Foreach test, the CO concentration and air exchange rate in the chamber were measured. The COemission rate from the furnace was then calculated using a simple mass balance model.Three variables were investigated to determine how each affected the CO emissions from thefurnace: the condition of the vent pipe, the input rate of the furnace, and the operating mode ofthe furnace. Tests were conducted with the vent pipe intact, partially or totally blocked, ortotally disconnected. The furnace was operated at the manufacturer’s specified input rate and atoverfire conditions. The furnace was also operated continuously or cycled on and off.The following is a summary of the test results: The furnace “as received” was not overfired. With a normal vent pipe (no blockage or disconnect), the average steady-state concentrationof CO in the chamber was negligible ( 2 ppm). When the furnace was fired at 100,000 Btu/hr and 112,000 Btu/hr, the average steady-stateCO concentrations in the chamber were relatively low ( 6 ppm) for all test conditions(blocked, disconnected vent pipe, continuous or cycled operation). During blocked vent tests: The average steady-state concentration of CO in the chamber was 6 ppm or less when thevent was blocked up to 86 percent at a point midway between the furnace and vent outlet. With the vent blocked more than 86 percent, the furnace shut off immediately. The location of the vent blockage did not affect the performance of the furnace. Thefurnace shut off immediately when the exhaust vent was completely blocked either at thevent outlet, midway between the furnace and the vent outlet, or at the inducer fan outlet. The CO concentrations in the chamber and the air-free flue gas concentrations werecomparable for cycling and continuous operation tests, when the vent was partiallyblocked. Increasing the firing rate of the furnace did not result in high chamber CO concentrations( 6 ppm). Increasing the firing rate resulted in increasingly high air-free CO concentrations in theflue gases. When the furnace was fired at 100,000 Btu/hr and 112,000 Btu/hr, the air-free COconcentrations in the flue gas ranged from 59 ppm to 545 ppm, respectively. When theinput rate was adjusted to 118,000 Btu/hr and 128,000 Btu/hr, the air-free CO
concentrations in the flue gas ranged from 399 ppm to more than 3,400 ppm,respectively. The current ANSI Z21.47 standard (1998) requires that an air-free flue gassample of CO not exceed a maximum of 400 ppm (0.04 percent) when a furnace vent iseither partially or completely blocked. During disconnected vent tests: The average steady-state concentration of CO in the chamber increased as the firing rateincreased. The concentration of CO was generally higher when the vent was disconnected inside thefurnace closet as opposed to outside of the furnace closet. The furnace generated more CO when it operated continuously than when it was cycledon and off. When the furnace was fired at 100,000 Btu/hr and 112,000 Btu/hr, the air-free COconcentrations in the flue gas ranged from 6 ppm to 37 ppm, respectively. When theinput rate was adjusted to 118,000 Btu/hr and 128,000 Btu/hr, the air-free COconcentrations in the flue gas ranged from 99 ppm to 1,686 ppm. The current ANSIZ21.47 standard (1998) has no requirements for disconnected vents. Depending on the test conditions, the average steady-state concentrations of CO in thechamber ranged from 2 ppm at 100,000 Btu/hr to 159 ppm at 128,000 Btu/hr.
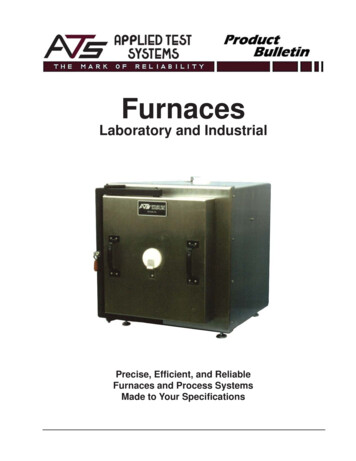
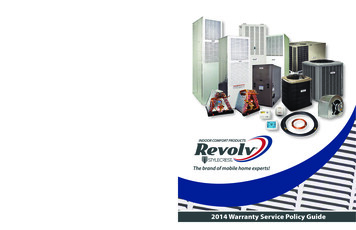
1. INTRODUCTIONCPSC began a test program in 1999 to evaluate the carbon monoxide (CO) exposure hazardposed to consumers when a furnace vent pipe is blocked or disconnected. This test program ispart of CPSC’s effort to reduce deaths and injuries related to carbon monoxide poisoning. Thetest program consists of testing several different furnaces under controlled conditions andmeasuring the amount of CO that accumulates in a room when the vent pipe is partially blocked,totally blocked, or disconnected. The test results will be used to model indoor air concentrationsand assess health effects. These modeling results will then be used to support current andpotential recommendations to the ANSI/CGA Z21.47 Gas Fired Central Furnace subcommittee.For high-efficiency induced draft furnaces, the current ANSI Z21.47 standard (1998) requiresthat the air-free flue gas sample of CO not exceed a maximum of 400 ppm (0.04 percent) whenthe furnace vent pipe is either partially or completely blocked. The ANSI standard does notrequire the furnace to shut off under any blocked vent conditions and does not address the issueof a disconnected vent pipe.This report only describes the test results of a high-efficiency induced draft furnace (Furnace#4), it does not address the associated health affects. Tests were conducted in anenvironmentally controlled chamber with the furnace installed inside a closet located within thechamber. The chamber provided a well-mixed environment in which to measure the COconcentration and also allowed for the air exchange rate to be controlled. The furnace wasoperated at conditions specified by the ANSI Z21.47 standard (1998) and those that could occurin actual use. For all tests, the CO concentration in the chamber and closet were measured aswell as the air exchange rate in the chamber. The CO emission rate from the furnace was thencalculated using the equilibrium CO concentration, the air exchange rate, and a simple massbalance model.2. TEST EQUIPMENT AND SETUPa. FurnaceTests were conducted using an induced draft furnace (Furnace #4). Furnace #4 is a condensing,high-efficiency gas furnace with an Annualized Fuel Utilization Efficiency of 92.6%This furnacewas shipped from the manufacturer preset for use with natural gas and with an energy input rateof 100,000 Btu/hr. Furnace #4 received AGA certification (ANSI Z21.47-CAN/CGA-2.3m1993) as a Category IV unit. The unit is configured for upflow operation (i.e., the circulation airblower is located at the bottom of the unit, blowing supply air upwards, across the primary andsecondary heat exchangers). Figure 2.1 shows the furnace as installed for testing. Appendix Aprovides additional details of the furnace setup and specifications of the furnace.The unit was purchased from a local heating, ventilation, and air conditioning (HVAC) dealerand installed by CPSC staff. On March 24, 1999, CPSC staff met with furnace manufacturingrepresentatives and a representative from the Gas Appliance Manufacturers Association(GAMA) to obtain their input on the test protocol and setup. On May 2, 2000, a representativefrom Furnace #4’s manufacturer met with CPSC staff to witness the test setup and installation ofthe furnace and verified that the furnace was installed and operating properly.1
Figure 2.1. High Efficiency, Induced Draft Test FurnaceBased on the design of the furnace, it must comply with the test provisions of the ANSI Z21.47standard (1993) that govern furnaces that are not equipped with draft hoods (Section 2.22).Although this section of the standard includes provisions for conducting blockage testing atvarious degrees of blockage up to and including complete blockage, there are no requirementsfor a furnace to shutoff under these conditions. Nevertheless, this unit is equipped with apressure switch that monitors the static pressure at the inlet side of the unit’s inducer fan. If thepressure switch opens during operation, the furnace will shut off and enter into a “lockout”mode. This “lockout” prevents the furnace from restarting until the pressure switch closes. Torestart the furnace after “lockout,” the furnace must be de-energized and then energized.b. Test Chamber and Furnace ClosetIn order to accurately model room concentrations of CO, it was necessary to measure COemissions from the furnace in a well-mixed room while controlling the number of air changes inthat room. A modified environmental test chamber was therefore used for the tests. The internalvolume of the chamber was 837 cubic feet (23.7 cubic meters). The chamber was designed toprovide an environment in which the air was well mixed and the temperature, pressure, and airexchange rate could be controlled. In order to prevent back drafting, the differential pressurebetween the chamber and the laboratory was kept near zero using a pressure control system.Appendix B describes the chamber in greater detail.2
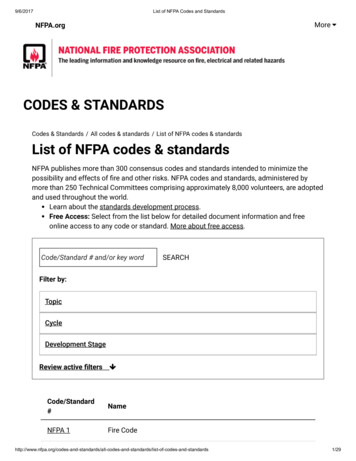
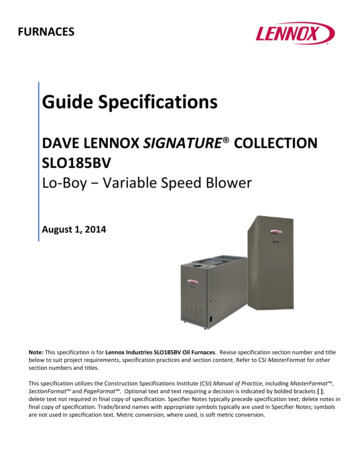
A furnace closet was erected within the chamber. The internal volume of the closet wasapproximately 196 cubic feet (5.55 cubic meters). The closet complied with the National FuelGas Code (1996) and the manufacturer's requirements for a "Confined Space" furnaceinstallation. A well-mixed environment within the closet could not be assumed since no fanswere used to promote mixing. Fans were not used in the closet in order to prevent interferencewith the operation of the furnace. The furnace was positioned inside the closet so that themanufacturer’s specification for minimum distances to combustible surfaces was met. AppendixB describes the furnace closet in further detail.c. Vent Blockage Device and Vent DisconnectAn optical iris was used to create various degrees of vent blockage. Figure 2.2 illustrates the iris(black in color) located in the vent system. Different blockages were obtained by adjusting thediameter of the iris. When the iris was totally closed, blockage was 99.6 percent since a smallhole was still present. For testing purposes, it was assumed that a 99.6 percent blocked vent wasequivalent to a totally blocked vent. The iris was located at a vertical height of 2.87 feet (0.87meters) above the furnace condensate tee and a horizontal distance of 3.69 feet (1.12 meters)from the furnace condensate tee. Figure C.1 in Appendix C illustrates the general location of theiris relative to the furnace.To investigate the effect of the blockage location on the CO emission rate from the furnace,several tests were conducted with the outlet of the vent pipe totally blocked. Blockage wascreated using a vent tee cap. The vent outlet was located approximately at a vertical height of5.17 feet (1.58 meters) and at a horizontal distance of 4.28 feet (1.30 meters) from the furnace.Figure 2.2. Iris Used to Create Vent Blockages3
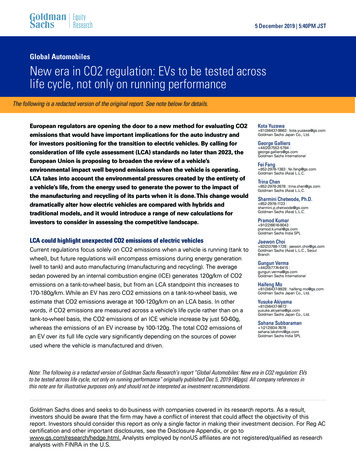
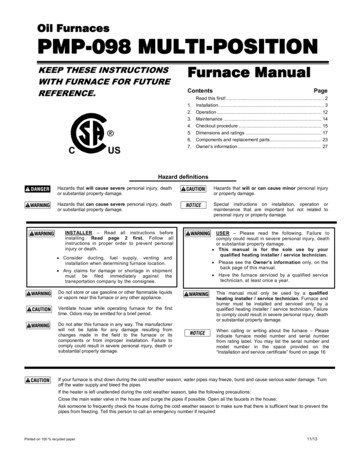
To simulate a disconnected vent pipe, the vent pipe was totally separated from a section of thevent system either inside or outside of the furnace closet. For tests where the vent wasdisconnected inside the closet, the vent pipe was separated 2.87 feet (0.87 meters) above thefurnace condensate tee. Figure 2.3 (a) shows a close up of the vent disconnected inside thefurnace closet. For disconnected vent tests where the vent was disconnected outside of thecloset, that is, in the chamber, the vent pipe was separated at the 90-degree elbow. Figure 2.3 (b)shows the vent disconnected at the 90-degree elbow. The vent elbow was located at a verticalheight of 2.87 feet (0.87 meters) above the furnace condensate tee and a horizontal distance of4.28 feet (1.30 meters) from the furnace condensate tee. Figure C.1 in Appendix C illustrates thelocation of the exhaust outlet and the 90-degree elbow relative to the furnace.(a)(b)Figure 2.3. Disconnected Vent Pipes in (a) the Closet Above the Furnace Top and (b) theChamber Near the 90 Degree Elbow.d. Measuring Equipmenti) Furnace Operating ParametersThe operating parameters of the furnace were measured at different locations using a varietyof equipment. Appendix C provides details of the equipment used and the general locationsof the measurements. The natural gas flow rate to the furnace was determined using a digitalmass flow meter. The gas manifold pressure was measured with a magnehelic pressuregauge. The static pressure in the vent pipe was determined using a piezo ring connected to amagnehelic pressure gauge. The piezo ring was constructed in accordance with Section 2.7of the ANSI Z21.47 standard (1998). The static pressure between the return and supplyducts was measured with a magnehelic pressure gauge. The temperature rise across the heatexchanger was measured using two thermocouples, one in the return duct and one in thesupply duct. The flue gas temperature was measured with a single thermocouple located inthe center of the vent pipe. The air temperature in the unit’s combustion chamber wasmeasured at two locations: (1) near the flame roll-out switch located on the left wall of theunit’s combustion chamber, and (2) near the flame roll-out switch located at the bottom wallof the unit’s combustion chamber.4
ii) Gas Sampling SystemsFour sampling systems were used to measure the concentration of different chemical speciesat various locations. Appendix D provides details of the equipment used and a schematicillustrating the sampling systems. The first system was used to obtain CO, CO2, and O2samples from the chamber. The concentrations of CO and CO2 were measured using nondispersive infrared (NDIR) gas analyzers, and O2 was measured using a paramagneticanalyzer. Samples were obtained from five locations inside the chamber. The sampling linesfrom these five locations fed into a common mixing manifold. The mixing manifold wasthen connected to the gas analyzers using a single sampling line.A second sampling system was used to obtain samples from the closet or flue gas. A threeway valve was used to switch between the closet and flue gas sampling lines. Carbonmonoxide, carbon dioxide, and hydrocarbons (HC) were measured using NDIR gas analyzersand oxygen was measured using a paramagnetic analyzer. Flue gas samples were taken froma single location downstream of the flue collar. Closet air samples were taken from fivelocations inside the closet. The sampling lines from these five locations fed into a commonmixing manifold. The mixing manifold was then connected to the three-way valve using asingle sampling line. To prevent water from condensing inside the gas analyzers during thesampling of the flue gas, the water was condensed out of the sample prior to entering theanalyzers. A simple heat exchange system using recirculated chilled water was used tocondense the water out of the gas sample.A third sampling system was used to obtain the concentration of CO in the return and supplyducts. A three-way valve was used to switch between the return and supply duct samplelines. The concentration of CO was measured with a NDIR gas analyzer.A fourth sampling system was used to obtain the background concentration of CO in thelaboratory. A NDIR gas analyzer was used to measure the concentration of CO. Thesampling line was positioned near the inlet pipe that brought fresh air into the chamber.iii) Air Exchange RateTo determine the air exchange rate in the chamber and closet, the tracer gas sulfurhexafluoride (SF6) was injected into the chamber. The flow rate of SF6 was measured usinga rotometer and the concentrations of SF6 in the chamber and closet were measured with anelectron capture gas chromatograph analyzer. To ensure that the tracer gas was evenlydistributed, the gas was injected above each set of fans used with the four fin-and-tube heatexchangers. Samples were obtained using the existing sampling lines for the chamber andcloset (Appendix D). To verify the number of air changes per hour (ACH) obtained with theSF6 tracer gas, CO was also injected into the chamber during several tests. A mass flowcontroller was used for the CO injection and the NDIR analyzers for the chamber and closetwere used to measure the CO concentrations.iv) Room Temperature, Pressure, and Relative HumidityThe temperature in the chamber was measured with four thermocouples. The thermocoupleswere located near each corner in the chamber. The temperature in the closet was measuredwith a single thermocouple located approximately midway between the floor and the ceiling.5
A thermocouple was also used to measure the ambient air temperature entering the chamber.The thermocouple was positioned near the inlet pipe for the fresh air supply to the chamber.A photohelic pressure gauge was used to measure the differential pressure between thechamber and the laboratory. The pressure gauge was part of the pressure control system usedto prevent the chamber from becoming over or under pressurized relative to the laboratorybuilding in which the chamber was located.The local pressure and temperature in the laboratory was obtained using a barometer with abuilt in thermometer. The relative humidity of the laboratory air was measured with a digitalhygrometer.v) Natural GasThe furnace was fired with natural gas obtained from a city supply line. The daily averagehigher heating value of the natural gas was obtained from the local gas supplier (WashingtonGas). In addition, the gas company supplied the daily average chemical composition of thenatural gas.vi) Data Acquisition SystemA data acquisition system was used to record the majority of the data. The system consistedof a personal computer running LABTECH NOTEBOOK data acquisition software thatrecorded the data every 20 seconds. The data acquisition program recorded the raw voltageoutput from the various measuring devices (gas analyzers, thermocouples, pressure gauges,and flow meter) into a data file. The program converts these voltage readings directly intothe appropriate units for concentration (percent or parts per million), temperature (degreesFahrenheit), pressure (inches of water column), and flow rate (cubic feet per minute). Theseconverted values were recorded in the data file. The only items not recorded electronicallywere the SF6 flow rate from the rotometer, the vent pressure, the differential pressurebetween the chamber and laboratory, and the barometric pressure, temperature and relativehumidity of the laboratory. A second computer was used with the SF6 analyzer to record theconcentrations.3. TEST METHODS AND PROCEDURESa. Furnace InstallationThe furnace was installed according to the manufacturer’s installation instructions and theNational Fuel Gas Code (1996) as a one-pipe system. To confirm proper furnace operation, thetemperature rise across the heat exchanger and the static pressure between the return and supplyducts were checked for compliance with the manufacturer’s specifications.b. Furnace Input RateThe furnace input rate was set by adjusting the gas manifold pressure. This was accomplishedby turning the adjustment screw of the pressure regulator clockwise to increase the pressure orcounter clockwise to decrease the pressure. All input rates reported in this report are within 3percent of the stated values. The input rates were calculated using an average higher heatingvalue of 1040 Btu per cubic feet.6
The input rate was initially determined before any adjustments were made to the gas manifoldpressure. This input rate, termed “as received” is the input rate that would occur if the furnaceinstaller did not clock the gas flow or adjust the manifold pressure. The “as received” rate wasapproximately 100,000 Btu/hr, which was in accordance with the manufacturer’s specified rateof 100,000 Btu/hr.The original test plan included testing the furnace in accordance with the overfire provisions ofANSI Z21.47 (1998). These provisions require that the furnace input rate be adjusted to 12percent above the manufacturer’s specified rate. Additional tests were conducted at amoderately elevated manifold pressure setting, and at the maximum manifold pressure settingand resulted in firing rates of 118,000 Btu/hr and 128,000 Btu/hr, respectively. Staff decided totest the furnace at the maximum manifold pressure to determine whether the furnace’s COemissions tended to increase as the firing rate of a furnace increased. CPSC incident datademonstrates that some furnaces involved in CO exposure have, upon inspection, been found tobe overfired.c. Test MatrixTable E.1 in Appendix E shows the Furnace Test Matrix. It should be noted that not all testslisted in Table E.1 were necessarily performed. The test plan design allowed for omission ofsome tests within the Baseline, Blocked Vent, and Disconnected Vent tests if certain criteriawere satisfied. The criteria for omission were as follows: (1) if a shutoff device or other aspectof a furnace design caused it to shutdown during any of the incremental blockage ordisconnected vent conditions; or (2) if the furnace continued to operate under overfire (“asreceived”), partial blockage or disconnect conditions, but the resultant chamber COconcentrations were negligible; or (3) if the furnace input rate, as installed, was within 3percent of the manufacturer’s specified input rate. If either of the first two criteria were satisfied,then tests involving lesser degrees of vent blockage or disconnect were omitted.Each test had three main variables: (1) the condition of the vent pipe, (2) the input rate to thefurnace, and (3) the operating mode of the furnace. The vent pipe was intact (baselinecondition), blocked, or disconnected. For blockage tests, the vent was blocked from 86 to 100percent. Tests with the vent totally blocked were similar to the blocked vent shut off testrequired by ANSI Z21.47 standard (Section 2.19, 1998). For disconnected vent tests, the ventwas totally separated from the vent system in the closet or in the chamber. The furnace wastested at input rates of 100,000 Btu/hr, 112,000 Btu/hr, 118,000 Btu/hr, and 128,000 Btu/hr forbaseline, blocked and disconnected vent tests. The furnace was operated either continuously orit was cycled on for 8 minutes and off for 2 minutes. The cycling rate was based on informationobtained from the AGA booklet, “Fundamentals of Gas Appliances” (1996). The booklet statesthat, as a rule-of-thumb, the optimal cycling rate of a furnace burner is approximately six timesper hour. The booklet also states that this optimal cycling rate will be maintained if the furnaceis operating 20 to 80 percent of the time. Therefore, a cycle time of 8 minutes on and 2 minutesoff was used.d. Test ProceduresAt the start of each day, the gas analyzers were calibrated according to the instructions specifiedby the manufacturer of the analyzer. In general, the meters were zeroed with nitrogen gas andspanned using a gas of known concentration (EPA protocol). The analyzers were also checked7
at mid- and low-range concentrations to verify the performance of the analyzers. To begin anactual test, the data acquisition program was started. The furnace was then started by setting thecycle timer to operate continuously or to cycle on and off. The cycle timer was used to simulatea call for heat by a thermostat. The furnace was allowed to warm up for 15 minutes in order toreach equilibrium. This 15 minute warm up is similar to many test protocols in the ANSI Z21.47standard (1998). During this warm up period the manifold pressure was adjusted as required toattain the desired input rate. At approximately 15 minutes, the flue gas sample was obtained andthe gas flow rate was recorded. If the vent was to be blocked or disconnected, staff entered thechamber and closet (if necessary) and made the appropriate changes to the vent pipe. The closetand chamber doors were closed and the SF6 tracer gas injection was started. The injection of thetracer gas continued until it had reached an equilibrium concentration in the chamber(approximately one hour). By this time, the concentrations of the other chemical species (CO,O2, and CO2) had also reached equilibrium. After reaching equili
Increasing the firing rate resulted in increasingly high air-free CO concentrations in the flue gases. When the furnace was fired at 100,000 Btu/hr and 112,000 Btu/hr, the air-free CO concentrations in the flue gas ranged from 59 ppm to 545 ppm, respectively. When the input rate was adjusted to 118,000 Btu/hr and 128,000 Btu/hr, the air-free CO