Transcription
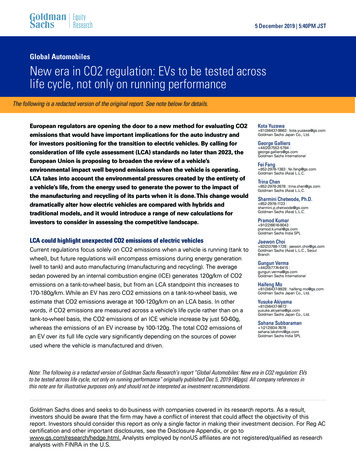
5 December 2019 5:40PM JSTGlobal AutomobilesNew era in CO2 regulation: EVs to be tested acrosslife cycle, not only on running performanceThe following is a redacted version of the original report. See note below for details.European regulators are opening the door to a new method for evaluating CO2emissions that would have important implications for the auto industry andfor investors positioning for the transition to electric vehicles. By calling forconsideration of life cycle assessment (LCA) standards no later than 2023, theEuropean Union is proposing to broaden the review of a vehicle’senvironmental impact well beyond emissions when the vehicle is operating.LCA takes into account the environmental pressures created by the entirety ofa vehicle’s life, from the energy used to generate the power to the impact ofthe manufacturing and recycling of its parts when it is done. This change woulddramatically alter how electric vehicles are compared with hybrids andtraditional models, and it would introduce a range of new calculations forinvestors to consider in assessing the competitive landscape.Kota YuzawaLCA could highlight unexpected CO2 emissions of electric vehiclesJaewon ChoiCurrent regulations focus solely on CO2 emissions when a vehicle is running (tank towheel), but future regulations will encompass emissions during energy generation(well to tank) and auto manufacturing (manufacturing and recycling). The averagesedan powered by an internal combustion engine (ICE) generates 120g/km of CO2emissions on a tank-to-wheel basis, but from an LCA standpoint this increases to170-180g/km. While an EV has zero CO2 emissions on a tank-to-wheel basis, weestimate that CO2 emissions average at 100-120g/km on an LCA basis. In otherwords, if CO2 emissions are measured across a vehicle’s life cycle rather than on atank-to-wheel basis, the CO2 emissions of an ICE vehicle increase by just 50-60g,whereas the emissions of an EV increase by 100-120g. The total CO2 emissions ofan EV over its full life cycle vary significantly depending on the sources of power 81(3)6437-9863 kota.yuzawa@gs.comGoldman Sachs Japan Co., Ltd.George Galliers 44(20)7552-5784 george.galliers@gs.comGoldman Sachs InternationalFei Fang 852-2978-1383 fei.fang@gs.comGoldman Sachs (Asia) L.L.C.Trina Chen 852-2978-2678 trina.chen@gs.comGoldman Sachs (Asia) L.L.C.Sharmini Chetwode, Ph.D. 852-2978-1123 sharmini.p.chetwode@gs.comGoldman Sachs (Asia) L.L.C.Pramod Kumar 91(22)6616-9043 pramod.kumar@gs.comGoldman Sachs India SPL 82(2)3788-1728 jaewon.choi@gs.comGoldman Sachs (Asia) L.L.C., SeoulBranchGungun Verma 44(20)7774-6415 gungun.verma@gs.comGoldman Sachs InternationalHaifeng Mo 81(3)6437-9928 haifeng.mo@gs.comGoldman Sachs Japan Co., Ltd.Yusuke Akiyama 81(3)6437-9872 yusuke.akiyama@gs.comGoldman Sachs Japan Co., Ltd.Sahana Subbaraman 1(212)934-7678 sahana.lakshmi@gs.comGoldman Sachs India SPLused where the vehicle is manufactured and driven.Note: The following is a redacted version of Goldman Sachs Research’s report “Global Automobiles: New era in CO2 regulation: EVsto be tested across life cycle, not only on running performance” originally published Dec 5, 2019 (46pgs). All company references inthis note are for illustrative purposes only and should not be interpreted as investment recommendations.Goldman Sachs does and seeks to do business with companies covered in its research reports. As a result,investors should be aware that the firm may have a conflict of interest that could affect the objectivity of thisreport. Investors should consider this report as only a single factor in making their investment decision. For Reg ACcertification and other important disclosures, see the Disclosure Appendix, or go towww.gs.com/research/hedge.html. Analysts employed by nonUS affiliates are not registered/qualified as researchanalysts with FINRA in the U.S.
Goldman SachsGlobal AutomobilesTable of ContentsLCA captures CO2 emissions across the whole life of a vehicle5Tank to wheel: We expect existing rules to remain in place, turning point should come in 202010Well to tank: Adding fuel CO2 emissions12Manufacturing and recycling: CO2 emissions from auto/battery production also targeted14China primary energy mix: Low carbon challenge17Battery: LCA is driving changes in battery capacity per vehicle and key technological innovation19Disclosure Appendix235 December 20192
Goldman Sachs5 December 2019Global Automobiles3
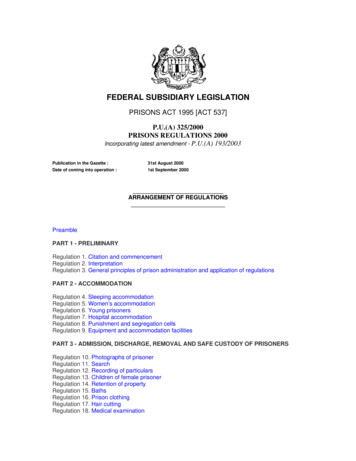
Goldman SachsGlobal AutomobilesExhibit 1: LCA takes a holistic view of CO2 emissionsCO2 life cycle for automobiles (image of mid-size sedan)Source: Goldman Sachs Global Investment Research5 December 20194
Goldman SachsGlobal AutomobilesLCA captures CO2 emissions across the whole life of a vehicleLife cycle assessment overviewLCA measures the environmental burden across the whole life cycle of a car, fromproduction to driving and ultimately recycling parts of the vehicle. According to adocument published by the European Commission on April 2019, the Commissionshould no later than 2023 evaluate the possibility of developing a common Unionmethodology for the assessment and the consistent data reporting of the full life-cycleCO2 emissions of such vehicles placed on the Union market. The Commission shouldadopt follow-up measures, including, where appropriate, legislative proposals.Automakers currently provide each vehicle’s CO2 emissions on a tank-to-wheel basis,but if the European Union adopts the LCA approach, this would reveal theenvironmental impact of a vehicle across its life cycle, including the production of thevehicle itself and its fuel source, the vehicle scrapping process, as well as the potentialto reduce environmental impact by recycling parts of the vehicle at the end of its life.Current challenges posed by LCAThe International Organization of Standardization introduces standards specific to LCAas part of its family of standards on environmental management. At this stage, it isdifficult to anticipate exactly how the introduction of LCA standards could affect the waypotential buyers compare vehicles. LCA covers not only CO2 emissions, but also otherfactors that determine the total environmental impact of a vehicle, includingacidification, eutrophication caused by runoff from land and water, and the use of abioticresources. In this report, we look primarily at the climate change aspect of LCA —specifically, CO2 and other greenhouse gas emissions — and we consider how theintroduction of an LCA framework could change the fuel economy of vehicles.LCA could highlight unexpected CO2 emissions of electric vehiclesThe average sedan powered by an internal combustion engine (ICE) generates 120g/kmof CO2 emissions on a tank-to-wheel basis, but from an LCA standpoint this increasesto 170-180g/km. While an EV has zero CO2 emissions on a tank-to-wheel basis, weestimate that CO2 emissions average at 100-120g/km on an LCA basis. In other words,if CO2 emissions are measured across a vehicle’s life cycle rather than on atank-to-wheel basis, the CO2 emissions of an ICE vehicle increase by just 50-60g,whereas the emissions of an EV increase by 100-120g. The total CO2 emissions of anEV over its full life cycle vary significantly depending on the sources of power usedwhere the vehicle is manufactured and driven. In Europe, for example, where cleanenergy sources such as nuclear power and hydro power are relatively widespread, EVsstill compare favorably with other types of vehicles if CO2 emissions are measured froman LCA standpoint. However, in Japan and other markets outside Europe, where fossilfuels such as crude oil and coal are still the main sources of energy, EVs are lessattractive in terms of the overall scope for reducing environmental impact.5 December 20195
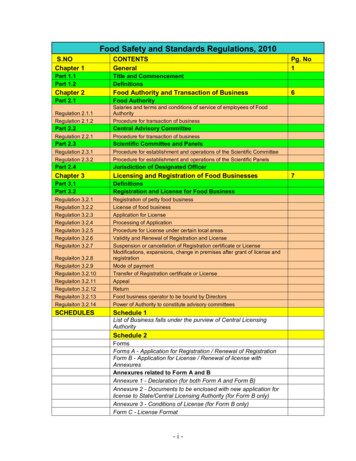
Goldman SachsGlobal AutomobilesAnother variable is how total driving distance is calculatedCO2 emissions measured on an LCA basis vary widely depending not only on acountry’s energy mix but also on how a vehicle’s average driving life is defined. InEurope, the assumption is that EVs have an average driving life of 180,000 km,compared to 110,000 km in Japan. Therefore, the CO2 emissions of EVs compare morefavorably in Europe, where the cars are expected to be driven over a longer totaldistance. We compare Europe and Japan in Exhibits 2 and 3, taking the abovedefinitions into account.Exhibit 2: EVs come out on top in EuropeExhibit 3: Next-generation hybrid vehicles may provide a solutionCO2 emissions measured on an LCA basis in Europe (assumingemissions of 100 for ICE vehicles)CO2 emissions measured on an LCA basis in Japan (assumingemissions of 100 for ICE vehicles)Based on Europe’s projected energy mix in 2030, CO2 intensity includes power transmission lossBased on Japan’s projected energy mix in 2030, CO2 intensity includes power transmission lossSource: Toyota Motor presentation at the 2019 Vienna Motor SymposiumSource: Toyota Motor presentation at the 2019 Vienna Motor SymposiumFurther advances in technology essential for HEVs to retain their edgeHEVs, which tend to be more profitable for automakers, could see their competitiveadvantage threatened if LCA is widely adopted. Current HEVs could become muchlarger emitters of CO2 than EVs especially in Europe, where clean energy proliferates. Incountries with low reliance on nuclear power, such as Japan, however, automakers havealready achieved CO2 emissions in HEVs on par with those of EVs. Moreover, ifnext-generation HEV technology advances that automakers are currently working on arerealized, HEVs could beat EVs in terms of CO2 emissions based on LCA standards.There are significant challenges to overcome, including in the areas of advanced heatmanagement, extreme insulation, ultra-lean burn, and laser ignition, but we think thefact that automakers, especially Japanese automakers, are aiming to boost enginethermal efficiency to 50% from just over 40% is significant.5 December 20196
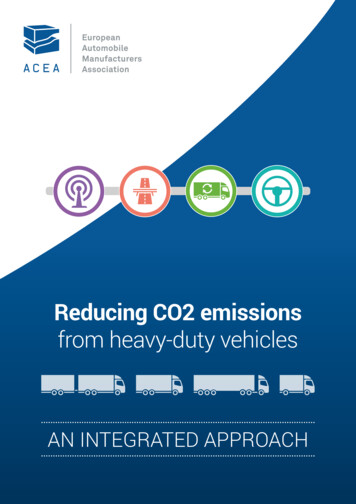
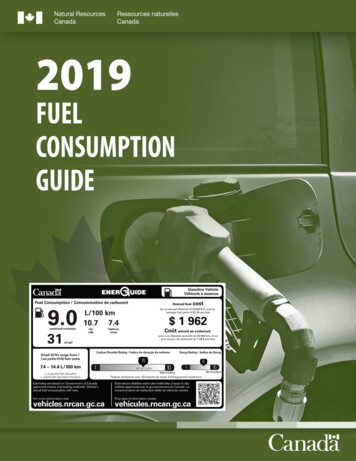
Goldman SachsGlobal AutomobilesExhibit 4: Good prospects for increased engine efficiencyEngine thermal efficiencySource: Goldman Sachs Global Investment ResearchNext 10 years to be the HEV era, followed by the EV eraChina is gradually introducing tougher new energy vehicle (NEV) regulations and vehicleemission standards and the EU will tighten CO2 emission standards from 2020.Automakers are implementing electrification strategies to minimize the impact of tighterregulations. Governments are gradually shifting from electric vehicle (EV) policies toelectrified vehicle policies as a more realistic solution to reducing CO2 emissionsbecause of battery prices, driving ranges, charging infrastructure, and other hurdles toestablishing a mass market for EVs. For at least the next 10 years, we believe hybridsystems will be the main form of vehicle electrification adopted by automakers to meetstricter environmental regulations being introduced around the world (expected over2025-2030). However, after that we foresee significant progress in electrification,supported by the introduction of LCA, changes in the structure of power sourcesunderpinned by the Paris Agreement, and lower battery prices. We expect EVs toaccount for only 10% of sales in 2030, but expect the weighting to rise to 33% by 2040.We think HEV and EV sales will trade places in 2037.Exhibit 5: We foresee rapid growth in EVs through 2040Exhibit 6: EVs and HEVs likely to trade places in 2037Global powertrain forecastsElectrification forecasts through 2040Source: IHS Global Insight, Goldman Sachs Global Investment ResearchSource: IHS Global Insight, Goldman Sachs Global Investment Research5 December 20197
Goldman SachsGlobal AutomobilesSignificant regional disparities in electrificationThere will likely be major differences between countries and regions in terms of thepace of electrification. We think EV proliferation will not be consumer-led through 2030.Our forecasts are based on the minimum volume automakers have to sell to meetregulations. Accordingly, we think electrification will make far greater progress inEurope, which has the world’s tightest CO2 emission rules, than in other countries. Weexpect the sales weighting of EVs in Europe to reach 22% in 2030, due partly to theadoption of LCA, and think it will likely be far higher than in other regions. Lookingfurther ahead to 2040, however, we think EV sales in other regions will likely catch upwith those in Europe due to lower battery prices (falling to 100/kWh or lower) and thespread of clean energy.Exhibit 7: Europe set to take the lead in the shift to EVsExhibit 8: Other countries likely to catch up with Europe by 2040Powertrain forecasts by regionEV sales weightingSource: Goldman Sachs Global Investment ResearchSource: Global Insight, Goldman Sachs Global Investment Research5 December 20198
Goldman SachsGlobal AutomobilesParis Agreement likely to have significant impactChallenging targetsThe Paris Agreement is an international treaty on climate change control that was concluded by numerouscountries at the 2015 United National Climate Change Conference (COP21) in Paris and went into force thefollowing year. The common target is to keep the increase in the average global temperature in 21stcentury to less than 2 C above pre-industrial levels and to pursue efforts to limit the increase to 1.5 C.Countries not moving forward in unisonSignatory countries agreed to set interim (2030) targets and were asked to submit long-term targets by2020. As of now, only fewer than 10 out of more than 180 countries have submitted long-term targets.More long-term target announcements from other countries are expected. The US has announced itswithdrawal from the Paris Agreement.Heavy burden for automakersChina, the world’s largest auto market, has only set 2030 targets, while the US, the world’s second largestauto market, has announced to withdraw from the Paris Agreement. This makes it harder for automakersto formulate business plans.Exhibit 9: Waiting for 2050 target announcementsCountries’ CO2 emission reduction targets and weightings in global auto demandSource: Ministry of Economy, Trade and Industry, IHS Global Insight5 December 20199
Goldman SachsGlobal AutomobilesTank to wheel: We expect existing rules to remain in place, turning pointshould come in 2020Pillar of existing CO2 emission rules; EVs the best solutionExisting CO2 emission rules are all on a tank-to-wheel basis, which means they coveronly CO2 emitted when vehicle engines are running. As they take no account of theenvironmental impact of vehicle/fuel production, they regard EVs as zero CO2 emissionvehicles, and naturally position them as superior to existing vehicles, including hybrids.Despite their poor profitability, automakers are trying to increase their sales of EVs tocomply with 2020-2021 European CO2 emission rules (95 g/km, tank to wheel).Exhibit 10: EVs are the most logical choice under current rulesExhibit 11: European rules are the strictestTank-to-wheel CO2 emissions (LCA emissions of existing vehicles 100)CO2 emission regulations for certain countries/regionsSource: Toyota Motor presentation at the 2019 Vienna Motor Symposium, Data compiled byGoldman Sachs Global Investment ResearchSource: US Department of Transportation, European Commission, Ministry of Industry andInformation Technology, Ministry of Land, Infrastructure, Transport and Tourism, Goldman SachsGlobal Investment ResearchEuropean CO2 emission rules are very strictIn 2018, the average CO2 emission in the European car industry was 121g/km. This iswell above (by 26g/km) the 2020-2021 target of 95g/km, exposing many automakers torisk of fines (NEDC standards). In general, the challenge posed by the 2020-2021European CO2 rules is made even harder due to the following three points.1. The decline in sales weighting of diesel vehicles since the Dieselgate scandal atVolkswagen in 2015 (fuel consumption is generally around 10% lower in dieselvehicles than in gasoline-fueled vehicles)2. Growth in sales weightings of SUVs and other large vehicles, which is driving upCO2 emissions by maker3. Discussion of the introduction of the Worldwide Harmonised Light Vehicles TestProcedure (WLTP), which will make achievement of CO2 emissions targets evenharderThe decline in sales weighting for diesel vehicles, in particular, is obviously having amajor impact on the auto industry. Achieving the 2020-2021 CO2 emissions targets hasbecome difficult for many automakers since the Dieselgate scandal at Volkswagen in5 December 201910
Goldman SachsGlobal Automobiles2015. However, due to sluggish sales since 2015 of diesel vehicles, which are roughly10% more fuel efficient than gasoline vehicles, improvement in fuel consumption, whichhad been trending around 3% annually, has come to a standstill.CO2 costs will be a major issue in 2020The EU will tighten its CO2 emission standard to 95g/km in 2020. If the target is notmet, a penalty will be applied using the following formula: 95 for each g/km of thetarget exceeded multiplied by vehicle sales volume in the EU. Depending on salesvolume, CO2 penalties could range from several tens of billions of yen to severalhundred billion yen. We believe many automakers will expand their EV sales volume at aloss to minimize any potential CO2 penalties. However, merely shifting the impact frompenalties to unprofitable sales will not reverse the increase in CO2 costs.5 December 201911
Goldman SachsGlobal AutomobilesWell to tank: Adding fuel CO2 emissionsAdding new CO2 emissionsWith the application of LCA, it will become necessary to include CO2 emitted over theentire life cycle in consumption assessments, from well to tank—i.e., from the fuelproduction to the vehicle fuel tank. In the case of EVs, total CO2 emissions will have tobe assessed from the power generation/battery charging stage through driving usingelectricity. With fuel cell vehicles (FCVs), the total includes CO2 emitted as a result ofhydrogen production, transportation, and storage, and operation of the vehicle onhydrogen. EVs, which have an edge on a tank-to-wheel basis, produce nearly twice asmuch CO2 as ICEs and HEVs on a well-to-tank calculation.Exhibit 12: Electricity generation produces more CO2 than gasoline inthe production/transportation processWell-to-tank CO2 emissions (LCA emissions of existing vehicles 100)Source: Toyota Motor presentation at the 2019 Vienna Motor Symposium, Data compiled byGoldman Sachs Global Investment ResearchWell to tank CO2 emissions vary widely depending on power sourceSince CO2 emissions vary widely depending on power source, EVs’ well to tank fuelconsumption also varies depending on where they are used. Examination of CO2emissions per kWh by power source reveals that hydro, nuclear, and wind power havemuch smaller environmental loads, while oil/gas-fired thermal power have much largerloads, with coal-fired thermal power having the highest CO2 emissions.All nations seeking to shift to clean energyEnergy policy will play a greater role in the debate surrounding LCA standards. From anLCA standpoint, Japan will be limited in its capacity to reduce EV CO2 emissionswithout restarting nuclear power operations. Europe, which has been promoting a rapidshift to EVs and where nuclear power is a major power source, achieved CO2 emissionsof 34g/km for EVs on a well to wheel basis in 2015 (vs. 59g/km in Japan). This compareswith 5g/km in France, showing a significant disparity in EV emissions. In contrast, CO2emissions are very high (82g/km in 2015) in China, where coal accounts for a large shareof power production (around 70%). In order to make EVs true eco-friendly vehicles andcombat the worsening issue of global warming, the need for a change in power mix is5 December 201912
Goldman SachsGlobal Automobilesan issue that will likely be addressed in many nations.Exhibit 13: Environmental load of EVs varies widely depending onpower mixExhibit 14: Environmental load varies by regionCO2 emissions during power generation per kWh by regionCO2 emissions per kWh by power sourceSource: CRIEPISource: BP, IEA, Thomson Reuters, Ministry of Economy, Trade and IndustryExhibit 15: EV has advantage in FranceExhibit 16: Environmental impact of EV penetration varies widelydepending on power mixPower supply mix in Japan, China, FrancePower mix by country/region and well to wheel emissionsSource: BP, IEA, Ministry of Economy, Trade and Industry5 December 2019Source: Ministry of Economy, Trade and Industry13
Goldman SachsGlobal AutomobilesManufacturing and recycling: CO2 emissions from auto/battery productionalso targetedCO2 emissions from EV production twice that of ICE vehicle productionLCA standards take into account CO2 emissions from auto production and recycling.Reports by Volkswagen and Mazda put the life cycle CO2 emissions from EV productionat roughly 12,000kg, twice the 6,000kg from ICE vehicle production. The main reasonfor this disparity is CO2 emissions from battery production, which accounts for roughlyhalf of the environmental load of EV production. While there are differences stemmingfrom the power mix, electricity usage (for aluminum smelting, sintering process foractive materials) accounts for roughly half of the environmental load of batteryproduction.Exhibit 17: Battery production process has high environmental loadin EV productionExhibit 18: CO2 emissions from battery production account forroughly half of emissions from EV productionCO2 emissions from vehicle production/recycling (LCA emissions ofconventional vehicle 100)Breakdown of CO2 emissions from EV productionSource: Toyota Motor presentation at the 2019 Vienna Motor Symposium, Data compiled byGoldman Sachs Global Investment ResearchSource: compiled by Goldman Sachs Global Investment ResearchEnvironmental load of battery production varies widely by regionWhile CO2 emissions from battery production vary widely depending on the region ofprocurement and production, a report by The International Council on CleanTransportation (ICCT) states that an estimated 56-494kg of CO2 is emitted per 1kWh ofbattery production (approximately 1,700-15,000kg for a 30kWh battery), a very broadrange. CO2 emissions from the production of a NMC111 lithium ion battery, for example,breaks down into 40% from electrode production (mainly rare earth) and a little under20% each from cell production and aluminum smelting. This is because the productionprocess for cathodes/anode involves sintering active materials at over 1000 C.Aluminum has been nicknamed “canned electricity” for the volume of electricityinvolved in its production.Battery production based in AsiaHowever, this estimate is based on electricity usage in North America, and actualconditions may differ as most battery production is based in Japan, South Korea, and5 December 201914
Goldman SachsGlobal AutomobilesChina (the big five automotive lithium ion battery makers are Panasonic, LG Chemical,Samsung SDI, CATL, and BYD). Since the smelting of aluminum (“canned electricity”),in particular, involves the consumption of roughly 13-15kWh of electricity per kg, theenvironmental load of smelting varies widely depending on the power mix of the regionwhere it occurs. Aluminum-related processes account for a large part of electricityvolume usage for battery production. In addition, the bulk of aluminum smelting takesplace in China, which relies heavily on coal thermal energy. Thus, we estimate thataluminum smelting may account for as much as 30% of the environmental load ofbattery production.Exhibit 19: Aluminum and cathodes account for most of electricityconsumption in battery productionExhibit 20: Batteries made in Asia have high CO2 loadCO2 emissions from battery production per kWh by regionBreakdown of electricity consumption in NMC111 battery productionSource: Qiang et al. 2019, “Life Cycle Analysis of Lithium-Ion Batteries for AutomotiveApplications”Source: ICCTMove towards limiting battery capacity has begunAccording to the ICCT summary, most batteries are currently made in Asia and theirproduction results in around 175 kg of CO2 emissions per kWh of capacity. A simplecalculation therefore implies that 30 kWh batteries generate about 5,000 kg of CO2 andthat 60 kWh batteries, which are needed to achieve the 500 km range consumers want,generate more than 10,000 kg of CO2. Considering that the LCA approach puts total ICEvehicle CO2 emissions at around 30,000 kg and total emissions for an EV with a 40kWh battery at roughly 20,000 kg (assuming a 200,000 km lifespan, EU power sourceconfiguration), it is clear that LCA-based emissions worsen significantly as batterycapacity increases. It is very interesting that battery capacity is 36 kWh and range is justover 200 km for the mass-production EVs announced by Mazda (MX-30) and Honda(Honda e). We see this as an optimization for LCA, as well as a temporary solutionbefore lowering battery costs.5 December 201915
Goldman SachsGlobal AutomobilesExhibit 21: Honda/Mazda batteries only 36 kWhComparison of EV modelsSource: Company data, Goldman Sachs Global Investment ResearchEVs would clearly be superior, even on an LCA basis, if battery performance improvedEVs would clearly be superior on an LCA basis provided further improvement is made inEV battery energy density and cycle count. Based on current batteryperformance/European power generation mix, a sedan with a 40 kWh battery has todrive at least 70,000 km to become more environmentally friendly than existing cars. Aluxury sedan with nearly double the battery capacity (75 kWh) would likewise have todrive at least 150,000 km to result in less life cycle CO2 emissions than a conventionalcar.Battery warranty length important alsoIf a battery is replaced before reaching the end of its life cycle, this adds 6,000 kg(assuming 30-40 kWh battery) of CO2 emissions from an LCA perspective and presentsa headwind for EVs. The Nissan Leaf’s battery has an 8-year 160,000 km warranty, butwe think that warranty periods for upcoming EVs (in developed and emergingeconomies) merit utmost caution. According to ICCT recent study, battery recyclingcould potentially reduce CO2 by 4-10% based on LCA standard. We believe this couldbe an interesting topic how to utilize used automotive batteries in the future.Exhibit 22: EVs clear winner under current assessment criteria,but.Exhibit 23: LCA: The larger the battery, the worse the emissionsLCA: Relationship between distance travelled and CO2 emissionsTank to wheel: Relationship between distance travelled and CO2emissionsSedan is totally overlapping with Luxury SedanSource: Auto Catalog, Data compiled by Goldman Sachs Global Investment Research5 December 2019Source: Company data, BP, Auto Catalog, Data compiled by Goldman Sachs Global InvestmentResearch16
Goldman SachsGlobal AutomobilesChina primary energy mix: Low carbon challenge30% of global CO2 emissionChina contributes to nearly 30% of the annual global CO2 emission of nearly 30Gt,according to IEA. Much of the reason is its high fossil fuel content in the current energymix (more than 80%). China has come a long-way in fixing its air pollution issues (mostlySox, Nox, and PMs) since 2013, and is committed to improve its energy mix thusreduction of carbon emission in the longer run. This is reflected in its commitment withthe Paris Agreement, as well as its official document of “Revolutionary strategy forenergy production and consumption”, where NDRC highlighted China’s long-term energyplan.On 3 September 2016, China ratified the Paris Agreement and submitted its NDC to theUNFCCC, with four major targets for 2030E:nCO2 emissions to reach peak by 2030, or earlier if possible;nIncrease the share of non-fossil energy sources in the total primary energy supply toaround 20% by 2030E;nLower the carbon intensity of GDP by 60% to 65% below 2005 levels by 2030;nIncrease the forest stock volume by around 4.5 billion cubic metres, compared to2005 levels.Among measures to implement enhanced actions on climate change, China also listedthe following elements: 1) Increase the share of natural gas in the total primary energysupply to around 10% by 2020; 2) Proposed reductions in the production of HCFC22(35% below 2010 levels by 2020 and 67.5% by 2025); and 3) “Controlling” HFC23production by 2020.On a consistent basis, NDRC also issues 2020-2050E targets that aim to increase theweight of non-fossil fuel in primary energy from the current 14%, to 20% by 2030E, andto more than 50% by 2050E.1. By 2020E, total energy consumption to control within 5bnt in standard coal andnon-fossil energy to account for 15% in total. CO2 emission per unit GDP to declineby 18% versus the 2015 level.2. During 2021E-2030E, total energy consumption to control within 6bnt in standardcoal. Non-fossil energy to account for 20% in total and gas consumption to accountfor 15% in total. CO2 emission per unit GP to decline by 60%-65% versus the 2005level.3. By 2050E, total energy consumption to remain mostly stable and the contributionfrom non-fossil energy is targeted to increase to over 50%.The target implies Chinese coal demand could remain plateaued in the coming decadeto 2030E, when the growth in overall energy demand offsets the replacement ofrenewable energy. In 2030E-2050E, coal demand in China is likely to fall by two-thirds asrenewable energy replacement accelerates while energy demand flattens, according to5 December 201917
Goldman SachsGlobal Automobilesthe NDRC plan. The implied pace of renewable replacement of coal is faster than theglobal average, should this plan get executed.China’s low carbon challengesThe decarbonization process in China, however, is facing challenges due to threereasons in our view 1) the higher weight of coal in overall energy, 2) the costcompetitiveness of coal (and much of this also relies on how the economics improveswith renewables over time, and the progress of carbon capture technologydevelopment), and 3) the fact that the overall energy demand in China would remain ingrowth s
170-180g/km. While an EV has zero CO2 emissions on a tank-to-wheel basis, we estimate that CO2 emissions average at 100-120g/km on an LCA basis. In other words, if CO2 emissions are measured across a vehicle's life cycle rather than on a tank-to-wheel basis, the CO2 emissions of an ICE vehicle increase by just 50-60g,