Transcription
THOUGHT LEADERSHIP WHITE PAPERFour Steps to Faster, Better ApplicationDependency MappingLaying the Foundation for Effective Business Service ModelsBy Adam Kerrison, Principal Product Developer, BMC Software, andSimon Woodward, Principal Product Manager, BMC Software
TABLE OF CONTENTSEXECUTIVE SUMMARY . . . . . . . . . . . . . . . . . . . . . . . . . . . . . . . . . . . . . . . . . . . . . . . . 1APPLICATION MAPS: ESSENTIAL COMPONENTS OF SERVICE MODELS . . . . . . . . . . . . . . . . . . . . 2BRIDGING THE GAP . . . . . . . . . . . . . . . . . . . . . . . . . . . . . . . . . . . . . . . . . . . . . . . . . 3»» Step 1: Automatic Discovery and Dependency Mapping . . . . . . . . . . . . . . . . . . . . . . . . . . . . 3»» Step 2: Analysis and Reporting . . . . . . . . . . . . . . . . . . . . . . . . . . . . . . . . . . . . . . . . . . . 5»» Step 3: Collaboration . . . . . . . . . . . . . . . . . . . . . . . . . . . . . . . . . . . . . . . . . . . . . . . . . 7»» Step 4: Continual Update . . . . . . . . . . . . . . . . . . . . . . . . . . . . . . . . . . . . . . . . . . . . . . .8REAL-WORLD EXAMPLES . . . . . . . . . . . . . . . . . . . . . . . . . . . . . . . . . . . . . . . . . . . . . 8»» Global Business Consulting Firm . . . . . . . . . . . . . . . . . . . . . . . . . . . . . . . . . . . . . . . . . .8»» Large European Mortgage and Savings Provider . . . . . . . . . . . . . . . . . . . . . . . . . . . . . . . . 8CONCLUSION . . . . . . . . . . . . . . . . . . . . . . . . . . . . . . . . . . . . . . . . . . . . . . . . . . . . . 9
EXECUTIVE SUMMARYIT services are embedded in critical business processes across most organizations — from online commerce to back-officeoperations. Interruptions to — or degradations of — these services can result in serious business consequences. That’s whyit’s so important for IT to understand the impact of changes and downtime on key applications and business services.Service models play an important role in enabling IT to ensure the delivery of services at the levels required by the business.These models portray the relationships among business services and the underlying applications, IT infrastructure components,processes, roles, and service level agreements (SLAs) that define and support them. It’s important to create and maintainaccurate and complete models of the business services that drive your organization. Such models can help you to make betterplanning decisions and recover more quickly from application downtime.An essential step in creating service models is developing application maps that show the relationships among the applicationsand the underlying IT infrastructure components that support services. Some of the challenges in developing these maps includedealing with the complexity of multitiered applications and continuous change in the IT infrastructure.Once you have built the application maps, you can make them available in the configuration management database (CMDB) asthe first step in defining business services. You can then add other information, such as users, policies, deployment blueprints,and service level key performance indicators (KPIs), to complete the service definitions.This paper describes how to leverage advanced discovery and dependency mapping technology to help build business applicationdependency maps. It also includes examples of organizations that have used the approach and reviews the significant benefitsthey have achieved.1
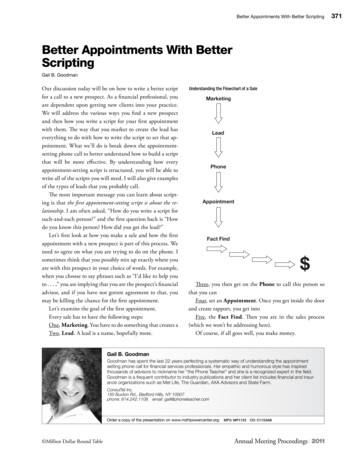
APPLICATION MAPS: ESSENTIAL COMPONENTS OF SERVICE MODELSTo ensure that IT is effectively supporting business demand, you must understand the relationships among business servicesand the underlying IT applications and infrastructure that support them. You also need to understand and define the policies,deployment blueprints, user relationships, service KPIs, and service level targets that are associated with these business services.This understanding gives you the insight to effectively manage the entire service lifecycle and focus on those issues that havehigh business impact.Examples:»» Application A is deployed on a single server; application B is deployed in a clustered server environment.–– If the server holding application A fails, the application is completely unavailable. By comparison, if a server supportingapplication B fails, the performance of the application may be affected, but the application is still available because ofthe server redundancy.–– Application mapping enables IT to understand and visualize the connection between applications and servers andto understand the potential effects when a server fails.»» A router fails.–– Knowing which applications and business services are affected by the failed router enables IT to prioritize its actionsbased on the business impact — e.g., when the router is a component of a mission-critical business service versusa noncritical business service — and to proactively communicate with the service users and owners.As Figure 1 illustrates, application maps are essential components of service models. These maps portray the relationshipsamong the business applications that support the service and the underlying IT infrastructure.Service ModelOfferingsApplication MapApplication MapCostPeopleImpactBlueprintsSLAsFigure 1. Service model2
In most IT organizations, the people tasked with building service models, and hence application maps, usually reside in groupsresponsible for such activities as configuration management or enterprise architecture. In building the models, these groupsneed the help of application experts who are typically in application support or application architecture groups.If yours is like many IT organizations, you may have taken a more traditional approach in creating application maps, one in whichyou conduct fact-finding meetings with the application support people who best know the environment. The problem, however,is that there may be a disconnect between your group and theirs. Your group needs the information that the application expertshave, so you are highly motivated to obtain this information. The application experts, on the other hand, already have the datathey need (often in their heads) to do their jobs, so they may not be highly motivated to expend the time and effort required tohelp you. As a result, getting their attention might be difficult.Surprisingly, automation — when not done right — often exacerbates the situation. For example, automatic discovery technologiesare available that gather vast amounts of data about the IT infrastructure. In the traditional approach, you might simply hand theexpert a spreadsheet list of thousands of servers located by the discovery tool. You would then ask which servers support thetarget application and what software is involved. Providing the requested information would require the application experts tolaboriously sift through reams of data — an arduous task that they may be reluctant to tackle.BRIDGING THE GAPSo how do you bridge the gap between you and the application experts? You need a new approach to communication — one thatnot only analyzes and presents the discovered data in a form that motivates the experts to participate but also minimizes theirtime and effort.BMC has developed a straightforward approach using the sophisticated BMC Atrium Discovery and Dependency Mapping solution.This approach leverages the company’s extensive experience in helping thousands of customers worldwide to implementBusiness Service Management (BSM), a unified platform and comprehensive approach that helps IT organizations cut cost,reduce risk, and drive business profit.The approach consists of four steps:»» Step 1: Automatic discovery and dependency mapping. Automatically create an initial map of the dependencies andrelationships of the target application. (Even the most sophisticated technology cannot always create a completepicture of applications. That usually requires human intervention, which is performed in Steps 2 and 3.)»» Step 2: Analysis and reporting. Generate a report that presents the automatically created application dependencymap in an easy-to-read format.»» Step 3: Collaboration. Present the report to the application expert and request the expert to validate the accuracyand completeness of the application map and to suggest changes where appropriate.»» Step 4: Continual update. Continually update the affected application maps each time a change is made to theIT infrastructure.STEP 1: AUTOMATIC DISCOVERY AND DEPENDENCY MAPPINGIn this step, you use automatic discovery and dependency mapping technology to generate a topology map of the application.The map depicts the physical and logical dependencies of the application components, as well as the dependencies of thecomponents on the underlying IT infrastructure resources. This automatically generated map brings you a great distancetoward a complete and accurate service model.Creating a comprehensive and detailed map places stringent requirements on the discovery and dependency mapping technology.Today’s enterprise IT infrastructures may include thousands of hardware and software components — clients, servers, mainframes,network devices, operating systems, and multitiered enterprise applications with middleware. Virtualization has increased thecomplexity, with thousands of virtual resources running on the physical resources. Cloud computing drives this complexity to an3
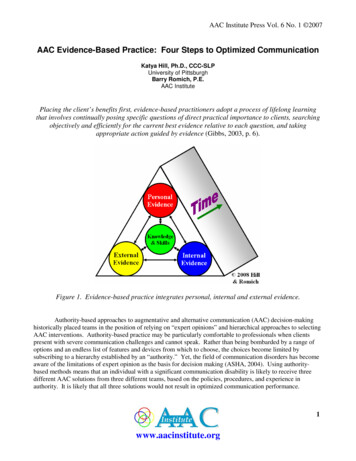
even higher level. The discovery technology, therefore, must have considerable breadth and depth of coverage to ensure that itcan see through this complexity to discover and gather details about all the components in the infrastructure.However, direct discovery of the components and related details is only part of the requirement. The technology must also becapable of analyzing the directly discovered data to create a comprehensive picture of the relationships of applications to eachother and to the underlying IT infrastructure.Mapping technology is available that analyzes the discovery data using reasoning in much the same way that an applicationadministrator would perform this analysis. For example, BMC Atrium Discovery and Dependency Mapping analyzes thecommunication among systems, such as commands issued to and data returned by target systems. Through this analysis, thesolution makes reliable inferences about the IT infrastructure, such as identifying hosts, subnets, software instances (SIs), andbusiness application instances (BAIs).Because of the complexity of today’s multitier enterprise applications, the discovery and dependency mapping technology musthave built-in knowledge of these applications, such as how their various components fit together. For example, the technologymight have knowledge of commercial enterprise applications, such as SAP , Oracle applications, and Microsoft Exchange .This knowledge would include static information about the applications and publishers, as well as hardware and softwareversion information.Figure 2 shows an example of the knowledge that a solution might have of an instance of the Oracle E-Business Suite FieldSales application. The figure shows instances of Oracle Field Sales business applications, depicting the relevant field salessoftware instance, including its four modules, the E-Business Suite software instance, and the three-tier software instances:application server, Web server, and database server.Figure 2. Map of Oracle field sales application (Identifying information has been removed.)4
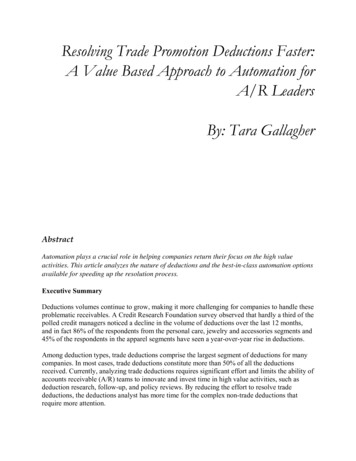
The technology must permit users to update this knowledge base of commercial applications as needed, such as when a newversion is released — automatically, if possible. It must also enable users to easily add knowledge of custom applications.STEP 2: ANALYSIS AND REPORTINGIn this step, you leverage the analysis automatically created by the solution in Step 1 to create a meaningful document for collaboration with application experts. The solution should provide analysis and reporting tools to help you create the document.The analysis created in Step 1 divides the discovered hosts into groups and shows the interdependencies among those groups.(See Figure 3.) Each group consists of two or more highly connected hosts.Figure 3. Hosts and their interdependencies (This view may also show the “No Relevant Communication” and “Excluded Hosts” groupsso they can be accessed, although they will have no connections to the rest of the diagram.)You can use analytics tools provided by the solution to zero in on the desired group, drill down into that group for a more granularview, and/or remove hosts to create the document you will present to the application expert. You can also request a tabularrepresentation of the group to gain additional detail, including information about the product, ID, manufacturer, Internet protocol(IP) address, and other related information.5
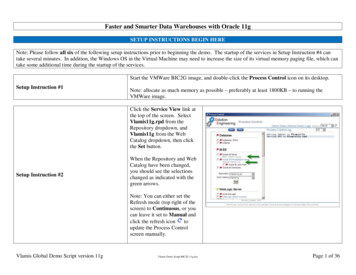
You then take a snapshot of the model and create a report for use in collaborating with the application expert. Figure 4 and Table 1show a sample report of a model based on a particular host, presenting both a graphical and a tabular representation of the model.Figure 4. A host and its connections6
Communication with known hostsLocalKnown Remote183.55.71.45:65540st harness test service.exe These are the command line argumentsfor the samson test.(2 IP addresses):65529.st harness test service.exe These are the command line argumentsfor. sales laptop02, scrayslave09183.55.71.45:65540st harness test service.exe These are the command line argumentsfor the samson test.183.55.71.160:65529.st harness test service exegrb-w4k5stdsql183.55.71.45:65540st harness test service.exe These are the command line argumentsfor the samson test.(9 IP addresses):65529.st harness test service.exesales laptop01, marketing laptop09, grb-win8prince, billing 003,grb-win4kadv, grb-win8kserver, grb-win4kserver, grb-winduke04,grb-win9adv multi prt183.55.71.45:65540st harness test service.exe These are the co
04.06.2019 · » Step 1: Automatic discovery and dependency mapping. Automatically create an initial map of the dependencies and relationships of the target application. (Even the most sophisticated technology cannot always create a complete picture of applications. That usually requires human intervention, which is performed in Steps 2 and 3.)