Transcription
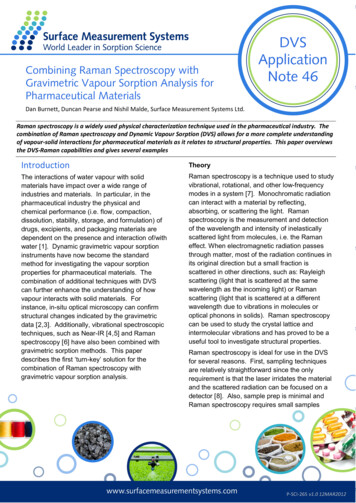
Raman spectroscopy:Basic principles and applicationsChristian Hess Basic principles- Resonance Raman scattering- Surface Enhanced Raman Scattering (SERS) Instrumentation- Spectrometer- Excitation sources Raman in catalysis- In situ cells- In situ Raman (of working catalysts)C.V. Raman (1928)
Basic principles- Resonance Raman scattering- Surface Enhanced Raman Scattering (SERS) Instrumentation- Spectrometer- Excitation sources Raman in catalysis- In situ cells- In situ Raman (of working catalysts)C. Hess, 2006
IntroductionWhy Raman spectroscopy? Information on rotational and vibrational levels Raman effect small but accessible by use of lasers Complementary information to IR spectroscopyp homonuclear diatomic molecules, low frequency range In situ analysis of organic and inorganic compounds Analysis of aqueous solutions and solids (powders) Using resonance and surface enhancement effects 1010p Trace gas/single molecule analysis - molecular structureC. Hess, 2006
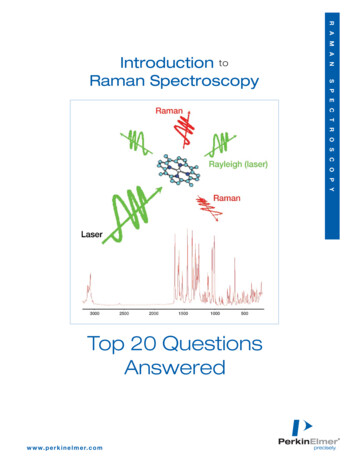
Classical description Spatial charge separation under influence of electric field Ep induced dipole moment μ:μ αE(1)α: polarizabilityp Example: polarizability changes during CO2 vibrationsC. Hess, 2006
Example: Polarizability changes CO2Vibrational modes of CO2C. Hess, 2006
Example: Polarizability changes CO2Vibrational modes of CO2C. Hess, 2006
Classical description Spatial charge separation under influence of electric field Ep induced dipole moment μ:μ αE(1)α: polarizability Electric field E due to electromagn. wave with frequency ν0E E0 cos 2π ν0t(2)p μ α E0 cos 2π ν0t(3)p emission of light at same frequency ν0p I (2/3c3) μ* (16π4α2E02/3c3) ν04 d μ 2 dt μ* 22(4)C. Hess, 2006
Classical description Internal vibrational motion with Eigenfrequency vMq q0 cos 2π νMt(5) Polarizability α p develop in seriesα αq 0 ( α/ q)q 0 q higher order terms(6)pμ αE(7) (αq 0 ( α/ q)q 0 q0 cos 2π νMt) E0 cos 2π ν0t αq 0 E0 cos 2π ν0t ½ ( α/ q)q 0 q0 E0 [cos 2π (ν0 - νM)t cos 2π (ν0 νM)tRayleighStokes/Anti-StokesC. Hess, 2006
Q.M. descriptionp harmonic oscillator: Δv 1inelastic impactelastic impactinelastic impactΔEM 0ΔEM 0ΔEM 0ν ν0ν ν0 – νvib ν0hν0 hν0 h(ν0 - νvib) Stokeshν0 ν‘ ν0 – νvib ν0hν0 hν0 h(ν0 νvib) hν0 ν 1ν 1ν 1ν 1ν 0ν 0ν 0ν 0RayleighAnti-StokesC. Hess, 2006
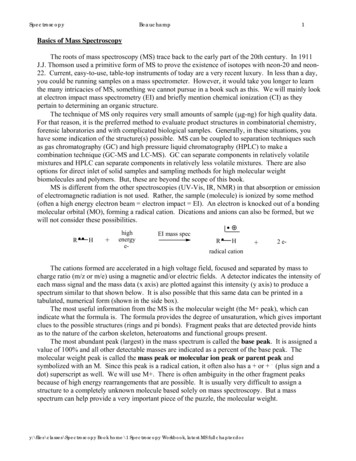
Q.M. descriptionRaman intensity?p Is Ni σR(i f) IL(8)Ni: initial state populationσR(i f): Raman cross section for transition Ei EfIL: Laser intensityp thermal equilibrium: Boltzmann distribution for state Ni at TNi N0 exp(-ihνvib/kT)(9)p lower energy state: higher initial state populationI(Stokes) I(Anti-Stokes)p Example: Stokes/Anti-Stokes intensities of CHCl3C. Hess, 2006
Q.M. description80000514nm excitationneat tokes0400800-1Raman shift (cm )C. Hess, 2006
Basic principles- Resonance Raman scattering- Surface Enhanced Raman Scattering (SERS) Instrumentation- Spectrometer- Excitation sources Raman in catalysis- In situ cells- In situ Raman (of working catalysts)C. Hess, 2006
Introduction to Resonance Raman scatteringelectronicresonancevirtual levelresonancevirtual Hrgiwe {ig-HrthauQzeraplmowturemce zenldiwownt-rinOgrtauQzpischrmehTolpcuStokesg1g0 {{saGevelwresonant Ramannon-resonant Ramanp Polarizability tensor α (single e state):α αβ1 g1 μˆα ev ev μˆ β g 0 h v wev,g0 w0 iΓev μˆα , μˆ β : Electric dipole moment operatori.a. with incident/scattered lightC. Hess, 2006
Example: β-Carotinelectronicresonancevirtual levelresonancevirtual levelAbsorbanceVis514nmVisStokesv 1v 0non-resonant RamanStokes632nm {{{saGleutosaGletin{rtuQpmaSelnzdiwo{ntiaeHgreiw {gi-HrthauQzeraplmowturemce wntn-riOgrtauQpzschirmehTolpcuelwv 1v 0resonant RamanWavelength (nm)C. Hess, 2006
Example: β-Carotinβ-carotin, 9mW, 20s exp514nm excitation632nm excitationIntensity30000C C stretchenhancementfactor 10200001000000400800120016002000-1Raman shift (cm )C. Hess, 2006
Basic principles- Resonant Raman spectroscopy- Surface Enhanced Raman Scattering (SERS) Instrumentation- Spectrometer- Excitation sources Raman in catalysis- In situ cells- In situ Raman (of working catalysts)C. Hess, 2006
Introduction to SERS‘Normal’ Raman scatteringN molecules with σR,freeI(νL)I(νS)INRS(νS) N I(νL) σR,freeC. Hess, 2006
SERS mechanism - enhancement factorsSurface-enhanced Raman scatteringI(νL) A(νL)2ε0N’ with σR,ads, N’ N“Rough” surfacee.g. metal nanostructureMoleculerdεmetalI(νS) A(νS)2ISERS(νS) N’I(νL) A(νL)2A(νS)2 σR,ads(1) E.m. field enhancementmax. 106 (isolated Ag,Au)max. 108 (coupled)EM(ν)A(ν) E0(ν)(2) Chemical enhancementmax. 10-100C. Hess, 2006
SERS substrateSEM images of the silver nanowire ML on Si wafer {{{saGelutosaGenlti{rtuQpmaSelnzdiwo{ntiaeHgreiw {gi-HrthauQzeraplmowturemce wntn-riOgrtauQpzschirmehTolpcuelwD Deposited ML shows domains of aligned silver nanowiresA. Tao, F. Kim, C. Hess, J. Goldberger, R. He, Y. Sun, Y. Xia, P. Yang, Nano Lett. 3 (2003) 1229
SERS substrateUV-VIS absorption spectra of silver nanowire MLtransverselongitudinalRaman {{{saGelutosaGenlti{rtuQpmaSelnzdiwo{ntiaeHgreiw {gi-HrthauQzeraplmowturemce wntn-riOgrtauQpzschirmehTolpcuelwD Broadened extinction 500-600 nm due to wire-wire coupling
CH2twist/scissorCH2wagν(C-C)CH3rockν(C-S)tSERS example: 1-hexadecanthiol/Ag-LB film Enhancement factor EF:EF [ISERS]/[IRaman] [Mb]/[Mads] Qzeraplmowmce zenldiwow turent-rinOgrtauQzpischrmehTolpcuelw thiol head group (2.3 Å)2,closed-packed layerD molecule conc. on surface:2.5 1014/cm2D 532nm, band at 1295 cm-1D EF 2 105C. Hess, 2006
SERRS example: Rhodamine 6G/Ag-LB filmSERRS Surface Enhanced Resonance Raman Scattering Linear relationship betweenintensity and concentrationD surface not saturated Langmuir description usingMads Mads,max Ka0/(1 Ka0) i-HrthauQmce zeraplmoww turentn-riOgrtauQipschzrmehTolpculewyields ΔGads 46 KJ/mol Large EF 109 as result ofSERS and Resonant RamanC. Hess, 2006
Basic principles- Resonant Raman spectroscopy- Surface Enhanced Raman Scattering (SERS) Instrumentation- Spectrometer- Excitation sources Raman in catalysis- In situ cells- In situ Raman (of working catalysts)C. Hess, 2006
Raman spectrometerChallenges to record (good) spectra Separate inelastically scattered from Rayleigh (99.99999%) light Collect the maximum number of inelastically scattered photonsTriple spectrograph first 2 gratings subtractivep removal Rayleigh (40% E) grating 3/4 creates dispersion detection: diode arrayFourier Transform (FT) - Raman Michelson interferometer(Jacquinot, multiplex) NIR (1.064 µm) excitation,p less fluorescencep self absorption
Modern Raman spectrometer holographic notch filtersp 80% T of Raman light,324 - 1339 nm available single transmission gratingp 0 - 4400 cm-1 (multiplex)“clean”, no moving parts,high light throughput cooled CCD ( 40% QE)p 400 - 1000 nm Light ion probe)
Basic principles- Resonant Raman spectroscopy- Surface Enhanced Raman Scattering (SERS) Instrumentation- Spectrometer- Excitation sources Raman in catalysis- In situ cells- In situ Raman (of working catalysts)C. Hess, 2006
Laser excitation wavelengthsFluorescence(typical range) (organic samples/water)choice of laser wavelength: scattering intensity ν4 detectors resonance enhancement self-absorption of sample fluorescence (pNIR, UV)
Basic principles- Resonant Raman spectroscopy- Surface Enhanced Raman Scattering (SERS) Instrumentation- Spectrometer- Excitation sources Raman in catalysis- In situ cells- In situ Raman (of working catalysts)C. Hess, 2006
In situ Raman cellsRaman-scattered light{{{{{{{{{{{{Gas outlet Laser excitation atlow laser power tominimize heatingQuartz windowSample{{{{{{{{{{{{Heating wireQuartz woolHigh-temperaturecement {{{saGelutosaGenlti {rtuQpmaSelnzdiwo{ntiaeHgreiw {gi-HrthauQzeraplmowturemce wntn-riOgrtauQpzschirmehTolpcuelw Raman cell designmimics plug-flowreactor: gases flowthrough catalyst bed 50 – 100 mg sampleO-ringPlug-flow reactorGas inletQuartz chipsThermocouple wellC. Hess, 2006
In situ Raman cellsFluidized bed reactor Particle motionp reduces laserbeam exposure Raman cell mimicsfluidized bed reactor:gases flow throughcatalyst bed 200 mg sample UV laser excitation
In situ Raman cellsRotating Raman cell Sample rotationp reduces laserbeam exposure Gas flow overcatalyst bed Requires pellets 200 mg sample
Basic principles- Resonant Raman spectroscopy- Surface Enhanced Raman Scattering (SERS) Instrumentation- Spectrometer- Excitation sources Raman in catalysis- In situ cells- In situ Raman (of working catalysts)C. Hess, 2006
The NOX storage-reduction concept Lower fuel consumption by use of engines operating with excess oxygen Problem: Reduction of NOx Solution: Storage of NOx followed by short rich periods for reduction Typical storage catalysts consist of storage material (BaO) and metal (Pt)NONOO2NO2PtNOBaNO 3BaOBaOO2NO2PtSupport BaO/Al2O3 deactivates at higher temperatures (due to Ba-Al alloying)* Focus on BaO/MgO which is stable up to at least 900 C* Jang et al., Catal. Lett. 77 (2001) 1C. Hess, 2006
Experimental setup: In situ Raman spectroscopyRaman-scattered light{{{{{{{{{{{{Gas outlet{{{{{{{{{{{{Heating wireQuartz woolHigh-temperaturecement {{{saGelutosaGenlti {rtuQpmaSelnzdiwo{ntiaeHgreiw {gi-HrthauQzeraplmowturemce Gas inletQuartz windowSample wntn-riOgrtauQpzschirmehTolpcuelw Laser excitation at 532 nm,low laser power of 6 mWminimizes heating of sample Raman cell design mimicstypical plug-flow reactor:Gases flow through catalystbed (50 mg) at 40 ml/minO-ringQuartz chipsThermocouple wellC. Hess, 2006
Preparation of the 14 mol % BaO/MgO catalyst Impregnation of Ba(NO3)2 on MgO (Fisher) Drying at 100 C, heating at 120 C for 2h Heating to 900 C in He for 2h to decompose Ba(NO3)2 and BaCO3 BaO formation confirmed by XRD TEM shows formation ofhomogeneous BaO phase X-ray analysis confirmsthe presence of BaO/MgO200 nmJeol 2010, 200 kV, x40kC. Hess, 2006
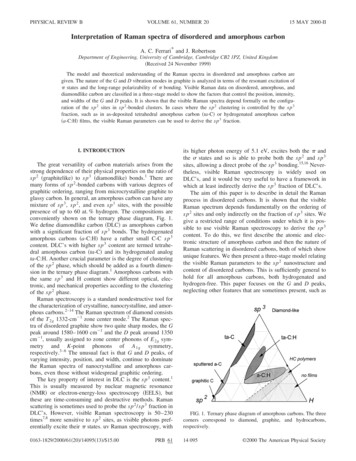
In situ Raman spectra during NO2 exposure10481327Minutes:20.02 Ba -NO 212001400-1Raman shift (cm )9.07.51020 1050 1080-1Raman shift (cm )Ba(NO 3 ) 2134731Ba(NO 2 )822 1% NO2400 C13375030259es10132752 Ba -NO2Minut133710.0Minutes:6.07.58.08.59.00 Formation of nitro species precedes that of nitratesC. Hess, 2006
In situ Raman spectra during NO2 exposureTemperature dependence1% NO 2475 C1049151Ba(NO 3 ) 21351048724 814Ba(NO 2 )733825 13373025320101335603010132755Minutes259Minutes1% NO2300 C13272 2 Ba -NO20Ba -NO20 300 C: Formation of nitro species precedes nitrates (as at 400 C) 475 C: Higher rate of NO3- formation but smaller storage capacity
In situ Raman spectra after catalyst pre-oxidationC. Hess, 20061% NO2400 C1% NO2400 C25% O2 pre-flow: 1 min25% O2 pre-flow: 4 min133610Ba -NO251052Minutes2 1048Ba(NO 3 ) 2134730201510105252 Ba -NO2005001000-1Raman shift (cm )15000500100001500-1Raman shift (cm ) Pre-oxidation of BaO enables direct nitrate formation at 400 CMinutes1052140Raman intensity (a.u.)Raman intensity (a.u.)Dependence on pre-oxidation time
In situ Raman spectra during NO2 /O2 exposureTemperature dependence1% NO2 / 20% O2400 C1% NO2 / 20% O2300 C1048Ba(NO 3 ) 2Ba(NO 3 ) 273027323020010Minut5 1337es824Ba(NO 2 )50 Presence of oxygen surpresses formation of nitro speciesincreases the rate of nitrate formationutes10136M in1341049
Summary - Mechanism for NO2 storageBaO NO2 /HeNO 2Ba 2 O[Ba(NO 2 )] [Ba(NO 3 )] He O2 /HeBaO 2 NO2 /He NO2 /He NO2 /HeNOBa(NO 3 ) 2C. Hess and J.H. Lunsford, JPCB 106 (2002) 6358C. Hess and J.H. Lunsford, JPCB 107 (2003) 1982
,Summary - NO2 storage capacity400 C500 C400 C/O2300 C/O2C. Hess, 2006
Summary: Study reveals Raman key features Raman spectra without interference of gas phase simple glass/quartz cell in situ spectra can be recorded at high temperatures (500 C) time-dependent in situ experiments Raman spectra down to 100 cm-1 detection of IR inactive peroxide vibrations detection of adsorbed species and catalyst bulk phase quantification using internal reference self scattering of MgO support lowp Raman spectra of supported phasep other supports?C. Hess, 2006
IR vs Raman of typical oxide supportsIRRamanI.E. Wachs, Catal. Today 27 (1996) 437
n-pentane isomerization over 17 wt% WO3/ZrO21% n-pentane in He, 10 ml/minC C (coke)W O250ºCS(2-methylbutane) 30%S. Kuba and H. Knözinger J. Raman Spectrosc. 33 (2002) 325
Relation of Raman intensity to sample reflectanceRaman intensity based onKubelka-Munk formalism:ψ ρI o R (1 R )s(1 R ) ρI 0sG ( R )ρ: Raman coefficient ( ν4)s: scattering coefficientcv 4 I o R (v)[1 R (v)]ψ (v ) [1 R (v)]scI 0( [{ }] ) G[R (v)]ν 4sR (v) : can be measured bydiffuse reflectance UV-Vis
Raman intensity correctionoriginal datacorrected dataplasma line
Structure of vanadia in VxOy/Al2O3UV laserdehydrated vanadia:isolated vs polymericOOOVVVOHO OOO OOOaluminaPreferential excitationof structurally differentVxOy species possible?Visible laserLMCT:OpV4.4 V/nm21.2 V/nm20.03 V/nm2Z. Wu, H.-S. Kim, P.C. Stair,S. Rugmini, S.D. Jackson, JPCB (2005)
UV Raman – selective resonance enhancementV O in: V2O5 VxOyV O in:VisV2O5 VxOyUV10181030OOOVVVOO OOOaluminaOHO O
MeOH partial oxidation on polycryst. Ag (SERS)O2 flow after pretreatmentMeOH/O2 3Ag O Ag-O-AgdecreasingAg-O-Ag intin MeOH/O2p active site?p assignment?p subsurface?p thermal cyclesp 2 diff. atomic O species(isotope shifts 20 cm-1)C.-B. Wang, G. Deo, I.E. Wachs, JPCB 103 (1999) 5645
Summary: Raman for catalytic applications Raman spectra accessible without interference of gas phase simple glass/quartz cell in situ spectra can be recorded at high temperatures (500 C) time-dependent in situ experiments Raman spectra of adsorbates and catalyst down to 100 cm-1 quantification using internal referencep correction for changes in sample reflectance (p DR UV-Vis) self scattering of common support materials lowp Raman spectra of supported phase Signal enhancement as result of resonance Raman and SERSC. Hess, 2006
Questions?
Light source (Laser) Dispersion grating Detector (CCD) sample sampling optics (objective, immersion probe) Notch filter holographic notch filters p80% T of Raman light, 324 - 1339 nm available single transmission grating p0 - 4400 cm-1 (multiplex) "clean", no moving parts, high light throughput cooled CCD ( 40% QE) p400 - 1000 .