Transcription
Atomic spectroscopy with violet laser diodesGustafsson, U; Alnis, J; Svanberg, SunePublished in:American Journal of PhysicsDOI:10.1119/1.195052000Link to publicationCitation for published version (APA):Gustafsson, U., Alnis, J., & Svanberg, S. (2000). Atomic spectroscopy with violet laser diodes. American Journalof Physics, 68(7), 660-664. https://doi.org/10.1119/1.19505Total number of authors:3General rightsUnless other specific re-use rights are stated the following general rights apply:Copyright and moral rights for the publications made accessible in the public portal are retained by the authorsand/or other copyright owners and it is a condition of accessing publications that users recognise and abide by thelegal requirements associated with these rights. Users may download and print one copy of any publication from the public portal for the purpose of private studyor research. You may not further distribute the material or use it for any profit-making activity or commercial gain You may freely distribute the URL identifying the publication in the public portalRead more about Creative commons licenses: https://creativecommons.org/licenses/Take down policyIf you believe that this document breaches copyright please contact us providing details, and we will removeaccess to the work immediately and investigate your claim.LUNDUNIVERSITYPO Box11722100Lund 46462220000
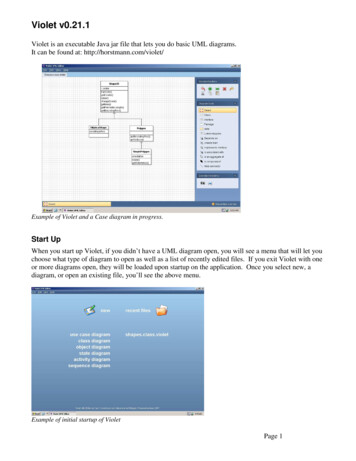
Atomic spectroscopy with violet laser diodesU. Gustafsson, J. Alnis, and S. SvanbergDepartment of Physics, Lund Institute of Technology, P.O. Box 118, S-221 00 Lund, Sweden共Received 28 June 1999; accepted 27 October 1999兲Laser spectroscopy with laser diodes can now also be performed in the violet/blue spectral region.A 5 mW commercially available CW laser diode operating at 404 nm was used to performspectroscopy on potassium atoms with signal detection in absorption as well as fluorescence whenoperating on a potassium vapor cell and with optogalvanic detection on a potassium hollow cathodelamp. The 4s 2 S 1/2 – 5p 2 P 3/2,1/2 transitions were observed at 404.5 and 404.8 nm, respectively. Thelaser diode was operated with a standard laser diode driver, and with or without an external cavity.The 4s 2 S 1/2 – 4p 2 P 1/2 transition at 770.1 nm was also observed with a different laser diode. Here,Doppler-free saturated-absorption signals were also observed, enabling the evaluation of theground-state hyperfine splitting of about 460 MHz. The data recorded allows an experimentalverification of the theory for Doppler broadening at two widely separated wavelengths. 2000American Association of Physics Teachers.I. INTRODUCTIONThe development of narrow-band tunable lasers, in particular dye lasers, has allowed the emergence of powerfulspectroscopic techniques for atomic and molecularspectroscopy.1,2 The Doppler width of the transitions is normally of the order of 1 GHz and is much larger than the laserlinewidth, allowing an easy study of the Doppler-broadenedtransitions. Using Doppler-free techniques, a resolution limited only by the natural radiative linewidth 共typically a fewMHz兲 can be obtained for narrow-band lasers. Much data onatomic structure including hyperfine splittings and isotopicshifts have been obtained through the years.The development of single-mode near-IR 共infrared兲 laserdiodes made the techniques of laser spectroscopy accessiblefor student laboratories also. The most readily available experiment was to induce the 5s 2 S 1/2 – 5p 2 P 3/2,1/2 transitionsin rubidium atoms using easily available AlGaAs semiconductor lasers at 780.2 and 794.7 nm, respectively. Such experiments using free-running diode lasers on an atomic beamwere described by Camparo and Klimac.3 At our university,a laboratory session on rubidium laser diode spectroscopyhas been offered for all physics students since 1990.Doppler-broadened transitions in an atomic vapor cell areobserved, and by back-reflecting the laser diode beam,Doppler-free saturation signals are also recorded. We recently helped implement such experiments on isotopicallyenriched cells of 85Rb and 87Rb at four African universities,in Dakar 共Senegal兲, Khartoum 共Sudan兲, Nairobi 共Kenya兲, andCape Coast 共Ghana兲 共see, e.g., Ref. 4兲. Laser diode spectroscopy for teaching purposes has also been demonstrated forCs 共852.3 nm兲5,6 and Li 共671.0 nm兲.7,8 Here, an improvedlaser performance 共extended tuning range and narrow linewidth兲 was achieved by employing an external cavity including a Littrow grating.The purpose of the present paper is to bring to the attention of the reader the fact that diode laser spectroscopy cannow be extended to the violet/blue spectral region, due to therecent remarkable progress in GaN semiconductor lasers atNichia Corporation by Nakamura and collaborators.9,10 Bluediode laser spectroscopy is illustrated with experiments onthe second resonance lines 4s 2 S 1/2 – 5p 2 P 3/2,1/2 of potassiumat 404.5 and 404.8 nm. For reference and comparison, the660Am. J. Phys. 68 共7兲, July 2000near-IR potassium line 4s 2 S 1/2 – 4p 2 P 1/2 at 770.1 nm wasinduced with a different semiconductor laser. With thenear-IR laser diode used it was not possible to observe the4s 2 S 1/2 – 4p 2 P 3/2 line at 766.7 nm.Natural potassium consists of two isotopes, 39K 共93%兲 and41K 共7%兲, both with a nuclear spin of 23. Because of thedominance of 39K we only need to consider this isotope. Thestructures of the near-IR and blue lines are given in Fig. 1,where the hyperfine structure splittings are obtained fromRef. 11. We note that, because of the small magnetic moment of the 39K nucleus, the hyperfine structure splittings aresmall. The ground-state splitting is 462 MHz; for 41K it iseven smaller, 254 MHz. Thus, the Doppler-broadened line isnot expected to show any structure, while a saturated absorption spectrum should be dominated by two peaks separatedby about 460 MHz and broadened by upper-state unresolvedhyperfine structure. Because of the fact that the excited statehyperfine structure is small and in the present context nonresolvable, while the ground-state splitting produces sharpseparated peaks, it could be argued that potassium is pedagogically better suited than Li, Rb, and Cs for a studentlaboratory session at a particular level of atomic physicsknowledge.It is not our intention to record and evaluate highresolution atomic spectra in the present work. Instead wewould like to emphasize the use of free-running laser diodesand laser diode use in a simple feedback cavity, to demonstrate, evaluate, and experimentally verify the theory forDoppler broadening while also drawing attention to the phenomenon of hyperfine structure.II. EXPERIMENTAL SETUPThe experimental arrangements employed in the presentexperiments are shown in Fig. 2. Direct absorption monitoring, laser-induced fluorescence, and optogalvanic detectionare indicated. The violet semiconductor laser enabling theexperiments on the 4s – 5p transition was acquired from Nichia Corporation 共Type NLHV500兲 and has a nominal wavelength at 25 C of 404 nm and an output power of 5 mW.The near-IR 4s – 4p transition was induced by a more conventional AlGaAs semiconductor laser 共Mitsubishi ML4102兲with a nominal wavelength of 772 nm and output power of 5 2000 American Association of Physics Teachers660
Fig. 1. Hyperfine structure diagramsof the 4s 2 S 1/2 – 5p 2 P 3/2,1/2 and the4s 2 S 1/2 – 4p 2 P 3/2,1/2 transitions in39K. The energy splittings are notgiven to scale.mW. The laser diodes were placed in a thermo-electricallycooled mount 共Thorlabs TCLDM9兲 and operated with a lownoise laser diode driver 共Melles Griot 06DLD103兲. Typically, the operating currents of the two laser diodes were setto 40 and 59 mA, respectively. Wavelength tuning of thelaser diodes was accomplished by changing the temperatureof the laser capsule. Once the temperature was set, a currentramp with a frequency of 100 mHz or 100 Hz was added tothe operating current by means of a function generator 共Tektronix FG504兲, allowing us to record the whole line profile ina single scan. The lower frequency was used for the optogalvanic detection while the higher frequency was used for theabsorption and fluorescence measurements. In some of theexperiments with the violet diode laser, a simple externalfeedback cavity with a Littrow grating was used to ensuresingle-mode operation, since the free-running laser typicallylased on a few modes, separated by about 0.05 nm. Externalcavity laser arrangements are commercially available fromseveral suppliers, e.g., New Focus, Newport, Thorlabs, andTui Optics, and we used the Thorlabs system based on thelaser diode mount, a piezo-electric mirror mount (KC1-PZ),a piezo-electric driver 共MDT-690兲, and a 2400 l/mm grating共Edmund Scientific 43224兲. A molded glass aspheric lens共Geltech C230TM-A兲 was used to collimate the output beamfrom the diode laser. Details for constructing a laser diodesystem, including external cavity and electronic control,from parts in the laboratory, are given in e.g. Ref. 5. The 4cm long potassium cell, which was prepared on a vacuumstation by distilling a small amount of the metal into the cellafter thorough bake-out at elevated temperatures, was placedin a small electrically heated oven. The oven had small windows for transmitting the laser beam and a larger window forobserving laser-induced fluorescence.The transmitted laser beam was focused on a detector共Hamamatsu S1223 pin photo-diode in a home-made transimpedance amplifier module兲 by an f 50 mm lens 共Thorlabs661Am. J. Phys., Vol. 68, No. 7, July 2000BSX060-A兲. The detector output voltage was fed via a lownoise amplifier 共Stanford Research Systems SR560兲 to a signal averaging oscilloscope 共Tektronix TDS520B兲. Finally,the recorded waveform could be transferred to a PC for processing and evaluation. A small part of the laser beam wassplit off by a beam splitter 共neutral density filter兲 and sent toa low-finesse solid glass etalon with a free spectral range of991 MHz in the near-IR region and 979 MHz in the violet.The generated fringes, which were detected by another detector, allow us to frequency calibrate each individual scan.As an alternative detection method, the fluorescence induced by the violet transition could be monitored. The4 p – 4s near-IR transitions, isolated by a Schott interferencefilter ( peak 768 nm), were used. By employing transitionsfrom the 4p state, populated in cascade decays via the 5sand 3d states, instead of the direct decays on the violet5 p – 4s transition, problems with background due to scattered light from cell windows and oven structures could becompletely avoided. A photomultiplier tube 共EMI 9558兲 wasemployed and the signal was fed via a current-to-voltageamplifier 共Ithaco 1212兲 to the oscilloscope. We also tested asimple large-area photo-diode 共Hamamatsu S-1226-8BK兲 forrecording the fluorescence with quite satisfactory results.The use of a hollow-cathode discharge lamp and optogalvanic detection is a further alternative for observing the bluepotassium transitions. We used an Instrumentation Laboratory hollow-cathode lamp 共Model 89227兲, intended for anatomic absorption spectrophotometer. A discharge current of5 mA, also passing through a ballast resistor, was driven byan Oltronik photomultiplier supply 共Model A2.5K-10HR兲,set for typically 300 V when the discharge was running. Arotating chopper 共Stanford Research System SR540兲 wasused for modulating the laser beam at 340 Hz, and the acvoltage across the ballast resistor occurring when atoms areexcited was detected with a lock-in amplifier 共EG&G 5209兲.Gustafsson, Alnis, and Svanberg661
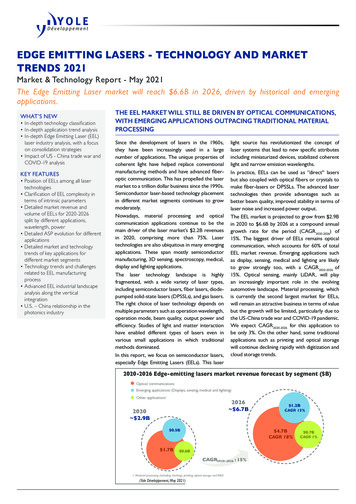
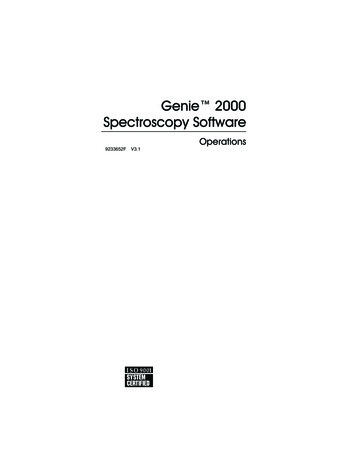
Fig. 3. Raw data obtained in an absorption recording of the4s 2 S 1/2 – 4p 2 P 1/2 potassium transition. Note the increasing laser outputover the scan, but the quasi-linear frequency sweep as evidenced by equidistant Fabry–Perot fringes. The signals associated with the retrace at theend of the saw-tooth sweep are also evident.Fig. 2. Experimental setup for absorption, fluorescence 共a兲 and optogalvanicspectroscopy 共b兲 on potassium atoms.III. MEASUREMENTSThe experimental setup was first tested by inducing the4s 2 S 1/2 – 4p 2 P 1/2 transition in the near-IR spectral region.This transition has, like the corresponding resonance lines inRb and Cs,3–8 high oscillator strengths, meaning a strongabsorption already at atomic densities of 1015/m3, corresponding to about 50 C for potassium. Thus, the transitionsare easily observable in absorption measurements. Thenear-IR transition was induced with the Mitsubishi laser operated without an external cavity. Raw data for a potassiumabsorption measurement are shown in Fig. 3, where the lowfinesse Fabry–Perot fringes are also displayed. It can benoted that the laser output power increases during the scan,662Am. J. Phys., Vol. 68, No. 7, July 2000but that the frequency sweep is quite linear. Thus, no frequency scale rectification was employed in our experiments,but the recorded curves were normalized the case of a constant laser output by dividing the recorded curve by a curvewithout atomic absorption. This procedure, like all subsequent data processing, was readily performed within the Microsoft EXCEL data package. The data shown in the rest ofthis paper are all preprocessed in this way. Typical normalized recordings for different vapor cell temperatures areshown in Fig. 4共a兲. By reflecting the laser beam back ontoitself, saturated absorption signals with increased transmission are seen separated by about 460 MHz as displayed inFig. 4共b兲. The excited state hyperfine structure is not resolved. In between the two signals a strong cross-oversignal1 is observed. In these measurements, performed with abeam size of about 1 mm 3 mm, care was exercised toavoid a direct feedback of the reflected beam into the diodelaser which causes unstable oscillation. In the figure, an experimental curve recorded without beam reflection is superimposed, making an isolation of the nonlinear spectroscopicfeatures easy.Since the fluorescence is strong on the near-IR lines, thebackground due to scattering in cell windows, etc., is notsevere, allowing the laser-induced fluorescence to be readilyobserved as shown in Fig. 5. Fitted curves, to be discussedlater, are included in the figure. The lower trace shows theDoppler-free features due to the back-reflection of the beaminto itself from the glass cell with normal-incidencewindows.12 The cross-over signal and one of the Dopplerfree signals is clearly discernible. In the upper trace, we havemisaligned the gas cell to only record the Doppler-broadenedprofile.The 4s – 5p violet transitions in potassium have muchsmaller oscillator strength than the near-IR transitions. Thus,considerably higher temperatures are needed on the cell toobserve line absorption. In contrast, fluorescence detection,which in this case is background free, is already possible attemperatures as low as 30 C. A transmission trace showingthe violet line absorption on the 4s 2 S 1/2 – 5p 2 P 3/2 transitionis displayed in Fig. 6共a兲. This recording is performed withGustafsson, Alnis, and Svanberg662
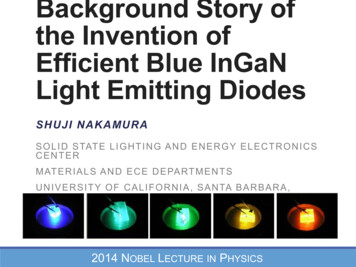
Fig. 4. Absorption recording on the 4s 2 S 1/2 – 4p 2 P 1/2 potassium transitionrecorded for 共a兲 different cell temperatures and 共b兲 saturated absorptionsignal when the laser beam is reflected back on itself for a cell temperatureof 70 C.the violet laser operating in the external cavity. The4s 2 S 1/2 – 5p 2 P 1/2 transition was observed in a separate scan.For the weak violet transitions it is more difficult to reachstrong saturation conditions and the Doppler-free signalswere not observed in our experiments. A fluorescence recording of the same transition is shown in Fig. 6共b兲, togetherwith fitted curves to be discussed later.Optogalvanic detection1,2 in a discharge relies on the factthat excited atoms are more easily ionized by electronic impact than ground-state atoms. Thus, when chopping the excitation beam, a corresponding ac component occurs in thedischarge current at resonance. An optogalvanic lock-in re-Fig. 5. Fluorescence recordings of the 4s 2 S 1/2 – 4p 2 P 1/2 transition using asingle laser beam, crossing a potassium vapor cell. The lower trace 共magnified 4 兲 shows Doppler-free features by a back-reflection from the cellwindows. The cell temperature was 40 C for the lower trace and 60 C forthe upper trace.663Am. J. Phys., Vol. 68, No. 7, July 2000Fig. 6. Absorption 共a兲 and fluorescence 共b兲 recordings of the4s 2 S 1/2 – 5p 2 P 3/2 transition in potassium. The cell temperature was about130 C for the absorption recording and 70 C for the fluorescence recording.cording of the 4s 2 S 1/2 – 5p 2 P 3/2 transition is shown in Fig.7. Here the violet laser was operated in free-run withoutusing an external cavity. As mentioned above, the laser wasthen not running in a single longitudinal mode, as evidencedin separate tests using a high-resolution spectrometer. Laseroutput spectra without and with an external cavity are givenin the insert of the figure. Note that for free atoms withisolated spectral features as in our case, the general spectralappearance is not influenced since only one of the oscillatingmodes interacts with the atoms. However, some broadeningof the individual mode linewidth in multi-mode operationmake spectral recordings less suited for line-shape studiessuch as those in the present experiments. For molecules withFig. 7. Optogalvanic spectrum of the 4p 2 S 1/2 – 5p 2 P 3/2 transition in potassium. The insert shows the laser diode output spectra when the laser diode isoperating without and with an external cavity.Gustafsson, Alnis, and Svanberg663
a multitude of close-lying lines, multi-mode behavior is, ofcourse, unacceptable.IV. DISCUSSIONDiode laser spectroscopy for the violet and near-IR s – ptransitions in potassium was demonstrated using simpleequipment. Potassium has not previously been used in student laboratory work. With the very recent availability ofviolet semiconductor lasers, it became possible to directlyexcite, for the first time to our knowledge, a more highlyexcited state of an alkali atom with a laser diode. The outcome could then be compared with the results from experiments involving the first excited state, performed with thesame simple setup.The pedagogical value of a laboratory session along thelines discussed in this paper in part consists of running andscanning the diode lasers, and of adjusting the optical components and electronic devices for allowing the spectroscopicrecordings, which could be demonstrated with three differentdetection methods. The other part is the atomic physics content. For this part, a useful approach is to record the near-IR4s 2 S 1/2 – 4p 2 P transition in fluorescence and absorption forsingle and double laser beam passage through the cell. Sincethe upper-state hyperfine structure for the present purposecould be considered to be absent, the two Doppler-free peaksdirectly allow the ground-state splitting to be evaluated. Thefluorescence line-shape S( ) recorded for single-beam passage can then be fitted to a sum of two Gaussians with ahalf-width 共FWHM兲 of , separated by 460 MHz and having an intensity ratio of A:B,S 共 兲 A exp„ 4 ln共 2 兲共 / 兲 2 B exp共 4 ln共 2 兲 „共 460兲 / 2 兲 .共1兲The value for obtained is then compared with the theoretical value D : D 冑共 8 ln 2 兲 RT 0 ,c2M共2兲where 0 is the transition frequency at line center, R is thegas constant 关8.3143 J/mol K兴, c is the speed of light, T is thecell temperature 共in K兲, and M is the atomic mass number共39兲. The Doppler width for the near-IR transition is about0.8 GHz for the temperatures discussed here 共20 C–120 C兲.With the violet laser a substantially broader fluorescencelineshape is then recorded and fitted to Eq. 共1兲, and the Doppler width is extracted. Now the transition frequency is afactor of 1.90 higher and the violet theoretical Doppler widthis correspondingly larger, typically 1.5 GHz using Eq. 共2兲.For both lines, good fits and experimental widths close tothe calculated ones are obtained, e.g., the fits included in thefluorescence recordings in Figs. 5 and 6 yield 0.82 GHz共40 C兲 and 1.55 GHz 共70 C兲, respectively, for the Dopplerwidths, to be compared with the theoretical values of 0.79and 1.57 GHz, respectively. The good curve fits obtainedusing Gaussians and the experimental Doppler width valuesobtained in two widely separated wavelength ranges stronglysupport the theory for Doppler broadening. A discussion ofthe velocity Maxwellian distribution and Doppler broadeningcan be found, e.g., on p. 67 of Ref. 1 and p. 86 of Ref. 2.The ratio of the statistical weights of the two hyperfineground state levels 共F 2 and F 1) is 5:3, which is also the664Am. J. Phys., Vol. 68, No. 7, July 2000expected line intensity ratio (A/B) for transitions to an unresolved excited state. The experimentally deduced intensityratios, 1.80 and 1.71, respectively, for the curves in Figs. 5and 6 are close to the theoretical ratio, 1.67.A further suitable violet transition for a student laboratorysession is the aluminum 397 nm line. The 3p 2 P 1/2 – 4s 2 S 1/2transition at 396.2 nm for the single aluminum isotope 27Alwith a 1.26 GHz S-state hyperfine splitting allows very pedagogical optogalvanic recordings from an aluminum hollowcathode lamp. A calcium hollow-cathode lamp run at asomewhat higher discharge current than normal producesCa ions with its potassium-like resonance transitions at393.5 and 397.0 nm, respectively, which could be monitoredby optogalvanic spectroscopy. An interesting pedagogicalobservation is, then, that the first excited state in potassiumlike Ca is located at about the same energy as the secondexcited state in potassium, due to the excess charge of thecalcium nucleus.V. CONCLUSIONWe have performed laser diode spectroscopy in thenear-IR and violet spectral region on potassium. The experiments demonstrate the possibility to perform simple and inexpensive laser spectroscopy on Doppler-broadened profilesof the same atom in different spectral regions, allowing theexperimental verification of the theory for Doppler broadening at two widely separated wavelengths.ACKNOWLEDGMENTSThis work was supported by the Swedish Research Council for Engineering Sciences 共TFR兲 and the Knut and AliceWallenberg Foundation.W. Demtröder, Laser Spectroscopy 共Springer Verlag, Heidelberg, 1996兲,2nd ed.2S. Svanberg, Atomic and Molecular Spectroscopy—Basic Aspects andPractical Applications 共Springer Verlag, Heidelberg, 1997兲, 2nd ed.3J. C. Camparo and C. M. Klimac, ‘‘Laser spectroscopy on a shoestring,’’Am. J. Phys. 51 共12兲, 1077–1081 共1983兲.4S. Diop, ‘‘Utilisation des lasers a semi-conducteurs 共AlGaAs兲 en spectroscopie d’absorption de saturation et de modulation de frequence dans lerubidium ( 85Rb et 87Rb),’’ Thesis for Maitre es Science, UniversiteCheikh Anta Diop de Dakar, 1997.5K. B. MacAdam, A. Steinbach, and C. Wieman, ‘‘A narrow-band tunablediode laser system with grating feedback, and a saturated absorption spectrometer for Cs and Rb,’’ Am. J. Phys. 60 共12兲, 1098–1111 共1992兲.6C. Wieman and L. Hollberg, ‘‘Using diode lasers for atomic physics,’’Rev. Sci. Instrum. 62 共1兲, 1–20 共1991兲.7K. G. Libbrecht, R. A. Boyd, P. A. Willems, T. L. Gustavson, and D. K.Kim, ‘‘Teaching physics with 670 nm diode lasers—construction of stabilized lasers and lithium cells,’’ Am. J. Phys. 63 共8兲, 729–737 共1995兲.8L. Ricci, M. Weidemüller, T. Esslinger, A. Hemmerich, C. Zimmermann,V. Vuletic, W. König, and T. W. Hänsch, ‘‘A compact grating-stabilizeddiode laser system for atomic physics,’’ Opt. Commun. 117 共5–6兲, 541–549 共1995兲.9S. Nakamura and G. Fasol, The Blue Laser Diodes 共Springer Verlag,Heidelberg, 1997兲.10S. Nakamura and W. Kaenders, ‘‘Market-ready blue diodes excite spectroscopists,’’ Laser Focus World May 1999, 69–75.11E. Arimondo, M. Inguscio, and P. Violino, ‘‘Experimental determinationsof the hyperfine structure in the alkali atoms,’’ Rev. Mod. Phys. 49 共1兲,31–75 共1977兲.12T. P. Duffey, D. Kammen, A. L. Schawlow, S. Svanberg, H. R. Xia, G. G.Xiao, and G. Y. Yan, ‘‘Laser spectroscopy using beam overlap modulation,’’ Opt. Lett. 10 共12兲, 597–599 共1986兲.1Gustafsson, Alnis, and Svanberg664
tion of the reader the fact that diode laser spectroscopy can now be extended to the violet/blue spectral region, due to the recent remarkable progress in GaN semiconductor lasers at Nichia Corporation by Nakamura and collaborators.9,10 Blue diode laser spectroscopy is illustrated with