Transcription
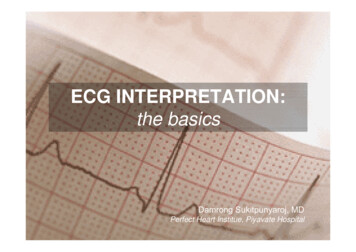
PHYSICAL REVIEW BVOLUME 61, NUMBER 2015 MAY 2000-IIInterpretation of Raman spectra of disordered and amorphous carbonA. C. Ferrari* and J. RobertsonDepartment of Engineering, University of Cambridge, Cambridge CB2 1PZ, United Kingdom共Received 24 November 1999兲The model and theoretical understanding of the Raman spectra in disordered and amorphous carbon aregiven. The nature of the G and D vibration modes in graphite is analyzed in terms of the resonant excitation of states and the long-range polarizability of bonding. Visible Raman data on disordered, amorphous, anddiamondlike carbon are classified in a three-stage model to show the factors that control the position, intensity,and widths of the G and D peaks. It is shown that the visible Raman spectra depend formally on the configuration of the sp 2 sites in sp 2 -bonded clusters. In cases where the sp 2 clustering is controlled by the sp 3fraction, such as in as-deposited tetrahedral amorphous carbon 共ta-C兲 or hydrogenated amorphous carbon共a-C:H兲 films, the visible Raman parameters can be used to derive the sp 3 fraction.I. INTRODUCTIONThe great versatility of carbon materials arises from thestrong dependence of their physical properties on the ratio ofsp 2 共graphitelike兲 to s p 3 共diamondlike兲 bonds.1 There aremany forms of s p 2 -bonded carbons with various degrees ofgraphitic ordering, ranging from microcrystalline graphite toglassy carbon. In general, an amorphous carbon can have anymixture of s p 3 , s p 2 , and even s p 1 sites, with the possiblepresence of up to 60 at. % hydrogen. The compositions areconveniently shown on the ternary phase diagram, Fig. 1.We define diamondlike carbon 共DLC兲 as amorphous carbonwith a significant fraction of s p 3 bonds. The hydrogenatedamorphous carbons 共a-C:H兲 have a rather small C-C sp 3content. DLC’s with higher s p 3 content are termed tetrahedral amorphous carbon 共ta-C兲 and its hydrogenated analogta-C:H. Another crucial parameter is the degree of clusteringof the s p 2 phase, which should be added as a fourth dimension in the ternary phase diagram.1 Amorphous carbons withthe same s p 3 and H content show different optical, electronic, and mechanical properties according to the clusteringof the sp 2 phase.Raman spectroscopy is a standard nondestructive tool forthe characterization of crystalline, nanocrystalline, and amorphous carbons.2–14 The Raman spectrum of diamond consistsof the T 2g 1332-cm 1 zone center mode.2 The Raman spectra of disordered graphite show two quite sharp modes, the Gpeak around 1580–1600 cm 1 and the D peak around 1350cm 1, usually assigned to zone center phonons of E 2g symmetry and K-point phonons of A 1g symmetry,respectively.3–6 The unusual fact is that G and D peaks, ofvarying intensity, position, and width, continue to dominatethe Raman spectra of nanocrystalline and amorphous carbons, even those without widespread graphitic ordering.The key property of interest in DLC is the s p 3 content.1This is usually measured by nuclear magnetic resonance共NMR兲 or electron-energy-loss spectroscopy 共EELS兲, butthese are time-consuming and destructive methods. Ramanscattering is sometimes used to probe the s p 2 /s p 3 fraction inDLC’s. However, visible Raman spectroscopy is 50–230times7,8 more sensitive to s p 2 sites, as visible photons preferentially excite their states. uv Raman spectroscopy, with0163-1829/2000/61共20兲/14095共13兲/ 15.00PRB 61its higher photon energy of 5.1 eV, excites both the andthe states and so is able to probe both the sp 2 and sp 3sites, allowing a direct probe of the sp 3 bonding.15,16 Nevertheless, visible Raman spectroscopy is widely used onDLC’s, and it would be very useful to have a framework inwhich at least indirectly derive the sp 3 fraction of DLC’s.The aim of this paper is to describe in detail the Ramanprocess in disordered carbons. It is shown that the visibleRaman spectrum depends fundamentally on the ordering ofsp 2 sites and only indirectly on the fraction of sp 3 sites. Wegive a restricted range of conditions under which it is possible to use visible Raman spectroscopy to derive the sp 3content. To do this, we first describe the atomic and electronic structure of amorphous carbon and then the nature ofRaman scattering in disordered carbons, both of which showunique features. We then present a three-stage model relatingthe visible Raman parameters to the sp 2 nanostructure andcontent of disordered carbons. This is sufficiently general tohold for all amorphous carbons, both hydrogenated andhydrogen-free. This paper focuses on the G and D peaks,neglecting other features that are sometimes present, such asFIG. 1. Ternary phase diagram of amorphous carbons. The threecorners correspond to diamond, graphite, and hydrocarbons,respectively.14 095 2000 The American Physical Society
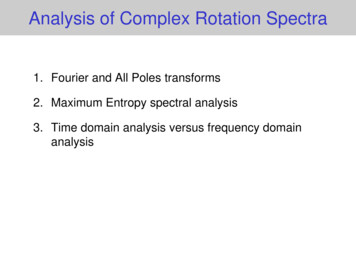
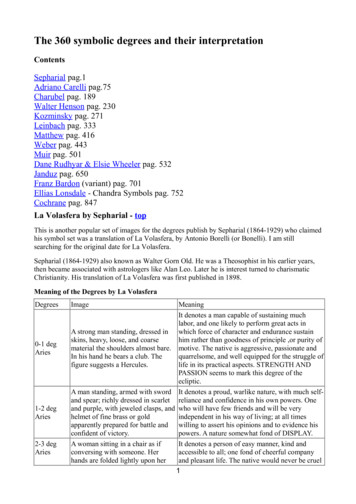
A. C. FERRARI AND J. ROBERTSON14 096PRB 61those at 1100–1200 and 1400–1500 cm 1, which will bediscussed elsewhere.II. ATOMIC AND ELECTRONIC STRUCTURE OFDISORDERED CARBONSDisordered carbons have s p 3 and s p 2 sites. The sp 3 siteshave only states while the s p 2 sites also possess states.It is often possible to treat and states separately. and bonds have a significantly different behavior. bonds aretwo-center bond orbitals between adjacent atoms. In thebond-orbital approximation,17,18 any property of occupiedstates such as the total energy, charge density, or polarizability can then be expressed as simply the sum of independent,short-range terms for each bond. There are no long-rangeforces in this approximation, and the electron structure depends only on short-range order. states are different, because a orbital usually interactswith states on more than one atom to form a conjugatedsystem such as benzene. Then, one can no longer defineunique bond orbitals. Conjugated bonds cannot now be expressed as the sum of independent, two-center bonds. Eachbond contains contributions from adjacent bonds, and thisgives rise to longer-range forces and long-rangepolarizabilities.19The medium-range order due to -bonding distinguishesdisordered carbons from the -bonded disordered semiconductors like a-Si. bonding is maximized if the statesform pairs of aligned states, or sixfold aromatic rings orgraphitic clusters of aromatic rings.17 This occurs in microcrystalline graphite and in annealed DLC’s. However, asdeposited DLC’s are more disordered than this ‘‘clustermodel.’’ 20Figure 2共b兲 shows the band structure of a single graphitelayer.17 The and states act separately. The states liewell away from the Fermi level and have gap of 6 eV. states and empty * states form bands that touch at theBrillouin zone K. The band energies along KM innearest-neighbor tight-binding approximation areE 兩 1 2 cos共 ka 兲 兩 ,共1兲where is the pp interaction, a is the lattice spacing, andk is the wave vector. In graphitic clusters, the states haveminimum band energies of roughly17E g 冉 冊2 a 2 ,M 1/2La共2兲where M is the number of aromatic rings in the cluster andL a is the cluster diameter or in-plane correlation length.We consider aromatic clusters as parts of a graphite superlattice. Hence, from Eqs. 共1兲 and 共2兲, the energy states ofthe clusters can be mapped onto those of graphite bya1 2 cos共 ka 兲 La共3兲or sin( ka) a/()La) for small k, where k is the k distance away from K, and K ( 32 , 23 ) /a. Smaller clusters correspond to k’s further away from K.FIG. 2. 共a兲 Phonon dispersion 共Ref. 21兲 and 共b兲 electronic bandstructure 共Ref. 17兲 of a single graphite layer. Similar phonon dispersion of graphite is found in the ab initio calculations of Kresse,Furthmuller, and Hafner 共Ref. 22兲. The bold lines from and Kmark the mapping of the E 2g and A 1g -like eigenvectors of aromaticclusters on those of graphite, according to Mapelli et al. 共Ref. 21兲.The bold line from K to M corresponds to phonons selected by thek q ‘‘quasi selection rule,’’ as shown by the dashed vertical line.The phonons on the right of K, from K to , are also selected by thek q ‘‘quasi selection rule,’’ but do not correspond to modes withhigh modulation of polarizability.The long-range effects in conjugated systems can be formalized by defining a mobile bond order P u v between twoorbitals19 u, v :P u v 2c uc v兺occ共4兲and a bond-bond polarizability u v ,wx between bonds uv andwx: u v ,wx 2E, u v wx共5兲for wave functions 兺 c u u , where the sums are overoccupied states.19 E is the sum of energies of occupied statesand u v is the nearest-neighbor interaction along bond uv.The difference between and states is that for statesP u v 0 if orbitals u and v are on different bonds, while inconjugated systems, P u v 0, and it decreases graduallywith the separation of u and v .
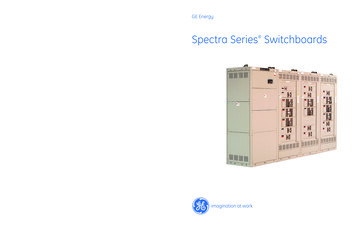
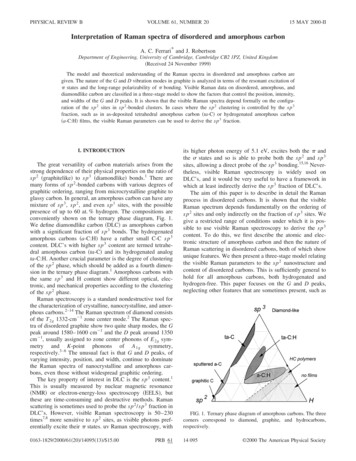
PRB 61INTERPRETATION OF RAMAN SPECTRA OF . . .14 097The vibrational modes of covalent solids are often modeled as a valence force field of bond-stretching and bondbending forces. These forces are usually short-ranged for -bonded systems.26 On the other hand, a valence force fieldfor graphite typically uses forces up to fifth-nearestneighbors.27,28 Recently Mapelli et al.21 were able for thefirst time to provide a common force field for aromatic molecules and graphite by using forces proportional to the bondorders P u v and bond-bond polarizabilities u v ,wx , Eqs. 共4兲and 共5兲. As is directly related to the electronic structureand tight-binding parameter , this method provides a formalrelationship between longer-range forces, so they are not justadjustable parameters.IV. RAMAN SCATTERING IN DISORDERED CARBONRaman modes in single crystals obey the fundamental selection rule q 0, where q is the wave vector of the scatteredphonon. In a finite-size domain, the selection rule is relaxedto allow the participation of phonons near , with q 2 /d, where d is the dimension of the crystalline domain.Nemanich, Solin, and Martin29 共NSM兲 showed that the Raman scattering intensity of a finite crystal is given byI共 兲 FIG. 3. Phonon density of states of a single graphite layer共graphene兲 共Ref. 21兲 and of diamond 共Ref. 23兲.III. VIBRATIONAL MODESFigure 3 shows the vibrational density of states 共VDOS兲of graphite and diamond.21–23 The VDOS of diamond extends beyond its Raman frequency, 1332 cm 1, to 1360cm 1. Figure 2共a兲 also shows the phonon dispersion curvesof a graphite layer.21 The graphite VDOS extends beyond its -point Raman frequency up to a band limit of 1620 cm 1,due to the upwards phonon dispersion away from . Graphite has a higher VDOS band limit than diamond because thesp 2 sites have stronger, slightly shorter bonds than sp 3 sites.The DOS of alloys can be of two types. If the couplingbetween sites is small, the alloys are in the atomic limit, sothe alloy DOS resembles a compositionally weighted mixture of the DOS of each component. If the coupling is strong,then the alloy DOS and the band limits interpolate smoothlybetween the two components. The Raman spectra suggestthat the VDOS of DLC’s are in the atomic limit, in thatspecific features, such as the G mode of s p 2 sites, remain atall s p 2 contents. Thus, the band limit does not change linearly with s p 3 content from 1600 to 1360 cm 1. This ispartly because s p 2 sites tend to cluster in a s p 3 matrix inDLC’s.17 A consequence is that the vibrations of sp 2 sitesremain around 1600 cm 1 and lie above the band limit of thesp 3 matrix. This causes these modes to be localized on thesp 2 sites and above the extended modes of the s p 3 matrix.24The band limit thus cannot be used as a way to get the sp 3fraction, as sometimes suggested.25 We therefore need a different approach in which the changes in the visible Ramanspectra are related primarily to the changes of the sp 2 phaseand only weakly to the s p 3 phase.n 共 兲 1 C„q, j 共 q兲 兩 F 共 q兲 兩 2兺q, j /2 关 j 共 q兲兴 2 2 /4,共6兲where C„q, j (q) is the Raman coupling coefficient for aphonon of wave vector q and branch j, and 兩 F(q) 兩 2 is thewave-vector uncertainty of the phonons involved in the lightscattering. n( ) 1 is the boson occupation factor, and isthe phonon lifetime broadening. In amorphous materials, thewave-vector uncertainty is q 1/a, where a is the bondlength, and now all phonon modes can participate in theRaman spectrum. The intensity is now given by the matrixelement-weighted vibrational density of states according tothe Shuker-Gammon formula30I共 兲 n 共 兲 1C共 兲G共 兲. 共7兲Here, G( ) is the VDOS of the disordered network. Equation 共7兲 describes quite well the Raman spectra of a-Si anda-Ge, which are sp 3 bonded only, by using a broadenedversion of the crystalline VDOS as G( ). 26The visible Raman spectra of disordered carbons are inmarked contrast. The VDOS of disordered carbon with various sp 3 contents consists of smooth, broad features.31,32 Incontrast, the Raman spectra of all disordered carbons aredominated by the relatively sharp G and D features of thesp 2 sites. This could be ascribed to the much greater crosssection of the states.7,8 Nevertheless, the prevalence of Gand D-like features, even in amorphous carbons with littlegraphitic ordering, requires explanation.The G mode of graphite at 1581 cm 1 has E 2g symmetry.Its eigenvector shown in Fig. 4共a兲 involves the in-planebond-stretching motion of pairs of C sp 2 atoms. This modedoes not require the presence of sixfold rings, and so it oc-
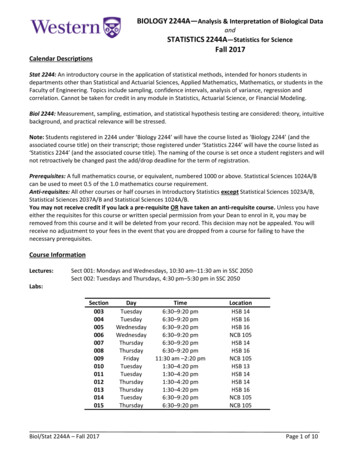
A. C. FERRARI AND J. ROBERTSON14 098FIG. 4. Carbon motions in the 共a兲 G and 共b兲 D modes. Note thatthe G mode is just due to the relative motion of sp 2 carbon atomsand can be found in chains as well.curs at all sp 2 sites, not only those in rings. It always lies inthe range 1500–1630 cm 1, as it does in aromatic and olefinic molecules.33The D peak around 1355 cm 1 is a breathing mode of A 1gsymmetry involving phonons near the K zone boundary, Fig.4共b兲. This mode is forbidden in perfect graphite and onlybecomes active in the presence of disorder. The D mode isdispersive; it varies with photon excitation energy, evenwhen the G peak is not dispersive.34–37 We will see that itsintensity is strictly connected to the presence of sixfold aromatic rings. Tuinstra and Koenig3 共TK兲 noted that the ratioof its intensity to that of the G peak varied inversely withLa :I共 D 兲 C共 兲 ,I共 G 兲La共8兲where C(515.5 nm) 44 Å. 2,3,37 The D peak was first attributed to a A 1g breathing mode at K, activated by the relaxation of the q 0 selection rule.3 It was then linked tomaxima in the VDOS of graphite at M and K points.4,27However, this does not account for the dispersion of the Dposition with photon energy, why the D peak overtone, seeneven where no D peak is present, is dispersive, or why theI(D)/I(G) ratio 共8兲 is dispersive.34 Phonon confinement 共6兲does not explain why the D mode is more intense than otherswith smaller q. It also does not explain why the D mode isseen in disordered graphite with L a 30 nm, 6 when the NSMformula 共6兲 would limit the participating phonons to a muchnarrower q range around .Figure 2共a兲 shows the phonon dispersion of a single layerof graphite. Baranov et al.,35 Pocsik et al.,36 and Matthewset al.37 proposed that the D peak arises as resonant Ramancoupling by a strong enhancement of the Raman cross section of the phonon of wave vector q, when it equals the wavevector k of the electronic transition excited by the incidentphoton (k q ‘‘selection rule’’兲.PRB 61We now give a more detailed account. In particular, wepropose a physical mechanism to explain the k q ‘‘quasiselection rule;’’ we identify a different branch in the dispersion relation as the origin of D peak 共in contrast to Refs. 36and 37兲. We formally show which real-space motions giverise to the D peak, and we propose, on the basis of the‘‘quasi selection rule,’’ an interpretation to some experimental findings.Raman scattering is the inelastic scattering of photons byphonons due to the change of polarization caused by thephonon mode.38 When the photon energy is above the bandgap, electrons of all wave vectors can be excited. However,in graphite, the band gap lies in the visible range only withina small part of k space around the K point, Fig. 2共b兲. Allthese bands have character. In this case, photons resonantly excite states only at the k vector where the band gapequals the photon energy. This sets up a polarization densitywave of this k vector. Its intensity is strong because of thelong-range polarizability of states.The change of bond polarization with bond length is byfar the dominant term in the Raman matrix element for states.26 This term is large for the breathing mode of sixfoldrings. By symmetry, for a breathing mode of a graphiteplane, the contributions from each ring add constructivelybecause of the long-range polarization. On the other hand, bysymmetry, contributions from rings of other orders within agraphite plane tend to cancel. Thus, the polarization waveand Raman coupling have long-range coherence for breathing modes due to the bonding and the symmetry of thegraphite sheet. The greatest coupling is when the electronand phonon states are in phase over the range of polarization.This leads to the ‘‘quasi selection rule,’’ k q, for thebreathing modes of graphene sheets, Fig. 2. For first-orderscattering, the fundamental selection rule must be relaxed toallow non-(q 0) phonons to contribute. This means that wealso need disorder to allow the enhancement of k qphonons.Turning to graphitic clusters, we noted above that theelectronic states of graphitic clusters of size L a can bemapped onto the modes of graphite at wave vector k by Eq.共3兲. Mapelli et al.21 showed that the eigenvectors of the mainRaman modes of aromatic oligomers have the same symmetry as the E 2g and A 1g Raman modes of graphite. They alsoshowed that the eigenvectors of these oligomers or clusterscan be mapped onto those of graphite phonons along thedirection KM . In particular, the A 1g -type breathing modesof the aromatic clusters map onto phonons between K and(K M )/2, and the E 2g -type modes map onto phonons from to ( K)/4 共branches shown in bold in Fig. 2兲. Our relationship 共3兲 can be used to map the A 1g -like modes, thusproviding a way to visualize the real-space motion along thatbranch. This indicates that aromatic clusters can be considered as a part of a graphite superlattice, both electronicallyand vibrationally. This simultaneous mapping means that thebehavior and dispersion of the D and G peaks in graphitealso holds for aromatic oligomers and clusters in disorderedcarbon.Band and phonon dispersions are rather isotropic aroundK. As the photon energy rises, the k q selection rule selectsa ring of phonons around the K point. The symmetric breathing modes have the highest modulation of the polarizabilityand therefore have the highest Raman cross section. Thissuggests that modes between K and M give the highest con-
PRB 61INTERPRETATION OF RAMAN SPECTRA OF . . .tribution to the D peak and possibly explains why the intensity of D peak is higher than modes from other branches ofthe dispersion curves but with the same q. Note that previousworks36,37 assigned the D peak to all the modes around K inthe lower optical branch, which touches the acoustic branchat K. To select the correct optical branch we cannot just relyon the coincidence between its calculated dispersion and theexperimental positions of D peak. The A 1g mode is singlydegenerate. We thus need a band singly degenerate at K andupwards dispersing away from K. The branch chosen byRefs. 36 and 37 leads to a doubly degenerate E mode at K.21The upper branch in Ref. 37 disperses downwards, but the abinitio calculations of Mapelli et al.21 and Kresse, Furthmuller, and Hafner22 reproduce the symmetry and upwardsdispersion, Fig. 2.Applying the k q selection rule to all the phononbranches of graphite, we can account for other features of theRaman spectrum. First, considering the 2400-cm 1 peak asan overtone of the lower acoustic branch away from K, wecan explain its
phous carbons.2–14The Raman spectrum of diamond consists of the T2g 1332-cm 21 zone center mode.2 The Raman spec-tra of disordered graphite show two quite sharp modes, the G peak around 1580–1600 cm21 and the D peak around 1350 cm21, usually assigned to zone center phono