Transcription
w w w. p e r k i n e l m e r. c o mS P E C T R O S C O P YTop 20 QuestionsAnsweredR A M A NIntroduction toRaman Spectroscopy
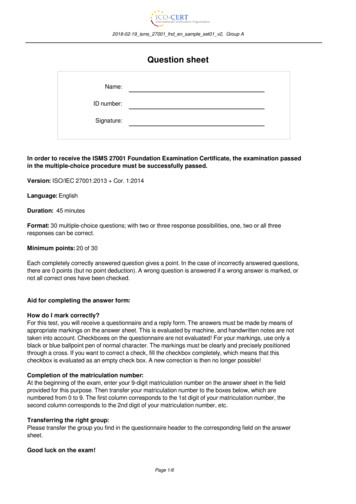
1. Can Raman spectra be obtained fromsolids, liquids and gases?Raman spectra can be obtained from most molecularsamples, i.e. solids, liquids, gels, slurries, powders,films, etc. Raman spectra can even be obtained fromsome metals!It is possible to obtain Raman spectra of gases. However,since the concentration of molecules in gases is generallyvery low, this typically requires special equipment,such as long pathlength cells. Sometimes an N N peakfrom gaseous nitrogen can be observed.2. Can I do Raman spectroscopy onmixtures?Yes, a Raman spectrum is a spectral “fingerprint”.If there are a number of different compounds in amixture, the resulting Raman spectrum will be asuperposition of the spectra of each of the components.The relative intensities of the peaks can be used to givequantitative information on the composition of a mixture of known compounds.Where the identities of the components are unknown,simple software-based protocols, such as “spectralstripping” and library searching, can be used to identifythem. In many cases this is possible even where theinitial spectra are too complex to be resolved with thenaked eye.Figure 1 shows an example of a Raman spectrum of amixture, in this case o-, m- and p-xylene. This spectrumis of 33% p-xylene, 33% o-xylene, 33% m-xylene andhas been captured through a glass bottle.2Figure 1. Sample Raman spectrum of a mixture.3. Is Raman qualitative or quantitative?Raman is both qualitative and quantitative.As previously mentioned, Raman spectra are uniquemolecular “fingerprints”. Spectral library searchingcan be conducted to allow qualitative analysis.Quantitative analysis of a mixture is typically performedby measuring the relative intensities of bands that aredirectly proportional to the relative concentrations ofthe compounds. Alternatively, chemometric methodscan be used. These quantitative analyses can be performed on samples with high concentrations rangingfrom 90-100% material of interest down to concentrationdetermination at PPB levels.4. Will a pure chemical overload thedetector?No, Raman detectors, or Charge Coupled Device detectors(CCDs), have a wide dynamic range and users can selectthe appropriate exposure time for their sample.5. Does Raman work on aqueous samples?Yes! Water does give a Raman spectrum, but it is a weakRaman scatter. For example, a 4% alcohol in watersolution will yield a Raman spectrum containing signals from both the alcohol and the water. The waterspectrum (96%) will be about the same intensity asthe alcohol (4%). Trace analysis in water is alsopossible using Surface Enhanced Raman.
6. How long does a Raman spectrum taketo acquire?This depends on the sample, but all PerkinElmer Raman instruments can acquire a Raman spectrum ofmost substances in a matter of seconds. Figure 2 showsa spectrum of a paracetamol tablet taken in just onesecond.Figure 4. Raman spectrum with glass bottle removed.8. Does Raman work through glass orplastic containers?Yes. Analysis can also be carried out through many othercontainers such as Pyrex reaction vessels, plastic containers, blister packs, and many plastic bags.Figure 2. Spectrum of a paracetamol tablet taken in one second.9. Can I do Raman at high/lowtemperatures and variable pressures?7. Does Raman require any samplepreparation?Usually, no. Raman spectra can be obtained from bulksolids, liquids, tablets, polymers, paper, etc. with littleor no sample preparation. Analysis can also be carriedout through many containers such as glass bottles, Pyrex reaction vessels, plastic containers, blister packs, bags,etc. See Figures 3 and 4.Yes, and it is simple! PerkinElmer offers a range ofvariable temperature cells and fiber optic probes foruse at elevated temperatures and pressures. Temperatures up to 500 C and pressures of up to 3000 PSIcan be easily accommodated. If needed, temperaturesand pressures above this are accessible using customized equipment.10. Is Raman destructive?Figure 3. Automatic spectral subtraction from a glass bottle.Raman is usually not destructive, but if too much laserpower is used or if the power is focused on a smallpoint (in a microscope) it can be destructive, i.e. it canburn your sample. Since FT-Raman systems employhigher power lasers (up to 2 Watts compared to milliwatts), greater care must be taken to ensure the sampledoes not get damaged. Sample burning is less of aproblem with dispersive Raman spectrometers sincemuch lower laser powers are employed. Using a largesample spot or lowering the laser power significantlyreduces the risk of sample damage.w w w. p e r k i n e l m e r. c o m3
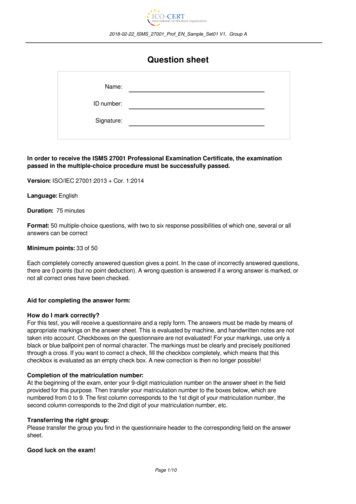
11. What type of laser is used inPerkinElmer’s Raman instruments?The PerkinElmer Raman instruments incorporate a linenarrowed, high performance 785 nm stabilized diodelaser. A 785 nm laser employed at this wavelength provides excellent sensitivity and minimizes the incidenceof sample fluorescence.Additional laser information:What is the laser’s linewidth?Linewidth is 0.03 nm.What is the stimulated emission background (howmany dB from the laser center Wavelength)?See Figure 5 for stimulated emission backgroundexamples.What are the noise level and the long-term instability?Signal-to-noise ratio 40 dB, relative intensitynoise -100 f 1 GHz, stability 0.1 nm.Is it possible to adjust the laser power illuminated atthe sample?Yes, this is software adjustable between 100 mWand 5 mW.Figure 5. Stimulated emission background examples.12. What is the line density of your grating?The PerkinElmer Raman 400 series instruments incorporate an Echelle spectrograph, which offers full spectral coverage at high resolution, with no moving parts.A technical note explaining how this Echelle spectrograph works is available at www.perkinelmer.com/raman.4The Echelle grating line density is not directly comparable with a traditional Raman spectrograph grating linedensity. The Echelle grating is a very special type ofgrating at about 60 l/mm. The grating is in the shape ofa letterbox and is placed at an extreme angle relative tothe incident light. This configuration, in conjunctionwith a second “cross dispersing” grating, gives a dispersion equivalent to a 1800 l/mm grating in a traditional 1/4 M spectrograph.The Echelle spectrograph gives complete spectralcoverage at high resolution in a single acquisition. Toobtain the equivalent range and resolution, a traditionalspectrograph equipped with a 1800 l/mm grating wouldhave to acquire five separate spectra and stitch them together into a complete spectrum. The Echelle gratingscan do this in a singe acquisition allowing for rapid,high quality, data acquisition.Our Raman 200 series spectrometers incorporate atraditional (Czerney Turner) spectrograph, commonin Raman. These systems utilize a 600 l/mm grating.13. What type of Rayleigh filtering is used?Our instruments use ultra steep, high performance edgefilters. These offer excellent blocking efficiency ofOptical Density (OD) 6 and allow analysis down to95 cm-1, with no need for user optimization. Theseedge filters are environmentally stable and have lifetime stability, unlike holographic filters. Overall, wehave OD of 12 at the laser wavelength (2 x Rayleighfilters, each with an OD of 6).14. Can you provide detailed specificationof the available Charge Coupled Detectors(CCD) for the Raman product line?PerkinElmer offers a choice of high performance,scientific-grade CCD detectors: Front Illuminated,Open Electrode and Deep Depletion CCDs. A detailedtechnical note of the various CCDs available can befound at www.perkinelmer.com/raman.
15. During analysis of multiple samples,such as in the case of multi-well plates, isthe autofocus function available to optimize the focal point on each sample?Yes, autofocus can be automatically applied at everypoint. If the system is configured to take a map of eachsample in a multi-well plate, autofocus can be appliedat the center-point of each map or at every point ineach map.17. What type of Raman instruments areavailable?There are three types of Raman instruments: benchtopspectrometer, fiber optic spectrometer and Ramanmicroscope. At PerkinElmer, we offer all three typesof instruments.Benchtop: RamanStation Fiber Optic: RamanFlex Microscope: RamanMicro 16. Can Raman differentiate betweenunlike polymorphic forms?The built-in video camera available on the RamanStationand RamanMicro systems can be used to observe visiblemorphological changes between different polymorphs.The Raman spectra of polymorphs will be different, butin many cases these variations are small and can occuranywhere in the spectral range. The extended wavenumber range, from 100 to over 3000 cm-1, combinedwith the high spectral resolution routinely achievablewith the RamanStation 400 ensures that any variationin peak position and/or peak intensity is readily measured.Figure 6. Visible morphological changes between different polymorphs.Product brochures and technical specifications forthese instruments can be found on our webpage atwww.perkinelmer.com/raman.Figure 7. Fiber optic probe.w w w. p e r k i n e l m e r. c o m5
18. Can the user write their own LabVIEWprogram to control their system?Yes, we provide LabVIEW drivers that allow full instrument control, including acquisition setup, start acquisition, take background, etc. It is also possible to autofocus and control the motorized XYZ stage using theLabVIEW interface.19. Is fluorescence a problem?Fluorescence can often contaminate Raman spectra.The use of a Near-IR 785 nm laser radically reduces thepossibility of fluorescent contamination, but there canstill be some fluorescent problems. It is often the casethat photo-bleaching can reduce the fluorescence downto cosmetic levels, and auto-baseline correction canremove the residual baseline. These two facilities areavailable in the PerkinElmer Spectrum software. Figures8, 9, and 10 illustrate the effects of photo-bleaching andauto-baseline correction. Technical notes explainingphoto-bleaching and auto-baseline correction areavailable at www.perkinelmer.com/raman.Figure 8. Highly fluorescent Raman spectrum from an ink sample.Figure 10. Auto-baseline correction removes residual fluorescentbaseline, resulting in fluorescent-free Raman spectrum.20. What is Raman imaging and what canit be used for?Figure 9. Two minutes of photo-bleaching radically reduces theintensity of the fluorescent background.6In Raman imaging, Raman spectra are taken over a predetermined sample surface area in a set sequenceand with a defined point interval (spatial resolution).
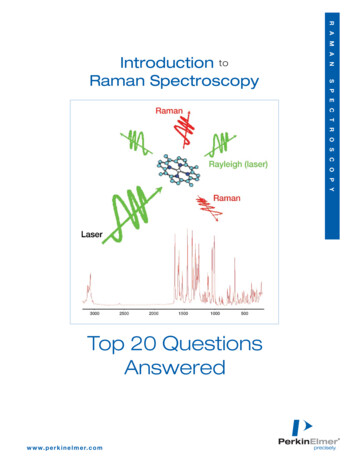
This set of data is displayed as an image where areas ofhigh Raman intensity are shown in one color (normallyred) and areas of lower intensity are shown in a differentcolor (normally blue). This variation in color may simplyreflect a difference in concentration of the same materialacross the sample, or may show variation in chemicalcomposition. Underlying each pixel of the image is theappropriate Raman spectrum associated with that pointon the sample.The Spectrum software allows the user to display theseindividual spectra and generate chemical distributionimages of the components in the sample. A visibleimage survey of the sample is acquired using the builtin video camera and motorized stage. The area wherethe Raman image is acquired is comparable with thisvisible image shown in Figure 11.This technique will be of interest to any laboratory wanting to better understand the distribution of componentswithin their samples. Obvious examples include distribution of components within pharmaceutical tablets,distribution of minerals over a geological sample anddistribution of components within a composite.Figure 11. Chemical distribution images of components in a sample.PerkinElmer, Inc.940 Winter StreetWaltham, MA 02451 USAPhone: (800) 762-4000 or( 1) 203-925-4602www.perkinelmer.comFor a complete listing of our global offices, visit www.perkinelmer.com/lasoffices 2007 PerkinElmer, Inc. All rights reserved. The PerkinElmer logo and design are registered trademarks of PerkinElmer, Inc. RamanFlex, RamanMicro, RamanStation and Spectrumare trademarks and PerkinElmer is a registered trademark of PerkinElmer, Inc. or its subsidiaries, in the United States and other countries. Pyrex is a registered trademark of Corning,Inc. LabVIEW is a trademark of National Instruments. All other trademarks not owned by PerkinElmer, Inc. or its subsidiaries that are depicted herein are the property of their respectiveowners. PerkinElmer reserves the right to change this document at any time without notice and disclaims liability for editorial, pictorial or typographical errors.007927 02
naked eye. Figure 1 shows an example of a Raman spectrum of a mixture, in this case o-, m- and p-xylene. This spectrum is of 33% p-xylene, 33% o-xylene, 33% m-xylene and has been captured through a glass bottle. 3. Is Raman qualitative or quantitative? Raman is both qualitative and quantitative. As previously mentioned, Raman spectra are unique