Transcription
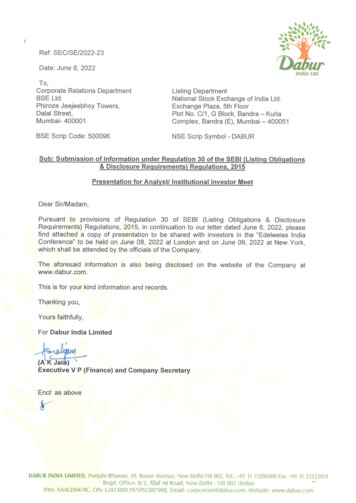
{ .(jRef: SEC/SE/2022-23 urDate: June 8, 2022India Ltd.To,Corporate Relations DepartmentBSE Ltd.Phiroze Jeejeebhoy Towers,Dalal Street,Mumbai- 400001Listing DepartmentNational Stock Exchange of India Ltd.Exchange Plaza, 5th FloorPlot No. C/1, G Block, Bandra - KurlaComplex, Bandra (E), Mumbai - 400051BSE Scrip Code: 500096NSE Scrip Symbol - DABURSub: Submission of information under Regulation 30 of the SEBI (Listing Obliaations& Disclosure Requirements) Regulations, 2015Presentation for Analyst/ Institutional Investor HfleetDear Sir/Madam,Pursuant to provisions of Regulation 30 of SEBI (Listing Obligations & DisclosureRequirements) Regulations, 2015, in continuation to our letter dated June 6, 2022, pleasefind attached a copy of presentation to be shared with investors in the "Edelweiss IndiaConference" to be held on June 08, 2022 at London and on June 09, 2022 at New York,which shall be attended by the officials of the Company.The aforesaid information is also being disclosed on the website of the Company atwww.dabur.com.This is for your kind information and records.Thanking you,Yours faithfully,For Dabur India Limited K (AlthaAp Executive V P (Finance) and Company SecretaryEnd: as aboverDABUR INDIA LIMITED, Punjabi Bhawan, 10, Rouse Avenue, New Delhi-110 002, Tel.: 91 11 71206000 Fax: 91 11 23222051Regd. Office: 8/3, AsafAli Road, New Delhi -110 002 (India)PAN: AAACD0474C, CIN: L24230DL1975PLC007908, Email: corpcomm@dabur.com, Website: www.dabur.com
Building Business Purposefully And SustainablyEdelweiss IndiaConferenceJune 2022
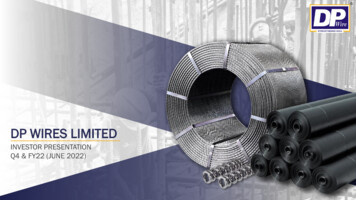
DABUR – BRIEF OVERVIEWMarket Cap:INR 90,000 crore (USD 11.6 bn)Established in 1884 –138 years of trust andheritage6Strong overseaspresence with 26%contribution1Vision:5Dedicated to theHealth andWell-Being ofevery Household4One of the largest distributionnetwork in India, covering 6.9 mn outlets2Among the Top 4FMCG companiesin India321 world classmanufacturing facilities
DABUR OUR CORPORATE JOURNEY1884Birth of Dabur in an Ayurvedic pharmacyin Kolkata2004Identity makeover;Sets up international business in Dubai1894Establishes first unit to produce Ayurvedicmedicines2005Acquires Balsara to strengthen Oral Careportfolio1919Establishes research lab for Ayurvedicmedicines2007Forays into Beauty Retail under NewU brand1972Company shifts base from Kolkata to Delhi2008Acquires Fem Care;Strengthens Skin Care presence1986Registered as a Public Limited Company2010Twin overseas acquisitions with Hobi of Turkeyand Namaste of US1994Listed on BSE;IPO oversubscribed 21 times2018Market Capitalisation crosses 10 bn1998Burman family begins handing overmanagement to professionals2021Market Capitalisation crosses INR 1 trillion2003Pharma business demerged to focus on coreFMCG business2022Revenue from Operations crosses INR 10,000crore (to touch INR 10,889 crore in FY22)
DABUR MANUFACTURING FACILITIES IN atniIndorePithampurSilvassaNasikNarendrapur
DABUR MANUFACTURING FACILITIES OVERSEASTurkey (EU)85Egypt (COMESA)Nigeria (ECOWAS)46Nepal123BangladeshSri LankaUAE(GCC GAFTA)7South Africa (SADC)*3P manufacturing facilities in USA not shown
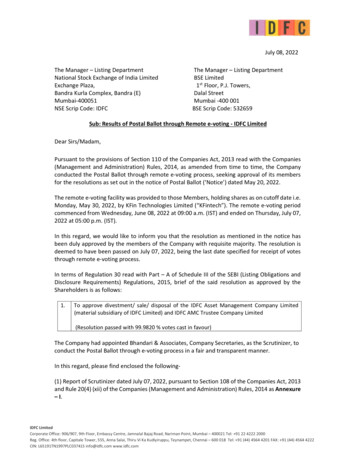
FY22 PERFORMANCE HIGHLIGHTS AND SUMMARYConsol Revenuecrosses INR10,000 cr forthe first timeStandaloneRevenue crossesINR 8,000 cr forthe first timeHighest annualrevenue growthin last 8 years13.9%13.8%15.8%Consolidated Revenue GrowthIndia StandaloneRevenue GrowthInternational Business Growthin Constant Currency12.5%14.5%7.7%Operating Profit GrowthProfit Before Tax andExceptional Items GrowthPAT before exceptional itemsGrowthExceptional item relates to INR 85 cr of goodwill impairment of wholly-owned subsidiary, M/s Hobi Kozmetik
Volume Growth – Domestic BusinessConsolidated Revenue from Operations(INR cr)Standalone Revenue from Operations(INR cr)2-yr CAGR: 11.9%2-yr CAGR: 13.9%12.4%8,18010,88910.1%7,185FY22 KEY FINANCIALS9,5628,7046,310 10%FY21FY22Consolidated Operating Profit (INR cr)and Margin (%)20.6%1,79220.9%2,00320.7%FY20 14%FY21 14%FY22FY20Consolidated PAT before exceptionalitems (INR cr) and Margin (%)17.5%16.8%1,6931,824FY21FY22Market Cap (INR cr)17.7%2,254 14%95,52994,854FY21FY2279,5621,522FY20Operating ProfitFY21FY22Operating Profit MarginFY20PAT (bei)FY21FY22PAT (bei) MarginFY20
DABUR BUSINESS STRUCTURE
FY22 DOMESTIC FMCG GROWTH – BY VERTICALSFY21 Sales ContributionFood and Beverage13.1%FY22 Sales ContributionFood and careHome & Personal Care (HPC)2-yr CAGR: 17.8%2,006FY20FY21Food & Beverage (F&B)2-yr CAGR: 11.1%5.2%2,647Healthcare35.9%2-yr CAGR: 21,312942888FY20FY21FY22
MARKET LEADERSHIP IN MOST CATEGORIESLeading position in key categories across verticals#Relative Competitive yMassageOilGlucoseHair OilsOral CareSkinCare BleachesToilet HealthcareHome and Personal CareFoods
INTERNATIONAL BUSINESS OVERVIEWInternational BusinessFY22 Revenue BreakdownInternational Business grew by 15.8% in CC terms(11.8% in INR)FY22 Constant Currency Growth %Asia22%MiddleEast26%MENA13.4%Egypt18.7%SSA .0%NamasteHobbySAARC21.4%17.6%14.7%
MARKET LEADERSHIP IN INTERNATIONAL BUSINESS#1Saudi Arabia#2Hair OilHair CreamHair GelHair Mask#3Hair SerumsDepilatoriesHair OilHair CreamHair MaskHair GelHair SerumsHair OilsHair CreamHair GelHair MaskHair SerumsDepilatoriesToothpasteEgyptUnited Arab Emirates
KEY STRATEGICPILLARS
KEY STRATEGIC PILLARS1Power Brands to Power Platforms2Dial up innovation capability3Scale up RTM4Transform into a data powered and tech-driven organization5Drive efficiencies through Operational Excellence6Build a sustainable, ESG compliant business
1. Power Brands to Power PlatformsFromTo Mango DrinkReal PETReal FizzReal MiniReal Seeds(underReal Health)Juices, Nectars & CoconutWater Increase MS incore J&NcategoryScale up fruitdrinks categoryExtensions intoadjacenciesplannedPremiumizeportfolioReal VAD (under Real Milk Power)FromTo Flanker Amla Brands – Hair OilPremium Amla BrandDabur Amla Kids RangeIncrease MSExtensions intoadjacenciesplannedPremiumizeportfolio
2. Dial up innovation capabilitySelect NPDs of FY22Innovation contribution5.6%4.9%1.9%FY181.4% 1.2%FY19FY20FY21FY22
3. Scale up RTMIncrease Direct Reachby 100-200k outletsExpand VillageCoverage to 100k Outlets (mn)Villages1.4-1.5Category SpecificFocused RTMSales from OrganizedChannel1,00,000 rs1.31FY22Quantum Growth inOrganised ChannelsAyurvedaASPs6.5%E-commMTSaliency of Organized Channelsexpected to increase fromcurrent 20% to 28-30% in 3-4years
4. Transform into a data powered and tech-driven organizationTODAYTOMORROWLinear & Fragmented Value ChainConnected, Agile, Non-Linear DataDriven ibuteSales & MarketingData, Tech &AnalyticsOperationsCustomers
5. Drive efficiencies through Operational ExcellenceMedium term plan for Operational ExcellenceProcurement Delivery &Service Level Management Cost ManagementManufacturingStrengthen backwardintegration of jadibootis and other agriproductsDigitize se use of dataanalytics inprocurementExplore creation ofCommodity FuturesDesk RDP Adherence toimproveOEE ImprovementScale up Indore factoryPackaging Reduce manufacturingcost / case New global packagingformats & technologiesto reduce cycle time,pack standardization,weight optimizationReduce packaging costthrough valueengineeringIntroduce recyclablematerial incommercially viableareasSupply Chain Distributor RA toincreaseMT fill rate to improveAnalytics driven S&OP Reduce cost of supply Samriddhi Project to continue to drive cost savings and value creation
6. Build a sustainable, ESG compliant businessTODAYFUTURE STRATEGYFirst Indian FMCG company to be plastic waste neutral51%Improvement in EnvironmentIndicators (vs 2017-18)CSR InitiativesReduction in SOxemissions54%FY22 CSRExpenditure (INR cr)Reduction in RawWater Usage33%FY22 CSRBeneficiaries (mn)Reduction in CO2emissionsE% of Energy consumed fromrenewable energy sources20%Reduction inHazardous Waste17%Reduction in EffluentGeneration10%31.22.3CSR Focus Areas: Covid support initiatives Eradicating hunger, povertyand malnutrition Promoting PreventiveHealthcare Environment Sustainability Promotion of EducationSG Plastic positive YoY Reduction in Energy Intensity and Water Intensity Usage of Renewable Sources for Energy to increase Become Water Positive in the long term Reduce emissions, Become Carbon Neutral in the long term Water Recycling % to improve Improve gender diversity Increase women representation in Management Positions D&I agenda to include disability, age & geography/nationalities Increase in Employee training manhours Risk management training to all employees Undertaking code of conduct and ethics training with allemployees Ensure 100% compliance to transparency & disclosures
ANNEXURE
CONSOLIDATED P&LAll figures are in INR crRevenue from operationsOther IncomeTotal IncomeMaterial Cost% of RevenueEmployee expense% of RevenueAdvertisement and publicity% of RevenueOther Expenses% of RevenueOperating Profit% of RevenueEBITDA% of RevenueFinance CostsDepreciation & AmortizationProfit before exceptional items, tax and share of profit/(loss) from jointventure% of RevenueShare of profit / (loss) of joint ventureExceptional item(s)Tax ExpensesNet profit after tax and after share of profit/(loss) from joint venture% of RevenueNon controlling interestNet profit for the period/year% of 886.9Y-o-Y 61.11,694.917.7%1.71,693.317.7%Exceptional item relates to INR 85 cr of goodwill impairment of wholly-owned subsidiary, M/s Hobi KozmetikProfit before tax and exceptional items saw a growth of 14.5% in FY22; Profit after tax and before exceptional items saw a growth of 7.7% in m.45.8%2.8%86.7%2.7%
ParticularsCONSOLIDATED BALANCE SHEETA12AssetsNon-current assets(a) Property, plant and equipment(b) Capital work-in-progress(c) Investment property(d) Goodwill(e) Other Intangible assetsInvestments in(f)joint venture(g) Financial assets(i) Investments(ii) Others(h) Deferred tax assets(i) Non-current tax assets (net)(j) Other non-current assetsTotal Non-current assetsCurrent assets(a) Inventories(b) Financial assets(i) Investments(ii) Trade receivables(iii) Cash and cash equivalentsBank Balances other than (iii)(iv)above(v) Others(c) Current tax asset(net)(d) Other current assetsTotal current assetsTotal AssetsAs at31/03/2022As 612,28510,84723Equity and LiabilitiesEquity(a) Equity share capital(b) Other EquityEquity attributable to shareholders of theCompanyNon Controlling InterestTotal equityAs at31/03/2022As 002501Non-current liabilities(a) Financial liabilities(i) BorrowingsLease(ii)liabilities(iii) Other financial liabilities(b) Provisions(c) Deferred tax liabilities (Net)Total Non-current liabilities1401334648254016314213Current liabilities(a) Financial liabilities(i) Borrowings(ii) Lease liabilities(iii) Trade payables(iv) Other financial liabilities(b) Other current liabilities(c) Provisions(d) Current tax Liabilities (Net)Total Current 158188852,93412,28510,847Total Equity and Liabilities
For more information andupdates, visit:http://www.dabur.com/in/enus/investor
This is for your kind information and records. Thanking you, Yours faithfully, For Dabur India Limited K (AlthaAp Executive V P (Finance) and Company Secretary End: as above r DABUR INDIA LIMITED, Punjabi Bhawan, 10, Rouse Avenue, New Delhi-110 002, Tel.: 91 11 71206000 Fax: 91 11 23222051 Regd. Office: 8/3, AsafAli Road, New Delhi -110 .