Transcription
Solving Problems in Dynamics and Vibrations UsingMATLABParasuram HariharaAndDara W. ChildsDept of Mechanical EngineeringTexas A & M UniversityCollege Station.
2ContentsI.An Introduction to MATLAB (3)1. Spring-Mass-Damper system (11)2. Simple pendulum .(21)3. Coulomb friction . .(26)4. Trajectory motion with aerodynamic drag . .(30)5. Pendulum with aerodynamic and viscous damping . (34)6. A half cylinder rolling on a horizontal plane . .(38)7. A bar supported by a cord .(41)8. Double pendulum .(50)9. Frequency response of systems having more than one degree of freedom .(56)10. A three bar linkage problem .(63)11. Slider-Crank mechanism .(70)12. A bar supported by a wire and a horizontal plane .(77)13. Two bar linkage assembly supported by a pivot joint and a horizontal plane (84)14. Valve Spring Model.(92)
3An Introduction to MATLABPurpose of the HandoutThis handout was developed to help you understand the basic features of MATLAB andalso to help you understand the use of some basic functions. This is not a comprehensivetutorial for MATLAB. To learn more about a certain function, you should use the onlinehelp. For example, if you want to know more about the function ‘solve’, then type thefollowing command in the command window at the prompt:help solveIntroductionMATLAB is a high performance language for technical computing. The name MATLABstands for matrix laboratory. Some of the typical uses of MATLAB are given below: Math and ComputationAlgorithm DevelopmentModeling, Simulation and PrototypingM-FilesFiles that contain code in MATLAB language are called M-Files. You create a M-Fileusing a text editor and then use them as you would any other MATLAB function orcommand. But before using the user defined functions always make sure that the ‘path’ isset to the current directory. There are two kinds of M-Files: Scripts, which do not accept input arguments or return output arguments.Functions, which can accept input and output arguments.When you invoke a script MATLAB simply executes the commands found in the file.For example, create a file called ‘SumOfNumbers’ that contains these commands:% To find the sum of first 10 natural numbersn 0;i 1;for i 1:10;n n i;i i 1;endnGo to the command window and set the path to the current directory. Then typing
4SumOfNumbersat the command prompt causes MATLAB to execute the commands in the M-File andprint out the value of the sum of the first 10 natural numbers.Functions are dealt in detail later in the handout.MatricesSuppose you have to enter a 2x2 identity matrix in MATLAB. Type the followingcommand in the command window:A [1 0; 0 1]MATLAB displays the matrix you just enteredA 1001The basic conventions you need to follow are as follows: Separate the elements in the row with blanks or commasUse a semicolon, (;) to indicate the end of each rowSurround the entire list of elements with square brackets, [].There are many other ways of representing matrices, but the above-mentioned method isone of the popularly used methods. To know more about the different types ofrepresentation, go through the online help or the MATLAB user guide.Suppose, you want to separate out the first column in the above matrix and use it forsome other calculation, then type the following in the MATLAB command window.Y A(:,1)Here Y contains the elements of the first column. Y is a 2x1 matrix. Note that the colonin the above expression indicates that MATLAB will consider all rows and ‘1’ indicatesthe first column. Similarly if you want to separate the second row then type the followingcommandT A(2,:)Solving Linear EquationsSuppose for example, you have to solve the following linear equations for ‘x’ and ‘y’.
5x 2y 6x y 0There are two methods to solve the above-mentioned linear simultaneous equations.The first method is to use matrix algebra and the second one is to use the MATLABcommand ‘solve’.Matrix AlgebraRepresenting the above two equations in the matrix form, we get 1 2 x 6 1 1 y 0 The above equation is in the form ofAX Bwhere A is known as the coefficient matrix, X is called the variable matrix and B, theconstant matrix.To solve for X, we find the inverse of the matrix A (provided the inverse exits) and thenpre-multiply the inverse to the matrix B i.e.,X A 1 BThe MATLAB code for the above-mentioned operations is as shown below. Open a newM-File and type in the following commands in the file.% To solve two simultaneous linear equations.A [1 2;1 –1];B [6;0];X inv (A)*BBefore executing the program, always remember to set the path to the current directory.Note that the first statement is preceded by a ‘%’ symbol. This symbol indicates that thestatement following the symbol is to be regarded as a comment statement. Also note thatif you put a semicolon ‘;’ after each statement, then the value of that statement is notprinted in the command window. Since we require MATLAB to print the value of ‘X’,the semicolon does not follow the last statement.
6Solve CommandThe ‘solve’ command is a predefined function in MATLAB. The code for solving theabove equations using the ‘solve’ command is as shown. Open a new M-File and type thefollowing code.% To solve the linear equations using the solve commandp ‘x 2*y 6’;q ‘x – y 0’;[x,y] solve(p,q)Subs CommandThis command is explained by means of the following example. Suppose you want tosolve the following linear equations:x 2y a 6x y aNote that there are three unknown and only two equations. So we are required to solvefor ‘x’ and ‘y’ in terms of ‘a’. To calculate the numerical values of ‘x’ and ‘y’ fordifferent values of ‘a’, we use the subs command.The following MATLAB code is used to demonstrate the ‘subs’ command.% To solve the linear equations using the subs commandp ‘x 2*y a 6’q ‘x – y a’[x,y] solve(p,q)a 0;[x] subs(x)[y] subs(y)Here the ‘solve’ command solves for the values of ‘x’ and ‘y’ in terms of ‘a’. Then ‘a’ isassigned the value of ‘0’. Then we substitute the assigned value of ‘a’ in ‘x’ and ‘y’ to getthe numerical value.Suppose a varies from 1 to 10 and we need to find the value of ‘x’ and ‘y’ for each valueof ‘a’ then use the following code:% To solve the linear equations using the subs command
7p ‘x 2*y a 6’q ‘x – y a’[x,y] solve(p,q)i 0;for a 1:10t(i) subs(x);p(i) subs(y);i i 1;endIn the above code t(i) and p(i) contains the values of ‘x’ and ‘y’ for different values of ‘a’respectively.FunctionsFunctions are M-Files that can accept input arguments and return output arguments. Thename of the M-File and the function should be the same. Functions operate on variableswithin their own workspace, separate from the workspace you access at the MATLABcommand prompt. The following example explains the use of functions in more detail.Define a new function called hyperbola in a new M-File.Function y twice(x)y 2*x;Now in a new M-file plot ‘y’ with respect to ‘x’ for different values of ‘x’. The code is asshown belowx 1:10y twice(x)plot(x,y)Basically the function ‘twice’ takes the values of x, multiplies it by 2 and then stores eachvalue in y. The ‘plot’ function plots the values of ‘y’ with respect to ‘x’.To learn more about the use of functions, go through the user guide.Hold CommandHOLD ON holds the current plot and all axis properties so that subsequent graphingcommands add to the existing graph. HOLD OFF returns to the default mode wherebyPLOT commands erase the previous plots and reset all axis properties before drawingnew plots.One can also just use the ‘Hold’ command, which toggles the hold state. To use thiscommand, one should use a counter in connection with an ‘if’ loop; which first toggles
8the hold on state and then the counter must be incremented such that, the flow ofcommand does not enter the ‘if’ loop.% Example to show the use of the hold commandcounter 0;if (counter 0)hold;endcounter counter 1;Here the ‘hold’ command is executed only if the value of the counter is equal to zero. Inthis way we can make sure that the plots are held. The drawback of this procedure is thatwe cannot toggle the ‘hold’ to off.Plotting TechniquesThe plot function has different forms depending on the input arguments. For example, ify is a vector, plot (y) produces a linear graph of the elements of y versus the index of theelements of y. If you specify two vectors as arguments, plot (x,y) produces a graph of yversus x.Whenever a plot is drawn, title’s and a label’s for the x axis and y axis are required. Thisis achieved by using the following command.To include a title for a plot use the following commandtitle (‘Title’)For the x and y labels, usexlabel(‘ label for the x-axis’)ylabel(‘label for the y-axis’)Always remember to plot the data with the grid lines. You can include the grid lines toyour current axes by including the following command in your code.grid onFor more information about various other plotting techniques, typehelp plotin the command window.
9Suppose one wants to change the color of the curve in the plot to magenta, then use thefollowing commandplot (x,y,’m’)‘m’ is the color code for magenta. There are various other color codes like ‘r’ for red, ‘y’for yellow, ‘b’ for blue etc.The following example makes use of the above-mentioned commands to plot twodifferent data in the same plot. The MATLAB code is given below.x 0:0.1:10;y1 x.*2;y2 x.*3;plot(x,y1)hold onplot(x,y2,'-.')grid onxlabel('x')ylabel('y')title('X Vs Y')legend('y1','y2')When you run the above code, you will get the following plot.In order to save the plot as a JPEG file, click the file icon in the figure window and thenclick the export command. In the ‘save as type’ option select ‘*.jpg’. In order to importthe file in MS word, go to ‘Insert’ icon and then select ‘Picture from file’ command.
10Figure CommandSuppose you want to plot two different vectors in two different windows, use the “figure”command. The example given below illustrates the use of the “figure” command.% to illustrate the figure commandx [1,2,3,4,5,6,7,8,9,10];y [12 23 4 5 65 67 89];figure(1)plot(x)gridtitle('plot of X')figure(2)plot(y)gridtitle('plot of Y')The above code will plot the values of x and y in two different figure windows. If youwant to know more about the command type the following at the command prompt.help figure
111. Spring Mass Damper System – Unforced ResponsemkcExampleSolve for five cycles, the response of an unforced system given by the equation.m x c x kx 0(1).For 0.1; m 1 kg; k 100 N/m; x (0) 0.02 m; x (0) 0;SolutionThe above equation is a second order constant-coefficient differential equation. To solvethis equation we have to reduce it into two first order differential equations. This step istaken because MATLAB uses a Runge-Kutta method to solve differential equations,which is valid only for first order equations.Let.x v(2)From the above expression we see that.m v cv kx 0so the equation (1) reduces to.v [( ck)v ( ) x ]mm(3)We can see that the second order differential equation (1) has been reduced to two firstorder differential equations (2) and (3).
12For our convenience, putx y (1);.x v y (2);Equations (2) and (3) reduce to.y (1) y (2);(4).y (2) [(-c/m)*y (2) – (k/m)*y (1)];(5)To calculate the value of ‘c’, compare equation (1) with the following generalizedequation.x 2 n x n 02Equating the coefficients of the similar terms we havec 2 nmk n2 m(6)(7)Using the values of ‘m’ and ‘k’, calculate the different values of ‘c’ corresponding toeach value of . Once the values of ‘c’ are known, equations (4) and (5) can be solvedusing MATLAB.The problem should be solved for five cycles. In order to find the time interval, we firstneed to determine the damped period of the system.Natural frequency n For 0.1(k / m) 10 rad/sec.Damped natural frequency d n 1 2 9.95 rad/sec.Damped time period Td 2 / d 0.63 sec.Therefore for five time cycles the interval should be 5 times the damped time period, i.e.,3.16 sec.
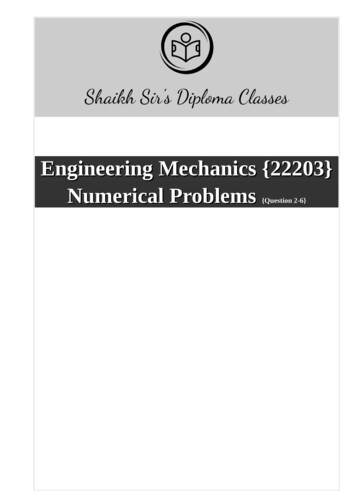
13MATLAB CodeIn order to apply the ODE45 or any other numerical integration procedure, a separatefunction file must be generated to define equations (4) and (5). Actually, the right handside of equations (4) and (5) are what is stored in the file. The equations are written in theform of a vector.The MATLAB code is given below.function yp unforced1(t,y)yp [y(2);(-((c/m)*y(2))-((k/m)*y(1)))];(8)Open a new M-file and write down the above two lines. The first line of the function filemust start with the word “function” and the file must be saved corresponding to thefunction call; i.e., in this case, the file is saved as unforced1.m. The derivatives are storedin the form of a vector.This example problem has been solved for 0.1. We need to find the value of ‘c/m’and ‘k/m’ so that the values can be substituted in equation (8). Substituting the values of and n in equations (6) and (7) the values of ‘c/m’ and ‘k/m’ can be found out. Afterfinding the values, substitute them into equation (8).Now we need to write a code, which calls the above function and solves the differentialequation and plots the required result. First open another M-file and type the followingcode.tspan [0 4];y0 [0.02;0];[t,y] ode45('unforced1',tspan,y0);plot(t,y(:,1));grid e(‘Displacement Vs Time’)hold on;The ode45 command in the main body calls the function unforced1, which defines thesystems first order derivatives. The response is then plotted using the plot command.‘tspan’ represents the time interval and ‘y0’ represents the initial conditions for y(1) andy(2) which in turn represent the displacement ‘x’ and the first derivative of ‘x’. In thisexample, the initial conditions are taken as 0.02 m for ‘x’ and 0 m/sec for the firstderivative of ‘x’.MATLAB uses a default step value for the vector ‘tspan’. In order to change the step sizeuse the following codetspan 0:0.001:4;
14This tells MATLAB that the vector ‘tspan’ is from 0 to 4 with a step size of 0.001. Thisexample uses some arbitrary step size. If the step size is too small, the plot obtained willnot be a smooth curve. So it is always better to use relatively larger step size. But it alsotakes longer to simulate programs with larger step size. So you have to decide which isthe best step size you can use for a given problem.In order to solve for different values of , calculate the values of ‘c/m’ for each value of . Substitute each value of in the function file, which has the derivatives, save the fileand then run the main program to view the result. This process might be too tedious. Thecode can be made more efficient by incorporating a ‘For loop’ for the various values ofzeta.In the above code ‘y(:,1) represents the displacement ‘x’. To plot the velocity, change thevariable in the plot command line to ‘y(:,2)’.The plot is attached below
15AssignmentSolve for six cycles the response of an unforced system given by.m x c x kx 0For {0, 0.1 0.25, 0.5, 0.75, 1.0}.Take m 5 kg; k 1000 N/m; x(0) 5 cms; x (0) 0;Develop a plot for the solutions corresponding to the seven values and comment on theplots obtained.Note: When you save the M-File, make sure that the name of the file does notcoincide with any of the variables used in the MATLAB code.
16Spring Mass Damper System – Forced Responsefsin tmkcExamplePlot the response of a forced system given by the equation.m x c x kx f sin t(1).For 0.1; m 1 kg; k 100 N/m; f 100 N; 2 n; x(0) 2 cms; x (0) 0.SolutionThe above equation is similar to the unforced system except that it has a forcing function.To solve this equation we have to reduce it into two first order differential equations.Again, this step is taken because MATLAB uses a Runge-Kutta method to solvedifferential equations, which is valid only for first order equations.Let.x v(2)so the above equation reduces to.fckv [( ) sin t ( )v ( ) x]mmm(3)We can see that the second order differential equation has been reduced to two first orderdifferential equations.
17For our convenience, putx y (1);.x v y (2);Equations (2) and (3) then reduce to.y (1) y (2);.y (2) [(f/m)*sin( * t) (-c/m)*y (2) – (k/m)*y (1)];Again, to calculate the value of ‘c’, compare equation (1) with the following generalizedequation.x 2 n x n f sin t2Equating the coefficients of the similar terms we havec 2 nmk n2 mUsing the values of ‘m’ and ‘k’, calculate the different values of ‘c’ corresponding toeach value of .To find the time interval the simulation should run, we first need to find the damped timeperiod.Natural frequency n (k / m) 10 rad/sec.For 0.1;Damped natural frequency d n 1 9.95 rad/sec.2Damped time period Td 2 / d 0.63 sec.Therefore, for five time cycles the interval should be 5 times the damped time period, i.e.,3.16 sec. Since the plots should indicate both the transient and the steady state response,the time interval will be increased.
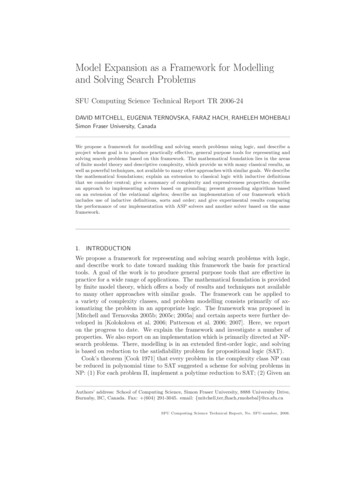
18MATLAB CodeThe MATLAB code is similar to that written for the unforced response system, exceptthat there is an extra term in the derivative vector, which represents the force applied tothe system.The MATLAB code is given below.function yp forced(t,y)yp [y(2);(((f/m)*sin( *t))-((c/m)*y(2))-((k/m)*y(1)))];Again the problem is to be solved for 0.1. So, calculate the value of ‘c/m’, ‘k/m’ and‘f /m’ by following the procedure mentioned in the earlier example and then substitutethese values into the above expression. Save the file as ‘forced.m’.The following code represents the main code, which calls the function and solves thedifferential equations and plots the required result.tspan [0 5];y0 [0.02;0];[t,y] ode45('forced',tspan,y0);plot(t,y(:,1));grid e(‘Displacement Vs Time’)hold on;Again, ‘tspan’ represents the time interval and ‘y0’ represents the initial conditions fory(1) and y(2) which in turn represent the displacement ‘x’ and the first derivative of ‘x’.In this example the initial conditions are taken as 0.02 m for ‘x’ and 0 cm/sec for the firstderivative of ‘x’. Again the default step size of the vector ‘tspan’ can be changedaccordingly as explained in the previous example.To solve for different values of , calculate the values of ‘c/m’ for each value of .Substitute each value of in the function file, which has the derivatives, save the file andthen run the main program to view the result.In the above code ‘y(:,1) represents the displacement ‘x’. To plot the velocity, change thevariable in the plot command line to ‘y(:,2)’.The plot is attached below.
19
20AssignmentPlot the response of a forced system given by the equation.m x c x kx f sin tFor {0, 0.1 0.25, 0.5, 0.75, 1.0}.Take m 5 kg; k 1000 N/m; f 50 N; 4 n, x(0) 5 cms; x (0) 0.Develop a plot for the solutions corresponding to the seven values and comment on theplots obtained.
212. Simple Pendulum lmExampleCompute and plot the linear response of a simple pendulum having a mass of 10 grams.and a length of 5 cms. The initial conditions are (0) 90 and (0) 0Also compare the generated plot with the nonlinear plot.SolutionThe differential equation of motion for the simple pendulum without any damping isgiven by.gl ( ) sin If we consider the system to be linear, i.e., for small angles,sin So the linearized version of the above non-linear differential equation reduces to.g ( ) lThe above equation is a second order, constant-coefficient differential equation. In orderto use MATLAB to solve it, we have to reduce it to two first order differential equationsas MATLAB uses a Runge-kutta method to solve differential equations, which isapplicable only for first order differential equations.Let y (1). y (2)
22When the values of ‘theta’ and the first derivative of ‘theta’ are substituted in the secondorder linearized differential equation, we get the following two first order differentialequation:.y (1) y (2).y (2) ( g / l ) y (1)For a nonlinear system,sin The second order non-linear differential equation reduces to the following, two first orderdifferential equation:.y (1) y (2).y (2) ( g / l ) sin( y (1))MATLAB CodeThe MATLAB code is written following the procedure adopted to solve the spring-massdamper system. For the linear case the function file is saved as ‘linear.m’.function yp linear(t,y)yp [y(2);((-g/l) *(y(1)))];In this example, the value of ‘l’ is chosen to be 5 cms. So the value of ‘g/l’ turns out to be–196.2 per square second. Note that since the mass and the length are expressed in gramsand centimeters respectively, the value of the acceleration due to gravity ‘g’ is taken to be981 cms per square second. Substitute this value in the above MATLAB code.For the nonlinear case, open a new M-file to write a separate function file for thenonlinear differential equation. In this case the function file is saved as ‘nonlinear.m’.function yp nonlinear(t,y)yp [y(2);((-g/l) *sin(y(1)))];The main code should be written in a separate M-file, which will actually call the abovefunction files, solve the derivatives stored in them and plot the required result.tspan [0 5];y0 [1.57;0];[t,y] ode45('linear',tspan,y0)
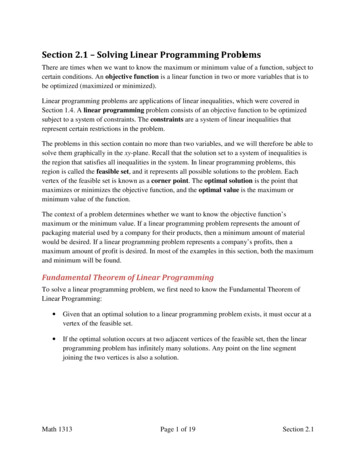
23plot(t,y(:,1))grid heta Vs Time’)hold on;‘tspan’ represents the time interval and ‘y0’ represents the initial condition. Note that thevalue of in the initial conditions must be expressed in radians.Now run the code for the linearized version of the simple pendulum. A plot of ‘theta’versus ‘time’ will be obtained. The ‘hold’ command in the code freezes the plot obtained.This command is used so that the nonlinear version can also be plotted in the same graph.After running the program for the linear version, change the name of the function in thethird line of the main code from ‘linear’ to ‘nonlinear’. By doing this, the Ode45command will now solve the nonlinear differential equations and plot the result in thesame graph. To differentiate between the linear and the non-linear curve, use a differentline style.The plots of the responses are attached. From the plots we can see that the time period forthe non linear equation is greater than that of the linear equation.To plot the angular velocity with respect to ‘time’ change the variable in the plotcommand line in the main code from ‘y(:,1)’ to ‘y(:,2)’. This is done because initially weassigned y(1) to ‘theta’ and y(2) to the first derivative of ‘theta’.
24
25Assignmenta) Compute and plot the response of a simple pendulum with viscous damping whoseequation of motion is given by.ml 2 c mgl 0Compute the value of the damping coefficients for 0.1.The initial conditions are. (0) {15 , 30 , 45 , 60 , 90 } and (0) 0 . M 10 g ; l 5 cms.b) Compare the generated plot with Non-linear plot for each value of (0).What do you infer from the plots obtained?c) Plot the natural frequency of the nonlinear solution versus initial condition (0).(Note: Plot the linear and the nonlinear curve in the same plot. Remember to convert theinitial values of theta given in degrees, to radians.)Also make sure that the difference between the linear and the non-linear responses can beclearly seen from the plot. If necessary use the zoom feature in order to show thedifference.
263. Coulomb FrictionExample.Solve the following differential equation for 0 . 22g (1 sin ) cos [cos (1 ) sin ]ddddl. d {0, 0.1,0.2}; l 0.25m . (0) 0; (0) 0SolutionAs explained earlier, to solve the above differential equation by MATLAB, reduce it intotwo first order differential equations.Let y (1). y (2)The above equation reduces to.y (1) y (2).y (2) g12{cos( y (1))[1 d ] d sin( y (1))} { d cos( y (1))( y (2) 2)}l (1 d sin( y (1)))l (1 d sin( y (1)))MATLAB CodeA M-file must be written to store the derivatives. In this case the file is saved as‘coulomb.m’.function yp coulomb(t,y)g 9.81;mu 0;l 0.25;k1 1 mu*sin(y(1));k2 mu*cos(y(1))*(y(2) 2);k3 cos(y(1))*(1-mu 2);k4 mu*sin(y(1));yp [y(2);((g/l)*((k3-k4)/k1)-(k2/k1))]
27Type the following code in a new M-file.tspan [0 2]y0 [0;0][t,y] ‘Time’)ylabel(‘Theta’)title(‘Theta Vs Time’)hold on;This main file calls the function ‘coulomb.m ’ to solve the differential equations. ‘Tspan’represents the time interval and ‘y0’ represents the initial condition vector. To plot theresults for different values of , change the value of in the function file, save it and thenrun the main code.The vector ‘y(:,1)’ represents the values of theta at the various time instants and thevector ‘y(:,2)’ gives the values of the angular velocities. To plot the angular velocity,change the variable in the plot command line in the main code from ‘y (:,1)’ to ‘y(:,2)’.Also plot the angular velocity with respect to theta.The plots are attached. From the plots it can be seen that by increasing the value of thecoulomb damping constant the system takes more time to reach value of the angular velocity also decreases. 2and the maximum
28
29Assignment.Solve the following differential equation for 0 . 22g (1 sin ) cos [cos (1 ) sin ]ddddl. d {0, 0.05,0.1,0.15,0.2}; l 0.5m . (0) / 2; (0) 0a) Plot the maximum value of angular velocity and maximum value of theta with respectto .b) Is the differential equation valid for 0 . If not, what is the correct equation?c) Analytically confirm the angular velocity predictions for 0.0 and 0.2.d) Comment on the results obtained.
304. Trajectory Motion with Aerodynamic DragExampleSolve the following differential equations for c d {0.1, 0.3,0.5} N/m.m x c d x( x 2 y 2 ) (1 / 2 ) 0m y c d y ( x 2 y 2 ) (1 / 2) w.m 10 kg. x(0) 100 m/s; y (0) 10 m/s; x(0) 0; y(0) 0.SolutionAs explained earlier, to solve the above two differential equations, we have to reduceeach of them into two first order differential equations.So Letx y (1).x y (2)y y (3).y y (4)The above equations reduce to the following first order differential equations.y (1) y (2)1y (2) ( cd ) * y (2) * [ y (2) 2 y (4) 2 ] 2m.y (3) y (4) wy (4) () ( cd ) * y (4) * [ y (2) 2 y (4) 2 ] 2mm.1
31MATLAB CodeType the following code in a separate m-file. As mentioned earlier, the systemderivatives must be written in a separate m-file. Since the name of the function is‘airdrag’, save the m-file as ‘airdrag.m’ in the current directory.function yp airdrag(t,y)m 10;cd 0.2;g 9.81;w m*g;yp zeros(4,1);yp(1) y(2);yp(2) ((-cd/m)*y(2)*(y(2) 2 y(4) 2) (0.5));yp(3) y(4);yp(4) ((-w/m)-(cd/m)*y(4)*(y(2) 2 y(4) 2) (0.5));Open a new m-file and type the following code for the main program. This program callsthe function ‘airdrag.m’ in order to solve the differential equations. Again ‘tspan’represents the time interval and ‘y0’ represents the initial condition vector. The plots haveto be drawn between the displacement in the x direction and the displacement in the ydirection. Refer to the handout ‘Introduction to MATLAB’ for the explanation aboutusing the ‘hold’ command with the help of a ‘counter’ variable.tspan [0 5];y0 [0;100;0;10][t,y] t’)title(‘X vs Y Displacement’)hold on;It can be seen from the plots that as the coefficient of the aerodynamic drag is increasedthe maximum value of the displacement in the y direction decreases. The value of thedisplacement in the x direction, for which the displacement in the y direction ismaximum, also decreases. Here the plots have been zoomed to the current version so thatthe difference in the curves could be seen clearly.
32
33AssignmentSolve the following differential equations for c d {0.0, 0.1,0.2,0.3} N/m.m x c d x( x 2 y 2 ) (1 / 2 ) 0m y c d y ( x 2 y 2 ) (1 / 2) w.m 5 kg. x(0) 10 m/s; y (0) 200 m/s; x(0) 0; y(0) 0.a) Plot separately the maximum range and the maximum elevation with respect thedamping coefficient, Cd.b) Analytically confirm the results for Cd 0.c) Comment on the results obtained.
345. Pendulum with Aerodynamic and Viscous DampingExampleSolve the following non-linear differential equation with aerodynamic damping.C .2g sin a sgn( ) 0(1)lmland compare it with the following linearized differential equation with viscous damping.g cd 0(2)ml.m 10 g; l 5 cms; Ca Cd 14 ; (0) 1.57; (0) 0.(Note: The initial value of theta is given in radians.)SolutionAs mentioned earlier, to solve the above differential equations, convert them into twofirst order differential equations.Let y (1). y (2)Equation (2) becomes.y (1) y (2).gy (2) ( ) * ( y (1)) ( cd ) * ( y (2))lm(3)(4)Similarly equation (1) becomes.y (1) y (2)(5).gy (2) ( ) * sin( y (1)) ( cd ) * ( y (2) 2) sgn( y (2))lml(6)MATLAB CodeIn this example, we are required to solve two separate problems, i.e., a pendulum withaerodynamic drag and a pendulum with viscous damping. So, we have to write twoseparate M-files, ‘pendulum1.m’, which contains the derivatives of the problem withaerodynamic drag and ‘pendulum2.m’, which contains the derivatives of the problemwith viscous damping.
35Open a new m-file and type the following code which contains equations (5) and (6).Note that the derivatives are represented
6 Solve Command The 'solve' command is a predefined function in MATLAB.The code for solving the above equations using the 'solve' command is as shown.Open a new M-File and type the following code. % To solve the linear equations using the solve command