Transcription
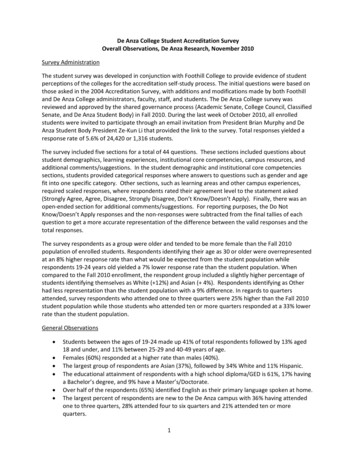
De Anza College Student Accreditation SurveyOverall Observations, De Anza Research, November 2010Survey AdministrationThe student survey was developed in conjunction with Foothill College to provide evidence of studentperceptions of the colleges for the accreditation self-study process. The initial questions were based onthose asked in the 2004 Accreditation Survey, with additions and modifications made by both Foothilland De Anza College administrators, faculty, staff, and students. The De Anza College survey wasreviewed and approved by the shared governance process (Academic Senate, College Council, ClassifiedSenate, and De Anza Student Body) in Fall 2010. During the last week of October 2010, all enrolledstudents were invited to participate through an email invitation from President Brian Murphy and DeAnza Student Body President Ze-Kun Li that provided the link to the survey. Total responses yielded aresponse rate of 5.6% of 24,420 or 1,316 students.The survey included five sections for a total of 44 questions. These sections included questions aboutstudent demographics, learning experiences, institutional core competencies, campus resources, andadditional comments/suggestions. In the student demographic and institutional core competenciessections, students provided categorical responses where answers to questions such as gender and agefit into one specific category. Other sections, such as learning areas and other campus experiences,required scaled responses, where respondents rated their agreement level to the statement asked(Strongly Agree, Agree, Disagree, Strongly Disagree, Don’t Know/Doesn’t Apply). Finally, there was anopen-ended section for additional comments/suggestions. For reporting purposes, the Do NotKnow/Doesn’t Apply responses and the non-responses were subtracted from the final tallies of eachquestion to get a more accurate representation of the difference between the valid responses and thetotal responses.The survey respondents as a group were older and tended to be more female than the Fall 2010population of enrolled students. Respondents identifying their age as 30 or older were overrepresentedat an 8% higher response rate than what would be expected from the student population whilerespondents 19-24 years old yielded a 7% lower response rate than the student population. Whencompared to the Fall 2010 enrollment, the respondent group included a slightly higher percentage ofstudents identifying themselves as White ( 12%) and Asian ( 4%). Respondents identifying as Otherhad less representation than the student population with a 9% difference. In regards to quartersattended, survey respondents who attended one to three quarters were 25% higher than the Fall 2010student population while those students who attended ten or more quarters responded at a 33% lowerrate than the student population.General Observations Students between the ages of 19-24 made up 41% of total respondents followed by 13% aged18 and under, and 11% between 25-29 and 40-49 years of age.Females (60%) responded at a higher rate than males (40%).The largest group of respondents are Asian (37%), followed by 34% White and 11% Hispanic.The educational attainment of respondents with a high school diploma/GED is 61%, 17% havinga Bachelor’s degree, and 9% have a Master’s/Doctorate.Over half of the respondents (65%) identified English as their primary language spoken at home.The largest percent of respondents are new to the De Anza campus with 36% having attendedone to three quarters, 28% attended four to six quarters and 21% attended ten or morequarters.1
Almost half of the students (45%) reported that they are familiar with De Anza’s institutionalcore competencies; this question is new to this year’s survey.“Knowledge related to my academic field of interest” received the highest mean score rating inthe learning section, while “using library resources for a research project” received the lowestmean score in that section.“Computer access” and “access for students with disabilities” received the highest mean scoreratings in the resources section, while “parking” received the lowest mean score in that section.Students were asked to rate their agreement to whether or not De Anza College had improvedtheir knowledge, skills, and abilities in each learning area.De Anza Student Accreditation Survey Learning Section -- Agree and Strongly AgreeWritingValue different ways of seeing/doingUnderstanding people from different culturesProblem solvingSense of responsibility beyond selfCritical thinkingKnowledge in academic fieldLearning on my ownWorking in a group or teamPublic speakingReadingCreativity and artistic expressionMathematical skillsBasic computer skillsLibrary resources/research projects0%10%20%230%40%50%60%70%80%90%100%
Students were asked to rate their agreement to whether or not De Anza College had providedresources that met their needs as a student in the listed areas.De Anza Student Accreditation Survey Resources Section -- Agree and Strongly AgreeAccess for students with disabilitesSafe/secure campusHealth servicesComputer accessBookstoreLibrary endly campusLaboratory equipmentPlaces to studyTutoringFood servicesClean campusPublic transportationStudent activites/campus lifeProviding services and instruction onlineHelp in selecting classes and developing an educational planHelp in registering for classesHelp in getting financial assistance to pay for collegeParking0%10%20%30%40%50%60%70%80%90% 100%Comparisons between the 2004 and 2010 Accreditation Surveys The 2004 survey resulted in 1,200 student respondents compared to 1,316 in the 2010 survey.At least 70% or more of students participating in either the 2004 or 2010 survey agree orstrongly agree with all items in the learning experiences section, indicating that studentsbelieved that De Anza had improved their knowledge, skills, and abilities in these learning areas.In the 2004 survey, the strongest positive response rates in the learning experiences section(91%) was for improving “writing” and “knowledge related to my academic field of interest,”while the strongest positive response rate in the 2010 survey was for improving “writing” (92%).The lowest positive response rates in the learning experiences section among 2004 surveyparticipants was 71% for “using library resources for a research project” and “basic computerskills,” while in 2010 it was for “using library resources for a research project” (77%).In the resources section, 94% of respondents in 2004 and 2010 agree or strongly agree thatthere is “access for students with disabilities.”Other strong positive response rates in the resources section of the 2010 survey were for“computer access,” “bookstore,” “safe and secure campus,” and “health services” (91%), whichgenerally demonstrated an increase (from 1% for “safe and secure campus” to 11% for“bookstore”) in agreement from the 2004 survey.According to the 2004 survey results, only 46% of students believed “parking” had met theirneeds while 62% agreed or strongly agreed with this statement in the 2010 survey.3
De Anza Student Accreditation Survey TablesNote: There were 1,316 respondents to the survey - tables listedhere only given valid, non-missing responses on each question.Table 1. Age GroupsAge GroupN%18 or younger16413%19 to 2452941%25 to 2913811%30 to 341088%35 to 39846%40 to 4913811%50 to 59967%60 or 72100%TotalTable 2. GenderTotalE. Kuo and M. Newell
Table 3. 3%Hispanic14811%Native American101%Pacific Islander121%White43434%Other705%Decline to State756%1,294100%Highest DegreeN%No High School Degree554%HS/HS Equivalent79461%Associate's Degree1088%Bachelor's ble 4. Highest Degree EarnedTotalE. Kuo and M. Newell
Table 5. English is Primary Language Spoken at HomeEnglish is Primary Language at HomeN%No45035%Yes83865%1,288100%N%One to Three47536%Four to Six36028%Seven to Nine20215%Ten or More26821%1,305100%TotalTable 6. Number of Quarters Attending De AnzaNumber of QuartersTotalTable 7. Summary of Responses to Learning Outcomes ItemNote: Students were asked whether they were familiar withDe Anza's Institutional Core Competencies.Familiar with De Anza'sInstitutional Core CompetenciesN%No70655%Yes56745%1,273100%TotalE. Kuo and M. Newell
Table 8. Summary of Responses to Learning Experiences ItemsNote: Students were asked to rate their agreement to whether or not De Anza had improvedtheir knowledge, skills, and abilities in each area.Note 2: Mean scores are calculated on SA 4, A 3, D 2, SD 1 scale.Note 3: Mean scores are calculated using Valid Ns.Note 4: Items are ranked by their mean scores.# Learning Experience Item10.Knowledge related to myacademic field of interest2. WritingValidNMean StronglyScore Disagree DisagreeAgreeDo Not KnowStrongly Does Not 30813.Understanding people fromdifferent cultures1,0883.283%7%50%40%18614.Value different ways ofseeing and doing1,0843.252%7%54%37%40215.Sense of responsibilitybeyond self1,0633.253%8%51%39%2098. Critical thinking1,1043.242%8%54%36%1713. Public speaking8763.233%10%49%39%4007. Learning on my own1,1503.223%9%52%36%1259. Problem 653.163%13%49%35%4051,0683.163%10%56%32%2044. Mathematical skills8343.056%14%51%30%43412. Basic computer skills8583.045%16%48%31%4018862.995%18%50%27%3831. Reading5.Creativity and artisticexpression6. Working in a group or team11.Using library resources for aresearch projectTotal 1,316E. Kuo and M. Newell
Table 9A. Summary of Responses to Resources ItemsNote: Students were asked to rate their agreement to whether or not De Anza had providedresources that met their needs as a student in the listed areas.Note 2: Mean scores are calculated on SA 4, A 3, D 2, SD 1 scale.Note 3: Mean scores are calculated using Valid Ns.Note 4: Items are ranked by their mean scores.# Resource ItemValidN1. Computer access1,1123.352%7%45%46%1707303.333%3%53%41%5397. Safe and secure campus1,2143.252%7%55%36%653. Bookstore1,2223.243%7%55%36%6011. Health services7713.233%6%56%35%49313. Laboratory 7Library materials andresources9663.213%7%56%34%304Sustainable and6. 268153.185%10%48%37%4502. Food services1,0783.165%11%50%35%2015. Clean s for students withdisabilities14. Places to study12.15. Tutoring9. Public transportation4.Student activities & campuslife19.Providing services andinstruction onlineMean StronglyScore Disagree DisagreeDo Not KnowStrongly Does Not ApplyAgreeNAgreeTotal 1,316E. Kuo and M. Newell
Table 9B. Summary of Responses to Resources Items, ContinuedNote: Students were asked to rate their agreement to whether or not De Anza had providedresources that met their needs as a student in the listed areas.Note 2: Mean scores are calculated on SA 4, A 3, D 2, SD 1 scale.Note 3: Mean scores are calculated using Valid Ns.Note 4: Items are ranked by their mean scores.ValidN# Resource ItemHelp in selecting classes18. and developing aneducational plan17.Help in getting financialassistance to pay for college16.Help in registering forclasses8. ParkingMean StronglyScore Disagree DisagreeAgreeDo Not KnowStrongly Does Not 115Total 1,316E. Kuo and M. Newell
De Anza Accreditation Survey Comparison Tables--Student SurveyNote: Percentages may not add up to 100 due to rounding.Table 1. Comparison of 2004 and 2010 Student Survey Respondentsby Age Group2004Age Group2010N%N%18 or younger21318%16413%19 to 2459550%52941%25 to 2914512%13811%30-3912310%19215%40-49676%13811%50 or older494%14311%1,192100%1,304100%TotalTable 2. Comparison of 2004 and 2010 Student Survey Respondentsby 7%50640%1,174100%1,272100%TotalE. Kuo
Table 3. Comparison of 2004 and 2010 Student Survey Respondentsby ve American91%101%Pacific ine to State615%756%1,180100%1,294100%TotalTable 4. Comparison of 2004 and 2010 Student Survey Respondentsby Highest Degree Earned20042010Highest DegreeN%N%No High School Degree373%554%HS/HS Equivalent90576%79461%Associate's Degree928%1088%Bachelor's 0%1,298100%TotalE. Kuo
Table 5. Comparison of 2004 and 2010 Student Survey Respondentsby Number of Quarters2004Number of Quarters2010N%N%One to Three50042%47536%Four to Six33028%36028%Seven to Nine17114%20215%Ten or More17915%26821%1,180100%1,305100%TotalE. Kuo
Table 6. Comparison of 2004 and 2010 Student Survey 3%49%34%35%Disagree20042010Learning Experience ItemValid N2004 20101. Reading9569172%3%9%2. Writing9929711%3%3. Public speaking8618762%4. Mathematical skills8718345. Creativity and artistic expression8638656. Working in a group or team1,058 1,0682%3%10%10%60%56%28%32%7. Learning on my own1,084 3%1,039 %8%7%60%50%30%40%5%5%24%16%54%48%17%31%8. Problem solving9. Knowledge related to my academicfield of interest10. Using library resources for aresearch project11. Understanding people fromdifferent cultures12. Basic computer skills9998278861,039 1,088714858Note: Students were asked to rate their agreement to whether or not De Anza had improvedtheir knowledge, skills, and abilities in each area.E. Kuo
Table 7. Comparison of 2004 and 2010 Student Survey 8%15%61%52%17%28%Resource ItemValid N2004 20101. Computer access8681,1122%2. Food services9701,0781,119 1,2223. Bookstore4. Student activities and campus life8639315. Clean campus1,131 1,2453%5%15%11%63%54%19%31%6. Safe and secure campus1,085 1,2142%2%8%7%66%55%24%36%7. Parking1,088 1,17026%15%29%23%37%42%9%20%8. Public transportation6048067%5%20%12%61%52%12%31%15. Access for students withdisabilities5747301%3%5%3%64%53%30%41%10. Health services6527712%3%11%6%67%56%20%35%11. Library materials and resources8869662%3%10%7%66%56%23%34%12. Laboratory %28%38%13. Places to study1,038 1,10914. Tutoring6968154%5%12%10%57%48%27%37%15. Help in getting financial assistanceto pay for college67472610%11%21%20%46%40%24%28%16. Help in selecting classes anddeveloping an educational plan9629588%11%18%17%52%44%22%27%17. Providing services and e: Students were asked to rate their agreement to whether or not De Anza had providedresources that met their needs as a student in the listed areas.E. Kuo
De Anza Accreditation Survey Tables by Student DemographicsTable 1A. Agree and Strongly Agree Ratings in Learning Areas by Age GroupItemValidNReading736Writing798Public speaking659Mathematical skills671Creativity & artistic expression857Working in a group or team958Learning on my own1,137Critical thinking857Problem solving1,051Knowledge related to academic fieldof interest1,171Using library resources713Basic computer skills79818 and60 oryounger19-2425-2930-3435-3940-4950-59over(DNK N) (DNK N) (DNK N) (DNK N) (DNK N) (DNK N) (DNK N) (DNK 56%(31)38%(21)38%(20)E. Kuo and M. Newell
Table 1B. Agree and Strongly Agree Ratings in Learning Areas by Age Group, ContinuedItemUnderstanding people from otherculturesValue different ways of seeingand doingSense of responsibility beyond selfValidN18 and60 oryounger19-2425-2930-3435-3940-4950-59over(DNK N) (DNK N) (DNK N) (DNK N) (DNK N) (DNK N) (DNK N) (DNK 26)74%(11)68%(31)69%(22)55%(17)Table 2. Familiar with Institutional Learning Outcomes by Age GroupItemValidN18 andyounger19-2425-2930-3435-3940-4950-5960 6%45%51%45%41%49%E. Kuo and M. Newell
Table 3A. Agree and Strongly Agree Ratings in Resources by Age GroupItemValidNComputer access1,112Food services1,078Bookstore1,222Student activities & campus life931Clean campus1,245Sustainable & environmentally1,146friendly campusSafe & secure campus1,214Parking1,170Public transportation806Access for students with disabilities730Health services771Library materials & resources966Laboratory equipment758Places to studyTutoring1,10981518 and60 oryounger19-2425-2930-3435-3940-4950-59over(DNK N) (DNK N) (DNK N) (DNK N) (DNK N) (DNK N) (DNK N) (DNK 41%(68)64%(34)40%(68)E. Kuo and M. Newell
Table 3B. Agree and Strongly Agree Ratings in Resources by Age Group, ContinuedItemValidNHelp in registering for classes958Help in getting financial assistance726Help in selecting classes & developing aneducational plan958Providing services & instructiononline1,00918 and60 oryounger19-2425-2930-3435-3940-4950-59over(DNK N) (DNK N) (DNK N) (DNK N) (DNK N) (DNK N) (DNK N) (DNK (32)(40)55%(29)(24)62%(12)E. Kuo and M. Newell
Table 4. Agree and Strongly Agree Ratings in Learning Areas by GenderItemValidNReading736Writing798Public speaking659Mathematical skills671Creativity & artistic expression857Working in a group or team958Learning on my own1,137Critical thinking857Problem solving1,051Knowledge related to academic field of interest1,171Using library resources713Basic computer skills798Understanding people from other cultures968Value different ways of seeing & doingSense of responsibility beyond self1,054955Female(DNK N)Male(DNK 55%(154)57%(148)70%(80)77%(52)75%(69)75%(67)76%(81
Senate, and De Anza Student Body) in Fall 2010. During the last week of October 2010, all enrolled students were invited to participate through an email invitation from President Brian Murphy and De Anza Student Body President Ze-Kun Li that provided the link to the survey. Total respons