Transcription
D I S L I N 8.1A Data Plotting Extensionfor theProgramming LanguagePythonbyHelmut Michels
cHelmut Michels, Max-Planck-Institut für Aeronomie, Katlenburg-Lindau 1997 - 2003All rights reserved.
Contents12Overview1.1 Introduction . . . . . . . . . . . . . . . . . . . . . .1.2 DISLIN Features . . . . . . . . . . . . . . . . . . .1.3 Passing Parameters from Python to DISLIN Routines1.4 Quickplots . . . . . . . . . . . . . . . . . . . . . . .1.5 FTP Sites, DISLIN Home Page . . . . . . . . . . . .1.6 Reporting Bugs . . . . . . . . . . . . . . . . . . . .1112233Quickplots2.1 The PLOT Function . . . .2.2 The SCATTR Function . .2.3 The PLOT3 Function . . .2.4 The SURF3 Function . . .2.5 The SURFACE Function .2.6 The SURSHADE Function2.7 The CONTOUR Function .2.8 The CONSHADE Function2.9 Scaling of Quickplots . . .2.10 Quickplot Variables . . . 1212222.A Short Description of DISLIN RoutinesA.1 Initialization and Introductory RoutinesA.2 Termination and Parameter Resetting . .A.3 Plotting Text and Numbers . . . . . . .A.4 Fonts . . . . . . . . . . . . . . . . . .A.5 Symbols . . . . . . . . . . . . . . . . .A.6 Axis Systems . . . . . . . . . . . . . .A.7 Secondary Axes . . . . . . . . . . . . .A.8 Modification of Axes . . . . . . . . . .A.9 Axis System Titles . . . . . . . . . . .A.10 Plotting Data Points . . . . . . . . . . .A.11 Legends . . . . . . . . . . . . . . . . .A.12 Line Styles and Shading Patterns . . . .A.13 Cycles . . . . . . . . . . . . . . . . . .A.14 Base Transformations . . . . . . . . . .A.15 Shielding . . . . . . . . . . . . . . . .A.16 Parameter Requesting Routines . . . . .A.17 Elementary Plot Routines . . . . . . . .A.18 Conversion of Coordinates . . . . . . .A.19 Utility Routines . . . . . . . . . . . . .A.20 Date Routines . . . . . . . . . . . . . .A.21 Cursor Routines . . . . . . . . . . . . .i.
A.22A.23A.24A.25A.26A.27A.28A.29A.30A.31A.32Bar Graphs . . . . . . .Pie Charts . . . . . . . .Coloured 3-D Graphics .3-D Graphics . . . . . .Geographical ProjectionsContouring . . . . . . .Image Routines . . . . .Window Routines . . . .Widget Routines . . . .DISLIN Quickplots . . .MPAe Emblem . . . . .B ExamplesB.1 Demonstration of CURVE .B.2 Polar Plots . . . . . . . . . .B.3 Symbols . . . . . . . . . . .B.4 Logarithmic Scaling . . . . .B.5 Interpolation Methods . . . .B.6 Line Styles . . . . . . . . .B.7 Legends . . . . . . . . . . .B.8 Shading Patterns (AREAF) .B.9 Vectors . . . . . . . . . . .B.10 3-D Colour Plot . . . . . . .B.11 Surface Plot . . . . . . . . .B.12 Surface Plot . . . . . . . . .B.13 Contour Plot . . . . . . . . .B.14 Shaded Contour Plot . . . .B.15 Pie Charts . . . . . . . . . .B.16 World Coastlines and Lakes.ii. 23. 23. 24. 25. 26. 27. 27. 28. 28. 30. 30.31. . . . . . . . . . . . 32. . . . . . . . . . . . 34. . . . . . . . . . . . 36. . . . . . . . . . . . 38. . . . . . . . . . . . 40. . . . . . . . . . . . 42. . . . . . . . . . . . 44. . . . . . . . . . . . 46. . . . . . . . . . . . 48. . . . . . . . . . . . 50. . . . . . . . . . . . 52. . . . . . . . . . . . 54. . . . . . . . . . . . 56. . . . . . . . . . . . 59. . . . . . . . . . . . 62. . . . . . . . . . . . 64
Chapter 1Overview1.1 IntroductionThis manual describes a data plotting extension for the interpreted, object-oriented programming language Python. The plotting extension is based on the data plotting library DISLIN that is available forseveral C, Fortran 77 and Fortran 90 compilers.DISLIN is a high-level plotting library that contains subroutines and functions for displaying data graphicallly as curves, bar graphs, pie charts, 3-D colour plots, surfaces, contours and maps. The librarycontains about 400 plotting and parameter setting routines which are now available from Python. Somequickplots are also added to the DISLIN module for displaying curves, surfaces and contours with onecommand.1.2 DISLIN FeaturesThe following features are supported by DISLIN:- Several output formats can be selected such as X11, PostScript, PDF, CGM, Prescribe, TIFF andHPGL.- 9 software fonts are available where each font provides 6 alphabets and special european characters. Hardware fonts for PostScript printers and X11 and Windows displays can also be used.- Plotting of two- and three-dimensional axis systems. Axes can be linearly or logarithmically scaledand labeled with linear, logarithmic, date, time, map and user-defined formats.- Plotting of curves. Several curves can appear in one axis system and can be differentiated bycolour, line style and pattern. Multiple axis systems can be displayed on one page.- Plotting of legends.- Elementary plot routines for lines, vectors and outlined or filled regions such as rectangles, circles,arcs, ellipses and polygons.- Shielded regions can be defined.- Business graphics.- 3-D colour graphics.- 3-D graphics.- Elementary image routines.1
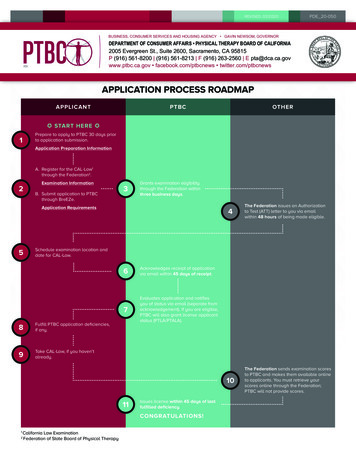
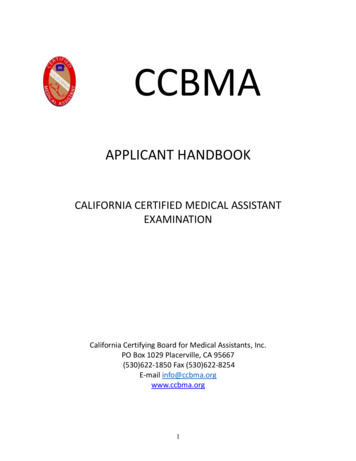
- Geographical projections and plotting of maps.- Contouring.- A PostScript manual of DISLIN is available.1.3 Passing Parameters from Python to DISLIN RoutinesThe passing of parameters from Python to DISLIN routines is not so strict as in other programminglanguages. The following rules are applied:- Parameters can be passed from Python to DISLIN routines as variables, constants and expressions.- String constants must be enclosed in a pair of either apostrophes or quotation marks.- Floatingpoint parameters can be passed from Python as integer and floatingpoint numbers.- Integer parameters can be passed from Python as integer and floatingpoint numbers. If a floatingpoint number is passed for an integer parameter, the fractional part of the floatingpoint numberwill be truncated.- Floatingpoint arrays can be passed from Python as floatingpoint and integer lists. They were copiedto 32 bit C arrays before they are passed to DISLIN routines.- Integer arrays must be passed as integer lists.- Memory must be allocated for Arrays that are used from DISLIN routines as output parameters.For example, they can be created with the Python command ’range’.Note:Normally, the number and meaning of parameters passed to DISLIN routines areidentical with the syntax description of the routines in the DISLIN manual. DISLINroutines that return one ore more scalars are implemented for Python as functionsthat return a tuple of scalars. For example, the statement ’nw,nh getpag ()’ returnsthe page size.1.4 QuickplotsSome quickplots are added to the DISLIN module which are collections of DISLIN routines for displaying data with one command. For example, the function ’plot’ displays two-dimensional curves.Example:from Numeric import *from dislin import *x arange (100, typecode Float32)plot (x, sin (x/5))If NumPy is not installed, you can use the statements:from math import *from dislin import *x range (100)y range (100)for i in range (0, 100) :v y[i] / 5.y[i] sin (v)plot (x, y)2
Figure 2.1: Example of the plot Function1.5 FTP Sites, DISLIN Home PageThe DISLIN software is available via ftp anonymous from the following x1.mpae.gwdg.de/pub/dislinThe DISLIN Home Page is:http://www.dislin.deThe Python Home Page is:http://www.python.org1.6 Reporting BugsDISLIN is well tested by many users and should be very bug free. However, no software is perfect. Ifyou have any problems with DISLIN, contact the author:Helmut MichelsMax-Planck-Institut fuer AeronomieD-37191 Katlenburg-Lindau, Max-Planck-Str. 2, GermanyE-Mail: michels@linmpi.mpg.deTel.: 49 5556 979 334Fax: 49 5556 979 2403
4
Chapter 2QuickplotsThis chapter presents quickplots that are collections of DISLIN routines to display data with one command.The following rules are applied to quickplots:- Quickplots call DISINI automatically if it is not called before. METAFL (’XWIN’) will be usedin quickplots if METAFL is not used before.- On window terminals, there are no calls to ENDGRF and DISFIN in quickplots, they let DISLINin level 2 or 3. If the variable ERASE is set to 0, following quickplots will overwrite the graphicswindow without erasing the window.2.1 The PLOT FunctionThe function ’plot’ makes a quickplot of two floatingpoint arrays.The call is:plot (xray, yray)xray, yrayare floatingpoint arrays.Example:from math import *from dislin import *x range (100)y range (100)for i in range (0, 100) :v y[i] / 5.y[i] sin (v)plot (x, y)2.2 The SCATTR FunctionThe function ’scattr’ makes a quickplot of two floatingpoint arrays where the points are marked withsymbols.The call is:scattr (xray, yray)xray, yrayare floatingpoint arrays.5
2.3 The PLOT3 FunctionThe function ’plot3’ makes a 3-D colour plot.The call is:plot3 (xray, yray, zray)xray, yray, zrayare floatingpoint arrays containing X-, Y- and Z-coordinates.2.4 The SURF3 FunctionThe function ’surf3’ makes a 3-D colour plot of a matrix. The columns of the matrix will be plotted asrows.The call is:surf3 (zmat ,xray, yray)zmatis a two-dimensional floatingpoint array with nx rows and ny columns.xrayis a floatingpoint array with the dimension nx. It will be used to position the rows ofzmat.yrayis a floatingpoint array with the dimension ny. It will be used to position the columnsof zmat.2.5 The SURFACE FunctionThe function ’surface’ makes a surface plot of a matrix.The call is:surface (zmat, xray, yray)zmatis a two-dimensional floatingpoint array with nx rows and ny columns.xrayis a floatingpoint array with the dimension nx. It will be used to position the rows ofzmat.yrayis a floatingpoint array with the dimension ny. It will be used to position the columnsof zmat.2.6 The SURSHADE FunctionThe function ’surshade’ makes a shaded surface plot of a matrix.The call is:surshade (zmat, xray, yray)zmatis a two-dimensional floatingpoint array with nx rows and ny columns.xrayis a floatingpoint array with the dimension nx. It will be used to position the rows ofzmat.yrayis a floatingpoint array with the dimension ny. It will be used to position the columnsof zmat.2.7 The CONTOUR FunctionThe function ’contour’ makes a contour plot of a matrix.The call is:contour (zmat, xray, yray [,zlvray])zmatis a two-dimensional floatingpoint array with nx rows and ny columns.6
xrayis a floatingpoint array with the dimension nx. It will be used to position the rows ofzmat.yrayis a floatingpoint array with the dimension ny. It will be used to position the columnsof zmat.zlvrayis a floatingpoint array containing the levels. If zlvray is missing, 10 levels betweenthe minimum and maximum of zmat will be generated.2.8 The CONSHADE FunctionThe function ’conshade’ makes a shaded contour plot of a matrix.The call is:conshade (zmat, xray, yray [,zlvray])zmatis a two-dimensional floatingpoint array with nx rows and ny columns.xrayis a floatingpoint array with the dimension nx. It will be used to position the rows ofzmat.yrayis a floatingpoint array with the dimension ny. It will be used to position the columnsof zmat.zlvrayis a floatingpoint array containing the levels. If zlvray is missing, 10 levels betweenthe minimum and maximum of zmat will be generated.2.9 Scaling of QuickplotsNormally, quickplots are scaled automatically in the range of the data. This behaviour can be changed ifcertain variables are defined.The variables for the X-axis are:a)If the variables XMIN and XMAX are defined, the X-axis will be scaled automatically in the range XMIN, XMAX.b)If the variables XMIN, XMAX, XOR and XSTEP are defined, the scaling and labeling of the X-axis is completly defined by the user.c)If the variable XAUTO is defined and set to 1, the variables XMIN, XMAX, XORand XSTEP will be ignored and scaling will be done automatically in the range ofthe data.Analog:Y-axis, Z-axis.Notes:- For logarithmic scaling, the parameters must be exponents of base 10.- Scaling variables can be defined with the function ’setvar (cname, value)’ wherecname is a string containing the name of the variable and value a numeric value.Example:from Numeric import *from dislin import *setvar (’YMIN’, -0.8)setvar (’YMAX’, 0.8)x arange (100, typecode Float32)plot (x, sin(x/5))7
2.10 Quickplot VariablesThere is a set of variables that can modify the appearance of quickplots. They can be defined with thefunction setvar that has the syntax setvar (cname, value) where cname is a string containing the name ofthe variable and value is a numeric value or a string. The following table shows all quickplot variables.The corresponding DISLIN routines are given in parenthesis.Xdefines the X-axis title (NAME).Ydefines the Y-axis title (NAME).Zdefines the Z-axis title (NAME).T1defines line 1 of the axis system title (TITLIN).T2defines line 2 of the axis system title (TITLIN).T3defines line 3 of the axis system title (TITLIN).T4defines line 4 of the axis system title (TITLIN).XTICsets the number of ticks for the X-axis (TICKS).YTICsets the number of ticks for the Y-axis (TICKS).ZTICsets the number of ticks for the Z-axis (TICKS).XDIGsets the number of digits for the X-axis (DIGITS).YDIGsets the number of digits for the Y-axis (DIGITS).ZDIGsets the number of digits for the Z-axis (DIGITS).XSCLdefines the scaling of the X-axis (SCALE).YSCLdefines the scaling of the Y-axis (SCALE).ZSCLdefines the scaling of the Z-axis (SCALE).XLABdefines the labels of the X-axis (LABELS).YLABdefines the labels of the Y-axis (LABELS).ZLABdefines the labels of the Z-axis (LABELS).Hdefines the character size (HEIGHT).HNAMEdefines the size of axis titles (HNAME).HTITLEdefines the size of the axis sytem title (HTITLE).XPOSdefines the X-position of the axis system (AXSPOS).YPOSdefines the Y-position of the axis system (AXSPOS).XLENdefines the size of an axis system in X-direction (AXSLEN).YLENdefines the size of an axis system in Y-direction (AXSLEN).ZLENdefines the size of an axis system in Z-direction (AX3LEN).POLCRVdefines an interpolation method used by CURVE (POLCRV).INCMRKdefines line or symbol mode for CURVE (INCMRK).MARKERselctes a symbol for CURVE (MARKER).HSYMBLdefines the size of symbols (HSYMBL).8
XRESsets the width of points plotted by PLOT3 (SETRES).YRESsets the height of points plotted by PLOT3 (SETRES).X3VIEWsets the X-position of the viewpoint in absolut 3-D coordinates (VIEW3D).Y3VIEWsets the Y-position of the viewpoint in absolut 3-D coordinates (VIEW3D).Z3VIEWsets the Z-position of the viewpoint in absolut 3-D coordinates (VIEW3D).X3LENdefines the X-axis length of the 3-D box (AXIS3D).Y3LENdefines the Y-axis length of the 3-D box (AXIS3D).Z3LENdefines the Z-axis length of the 3-D box (AXIS3D).VTITLEdefines vertical shifting for the axis system title (VKYTIT).CONSHDselects an algorithm used for contour filling (SHDMOD).Note:The variables can also be used, to initalize plotting parameters in DISINI.Example:from Numeric import *from dislin import *setvar (’X’, ’X-axis’)setvar (’Y’, ’Y-axis’)xray arange (10, typecode Float32)plot (xray, xray)9
10
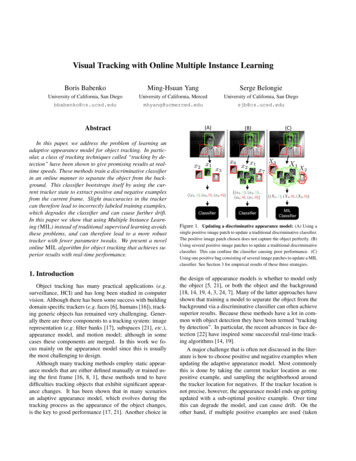
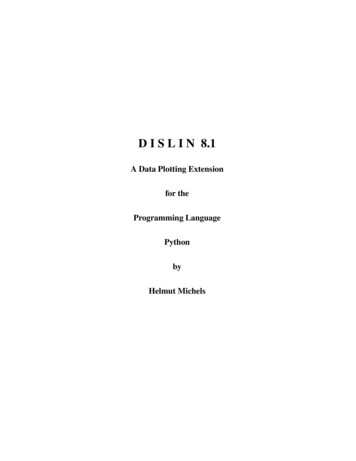
Appendix AShort Description of DISLIN RoutinesThis appendix presents a short description of all DISLIN routines that can be called from Python. Acomplete description of the routines can be found in the DISLIN manual or via the online help of DISLIN.For parameters, the following conventions are used:A.1-integer variables begin with the character N or I;-strings begin with the character C;-other variables are floatingpoint numbers;-one-dimensional arrays end with the keyword ’ray’, two-dimensional arrays with the keyword ’mat’.Initialization and Introductory RoutinesRoutinecgmbgd (xr, xg, xb)cgmpic (cstr)disini ()erase ()errdev (cdev)errfil (cfil)errmod (ckey, copt)filbox (nx, ny, nw, nh)hworig (nx, ny)hwpage (nw, nw)imgfmt (copt)incfil (cfil)metafl (cfmt)newpag ()origin (nx, ny)page (nw, nh)pagera ()pagfll (iclr)paghdr (c1, c2, iopt, idir)pagmod (copt)pagorg (copt)n pdfbuf (cbuf, nmax)Meaningdefines the background colour for CGM files.sets the picture ID for CGM files.initializes DISLIN.clears the screen.defines the error device.sets the name of the error file.modifies the printing of error messages.defines the position and size of included metafiles.defines the origin of the PostScript hardware page.defines the size of the PostScript hardware page.defines the format of image files.includes metafiles into a graphics.defines the plotfile format.creates a new page.defines the origin.sets the page size.plots a page border.fills the page with a colour.plots a page header.selects a page rotation.defines the origin of the page.copies a PDF file to a buffer. The memoryfor the buffer is allocated by pdfbuf.11
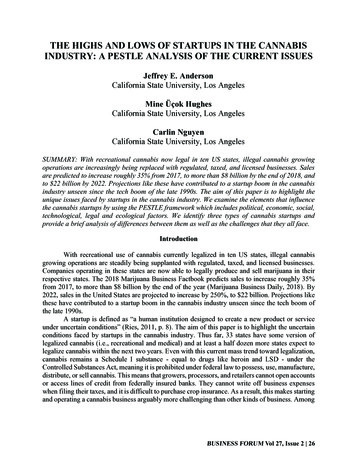
RoutineMeaningpdfmod (cmod, ckey)pngmod (cmod, ckey)sclfac (x)sclmod (copt)scrmod (copt)setfil (cfil)setpag (copt)setxid (id, copt)symfil (cdev, cstat)tifmod (n, cval, copt)unit (nu)units (copt)wmfmod (cmod, ckey)defines PDF options.enables transparency for PNG files.defines a scaling factor for the entire plot.defines a scaling mode.swaps back- and foreground colours.sets the plotfile name.selects a predefined page format.defines an external X Window or pixmap.sends a plotfile to a device.defines the physical resolution of TIFF files.defines the logical unit for messages.defines the plot units.modifies the format of WMF files.Figure A.1: Initialization and Introductory RoutinesA.2 Termination and Parameter ResettingRoutineMeaningdisfin ()endgrf ()reset (copt)terminates DISLIN.terminates an axis system and sets the level to 1.resets parameters to default values.Figure A.2: Termination and Parameter ResettingA.3 Plotting Text and NumbersRoutineangle (n)chaang (x)chaspc (x)chawth (x)fixspc (x)frmess (nfrm)height (n)messag (cstr, nx, ny)mixalf ()newmix ()n nlmess (cstr)number (x, ndig, nx, ny)numfmt (copt)Meaningdefines the character angle.defines an inclination angle for characters.affects character spacing.affects the width of characters.sets a constant character width.defines the thickness of text frames.defines the character height.plots text.enables control signs in character strings forplotting indices and exponents.defines an alternate set of control characters forplotting indices and exponents.returns the length of character strings in plotcoordinates.plots floating-point numbers.determines the format of numbers.12
Routinenumode (c1, c2, c3, c4)rlmess (cstr, x, y)rlnumb (x, ndig, xp, yp)setbas (xfac)setexp (xfac)setmix (char, cmix)texmod (cmode)texopt (copt, ctype)txtjus (copt)Meaningmodifies the appearance of numbers.plots text.plots numbers.determines the position of indices and exponents.sets the height of indices and exponents.defines global control signs for plotting indicesand exponents.enables TeX mode for plotting mathematical formulas.defines TeX options.defines the alignment of text and numbers.Figure A.3: Plotting Text and NumbersA.4FontsRoutinebasalf (calph)chacod (copt)complx ()duplx ()disalf ()eushft (cnat, char)gothic ()helve ()helves ()hwfont ()psfont (cfont)serif ()simplx ()smxalf (calph, c1, c2, n)triplx ()winfnt (cfont)x11fnt (cfont, copt)Meaningdefines the base alphabet.defines the character coding.sets a complex font.sets a double-stroke font.sets the default font.defines a shift character for European characters.sets a gothic font.sets a shaded font.sets a shaded font with small characters.sets a standard hardware font.sets a PostScript font.sets a complex shaded font.sets a single-stroke font.defines shift characters for alternate alphabets.sets a triple-stroke font.sets a TrueType font.sets an X11 font.Figure A.4: Fonts13
A.5 SymbolsRoutinehsymbl (n)mysymb (xray, yray, n, isym, iflag)rlsymb (nsym, x, y)symbol (nsym, nx, ny)symrot (xang)Meaningdefines the height of symbols.defines an user-defined symbol.plots symbols for user coordinates.plots symbols.defines a rotation angle for symbols.Figure A.5: SymbolsA.6 Axis SystemsRoutineaddlab (cstr, v, itic, cax)ax2grf ()ax3len (nxl, nyl, nzl)axsbgd (iclr)axslen (nxl, nyl)axsorg (nx, ny)axspos (nxp, nyp)axstyp (ctype)axgit ()box2d ()center ()cross ()endgrf ()frame (nfrm)frmclr (nclr)grace (ngrace)graf (xa, xe, xor, xstp,ya, ye, yor, ystp)graf3 (xa, xe, xor, xstp,ya, ye, yor, ystp,za, ze, zor, zstp)grdpol (nx, ny)grid (nx, ny)noclip ()nograf ()polar (xe, xor, xstp, yor, ystp)polmod (cpos, cdir)setgrf (c1, c2, c3, c4)Meaningplots additional single labels.suppresses the plotting of the upper X- and theleft Y-axis.defines axis lengths for a coloured 3-D axis system.defines the background colour.defines axis lengths for a 2-D axis system.determines the position of a crossed axis system.determines the position of axis systems.select rectangular or crossed axis systems.plots the lines X 0 and Y 0.plots a border around an axis system.centres axis systems.plots the lines X 0 and Y 0 and marks themwith ticks.terminates an axis system.defines the frame thickness of axis systems.defines the colour of frames.affects the clipping margin of axis systems.plots a two-dimensional axis system.plots an axis system for colour graphics.plots a polar grid.overlays a grid on an axis system.suppresses clipping of user coordinates.suppresses the plotting of an axis system.plots a polar axis system.modifies the appearance of polar labels.suppresses parts of an axis system.14
Routinesetscl (xray, n, cax)title ()xaxgit ()xcross ()yaxgit ()ycross ()Meaningsets automatic scaling.plots a title over an axis system.plots the line Y 0.plots the line Y 0 and marks it with ticks.plots the line X 0.plots the line X 0 and marks it with ticks.Figure A.6: Axis SystemsA.7Secondary AxesRoutinexaxis (xa, xe, xor, xstp,nl, cstr, it, nx, ny)xaxlg (xa, xe, xor, xstp,nl, cstr, it, nx, ny)yaxis (ya, ye, yor, ystp,nl, cstr, it, nx, ny)yaxlg (ya, ye, yor, ystp,nl, cstr, it, nx, ny)zaxis (za, ze, zor, zstp,nl, cstr, it, id, nx, ny)zaxlg (za, ze, zor, zstp,nl, cstr, it, id, nx, ny)Meaningplots a linear X-axis.plots a logarithmic X-axis.plots a linear Y-axis.plots a logarithmic Y-axis.plots a linearly scaled colour bar.plots a logarithmically scaled colour bar.Figure A.7: Secondary AxesA.8Modification of AxesRoutineaxclrs (nclr, copt, cax)axends (copt, cax)axsscl (copt, cax)hname (nh)intax ()labdig (ndig, cax)labdis (ndis, cax)labels (copt, cax)labjus (copt, cax)labmod (ckey, cval, cax)labpos (copt, cax)labtyp (copt, cax)logtic (copt)mylab (cstr, itic, cax)Meaningdefines colours for axis elements.suppresses certain labels.defines the axis scaling.defines the character height of axis names.defines integer numbering for all axes.sets the number of decimal places for labels.sets the distance between labels and ticks.selects labels.defines the alignment of axis labels.modifies date labels.determines the position of labels.defines vertical or horizontal labels.modifies the appearance of logarithmic ticks.sets user-defined labels.15
RoutineMeaningnamdis (ndis, cax)name (cstr, cax)namjus (copt, cax)noline (cax)rgtlab ()rvynam ()ticks (ntics, cax)ticlen (nmaj, nmin)ticmod (copt, cax)ticpos (copt, cax)timopt ()sets the distance between axis names and labels.defines axis titles.defines the alignment of axis titles.suppresses the plotting of axis lines.right-justifies labels.defines an angle for Y-axis names.sets the number of ticks.sets the length of ticks.modifies the plotting of ticks at calendar axes.determines the position of ticks.modifies time labels.Figure A.8: Modification of AxesA.9 Axis System TitlesRoutinehtitle (nh)lfttit ()linesp (xfac)titjus (copt)title ()titlin (cstr, ilin)titpos (copt)vkytit (nshift)Meaningdefines the character height of titles.left-justifies title lines.defines line spacing.defines the alignment of titles.plots axis system titles.defines text lines for titles.defines the position of titles.shifts titles in the vertical direction.Figure A.9: System TitlesA.10 Plotting Data PointsRoutinebars (xray, y1ray, y2ray, n)bars3d (xray, yray, z1ray, z2ray,xwray, ywray, icray, n)chnatt ()chncrv (copt)color (color)crvmat (zmat, n, m,ixpts, iypts)curve (xray, yray, n)curve3 (xray, yray, zray, n)curvx3 (xray, y, zray, n)curvy3 (x, yray, zray, n)Meaningplots a bar graph.plots 3-D bars.changes curve attributes.defines attributes changed automatically by CURVE.defines the colour used for text and lines.plots a coloured surface.plots curves.plots coloured rectangles.plots rows of coloured rectangles.plots columns of coloured rectangles.16
RoutineMeaningerrbar (xray, yray,e1ray, e2ray, n)field (x1ray, y1ray,x2ray, y2ray, n, ivec)gapcrv (xgap)inccrv (ncrv)incmrk (nmrk)marker (nsym)nochek ()piegrf (cbuf, nlin, xray, n)polcrv (copt)resatt ()setres (nx, ny)shdcrv (x1ray, y1ray, n1,x2ray, y2ray, n2)splmod (ngrad, npts)thkcrv (nthk)plots error bars.plots a vector field.defines gaps plotted by CURVE.defines the number of curves plotted with equalattributes.selects symbols or lines for CURVE.sets the symbols plotted by CURVE.suppresses listing of out of range data points.plots a pie chart.defines the interpolation method used by CURVE.resets curve attributes.sets the size of coloured rectangles.plots shaded areas between curves.modifies spline interpolation.defines the thickness of curves.Figure A.10: Plotting Data PointsA.11LegendsRoutineframe (nfrm)legend (cbuf, ncor)legini (cbuf, nlin, nmaxln)leglin (cbuf, cstr, ilin)iclr, ipat, ilin)legopt (xf1, xf2, xf3)legpat (ityp, ithk, isym,legpos (nxp, nyp)legtit (ctitle)linesp (xfac)mixleg ()nxl nxlegn (cbuf)nyl nylegn (cbuf)Meaningsets the frame thickness of legends.plots legends.initializes legends. cbuf is a dummy parameterfor Python. The text of legend lines is storedin an internal buffer.defines text for legend lines.modifies the appearance of legends.stores curve attributes.determines the position of legends.defines the legend title.affects line spacing.enables multiple text lines in legends.returns the width of legends in plot coordinates.returns the height of legends in plot coordinates.Figure A.11: Legends17
A.12 Line Styles and Shading PatternsRoutineMeaningchndot ()chndsh ()color (color)dash ()dashl ()dashm ()dot ()dotl ()lintyp (itype)linwid (nwidth)lncap (copt)lnjoin (copt)lnmlt (xfac)myline (nray, n)mypat (iangle, itype,idens, icross)penwid (nwidth)shdpat (ipat)solid ()sets a dotted-dashed line style.sets a dashed-dotted line style.sets a colour.sets a dashed line style.sets a long-dashed line style.sets a medium-dashed line style.sets a dotted line style.sets a long-dotted line style.defines a line style.sets the line width.sets the line cap parameter.sets the line join parameter.sets the miter limit parameter.sets a user-defined line style.defines a global shading pattern.sets the pen width.selects a shading pattern.sets a solid line style.Figure A.12: Line Styles and Shading PatternsA.13 CyclesRoutineclrcyc (index, iclr)lincyc (index, itype)patcyc (index, ipat)Meaningmodifies the colour cycle.modifies the line style cycle.modifies the pattern cycle.Figure A.13: CyclesA.14 Base TransformationsRoutineMeaningtrfres ()trfrot (xang, nx, ny)trfscl (xscl, yscl)trfshf (nx, ny)resets base transformations.affects the rotation of plot vectors.affects the scaling of plot vectors.affects the shifting of plot vectors.Figure A.14: Base Transformations18
A.15ShieldingRoutineshield (carea, cmode)shlcir (nx, ny, nr)shldel (id)shlell (nx, ny, na, nb, t)id shlind ()shlpie (nx, ny, nr, a, b)shlpol (nxray, nyray, n)shlrct (nx, ny, nw, nh, t)shlrec (nx, ny, nw, nh)shlres (n)shlvis (id, cmode)Meaningdefines automatic shielding.defines circles as shielded areas.deletes shielded areas.defines ellipses as shielded areas.returns the index of a shielded area.defines pie segments as shielded areas.defines polygons as shielded areas.defines rotated rectangles as shielded areas.defines rectangles as shielded areas.deletes shielded areas.enables or disables shielded areas.Figure A.15: ShieldingA.16Parameter Requesting RoutinesRoutinecalf getalf ()n getang ()nx,ny,nw,nh getclp ()n getclr ()nx,ny,nz getdig ()cdsp getdsp ()cfil getfil ()a,b,or,stp getgrf (cax)n gethgt ()xr,xg,xb getind (i)cx,cy,cz getlab ()nx,ny,nz getlen ()n getlev ()n getlin ()cmfl getmfl ()c getmix (copt)nx,ny getor ()nx,ny getpag ()n getpat ()n getplv ()nx,ny getpos ()nx,ny getran ()nx,ny getres ()xr,xb,xg getrgb ()nx,ny,nz getscl ()Meaningreturns the base alphabet.returns the current angle used for text and numbers.returns the curr
1.1 Introduction This manual describes a data plotting extension for the interpreted, object-oriented programming lan-guage Python. The plotting extension is based on the data plotting library DISLIN that is available for several C, Fortran 77 and Fortran 90 compilers.