Transcription
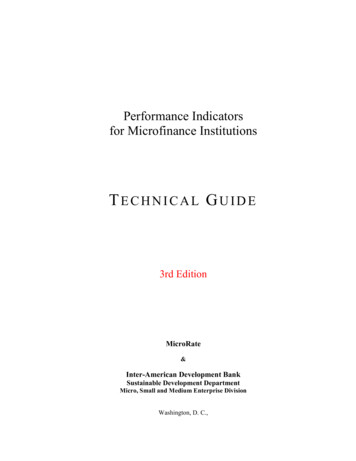
Performance Indicatorsfor Microfinance InstitutionsTECHNICAL GUIDE3rd EditionMicroRate&Inter-American Development BankSustainable Development DepartmentMicro, Small and Medium Enterprise DivisionWashington, D. C.,
Cataloging-in-Publication data provided by theInter-American Development BankFelipe Herrera LibraryPerformance indicators for microfinance institutions: technical guide3rd.p.cm.“prepared by Tor Jansson .[et al.]”—t.p verso.1. Financial institutions. 2. Economic indicators. 3. Microfinance. I. Jansson, Tor. II. Inter-AmericanDevelopment Bank. Sustainable Development Dept. Micro, Small and Medium Enterprise Division.332.2 P282—dc21This publication was prepared by Damian von Stauffenberg (MicroRate), Tor Jansson (InterAmerican Development Bank), Naomi Kenyon (MicroRate) and María-Cruz Barluenga-Badiola(Inter-American Development Bank). It can be downloaded electronically from the web-sites of theInter-American Development Bank (www.iadb.org/sds/mic) and MicroRate (www.microrate.com),where it will be continuously expanded and updated. Comments regarding the listed indicators (orproposals for additional ones) can be sent to the Inter-American Development Bank(mipyme@iadb.org or sds/msm@iadb.org) or MicroRate (info@microrate.com).The opinions expressed herein are those of the authors and do not necessarily represent the officialposition of the Inter-American Development Bank.July 2003Micro, Small and Medium Enterprise DivisionTeamSustainable Development DepartmentInter-American Development Bank1300 New York Avenue, N.W.Washington, D.C. 20577USAE-mail:Fax:mipyme@iadb.org or sds/msm@iadb.org202-623-2307International Data AnalysisRating Vice PresidencyMicroRate2107 Wilson Bvd, Suite 450Arlington, VA 22207USA
FOREWORDRecent years have seen a growing push for transparency in microfinance. An important aspect of thistrend has been the increasing use of financial and institutional indicators to measure the risk andperformance of microfinance institutions (MFIs). However, it is hard to achieve transparency if thereis no agreement on how indicators measuring financial condition, risk and performance should benamed and calculated. For example, does “return on equity” mean “return on initial equity” or “returnon average equity”? And how is equity defined, particularly if long-term subsidized loans arepresent? Should a 20-year subsidized loan from a development bank be considered debt or equity?The lack of universally understood indicators in microfinance led MicroRate, a rating agencyspecializing in microfinance, to invite the Inter-American Development Bank (IDB), the ConsultativeGroup to Assist the Poorest (CGAP), the United States Agency for International Development(USAID) and two other rating agencies –MCRIL and PlaNet Rating– to agree on the names anddefinitions of a set of commonly used indicators. It was not the intention of the group to select the“best” indicators or to try to interpret them, just to discuss names and definitions. The efforts by thisso-called “Roundtable Group,” led to publication of a list of 20 definitions of performance indicators.SEEP, a network of institutions involved in microfinance, provided valuable assistance incoordinating the final phase of this effort.The purpose of this technical guide is relatively narrow. It highlights 14 of the most commonly usedindicators published by the Roundtable Group and illustrates how they are used. It provides someexplanation and analysis of the indicators for those who are interested in understanding theirapplication as well as weaknesses. For each indicator, the Guide presents the proposed definition,interprets its meaning, identifies potential pitfalls in its use, and provides benchmark values for 32Latin American microfinance institutions compiled by MicroRate (the “MicroRate 32”). It should benoted, however, that these added sections are the work of MicroRate and the IDB, and do notnecessarily or automatically reflect the opinion or position of the other entities participating in theRoundtable discussions.Finally, it is important to point out what the Guide isn’t or doesn’t do. It isn’t intended to be acomplete “how-to” manual for appraising microfinance institutions. Such manuals, which describethe methodology for analyzing microfinance institutions, already exist. Further, it doesn’t discussfinancial adjustments, which are needed when comparing institutions with very distinct accountingpractices. Finally, it doesn’t represent any formal position or approval of MicroRate, MCRIL, PlaNetRating, CGAP, USAID or the IDB regarding the included indicators.Within its carefully defined purpose, we believe this guide will make an important contribution to thefield of microfinance.Damian von Stauffenberg, DirectorMicroRateAlvaro Ramirez, ChiefMicro, Small and Medium Enterprise Division, IDB
CONTENTSPUTTING THE INDICATORS INTO CONTEXTPortfolio Quality .1Efficiency and Productivity.2Financial Management .2Profitability.3PORTFOLIO QUALITYPortfolio at Risk .6Provision Expense Ratio .9Risk Coverage Ratio .11Write-Off Ratio .13EFFICIENCY AND PRODUCTIVITYOperating Expense Ratio .16Cost Per Borrower.18Personnel Productivity.20Loan Officer Productivity .22FINANCIAL MANAGEMENTFunding Expense Ratio .26Cost of Funds Ratio .28Debt/Equity Ratio.30PROFITABILITYReturn on Equity .34Return on Assets.37Portfolio Yield.39ANNEX I: CALCULATING THE RATIOS .41ANNEX II: THE MICRORATE 32.47
PUTTING THE INDICATORS INTO CONTEXTThe indicators presented in this Guide fall into one of four main categories: portfolio quality,efficiency and productivity, financial management and profitability. Of course, there are other aspectsthat throw light on the performance of microfinance institutions and, even within the four categorieslisted here, there are many different performance measures. However, the Guide does not set out to becomprehensive, it only presents the most important indicators that, taken together, provide areasonable overview of the performance, risk and financial condition of a microfinance institution.One area of analysis that has long suffered from a lack of indicators is management and governance,including organizational structure, performance measurement, enforcement practices, informationflows, microfinance know-how and ownership structure. While absolutely critical for determining theoverall risk and future potential of an institution, it is also an area that is hard to quantify.Considering that the efforts to develop meaningful indicators for management and governanceconditions are somewhat recent, this area has been omitted from this version of the Guide. Thisomission should not in any way be interpreted as recommendation to focus less on management andgovernance issues when assessing a microfinance institution. In fact, given the nonprofit status ororigin of many microfinance institutions, this should typically be a priority in any such assessment.It should also be stated up front that the Guide is using mainly unadjusted numbers; that is, thefinancial data are taken straight from the MFIs own financial statements. There is an obvious problemwith this approach since vast differences in accounting practices can make comparisons among MFIstricky. Provisioning policies, for instance, illustrate this. Among the MicroRate 32, provision reservesto cover possible loan losses range from the extremely conservative (for example Compartamos inMexico covers loans affected by arrears (over 30 days) nearly four times) to the inadequate. Thismeans that comparing MFIs at both ends of this spectrum would be like comparing apples withoranges. To overcome this problem, the Guide shows the adjusted return on equity and assets, i.e.what return on equity and return on assets would have been for each of the MicroRate 32 if thenumbers had been adjusted for differences in accounting policies and for subsidies. And adjustmentsdo matter. While none of the MicroRate 32 displayed a negative return on assets or equity in their2002 financial statements, half a dozen MFIs would in fact have showed losses had they all operatedunder an identical set of conservative rules and practices.In an attempt to be as specific and concrete as possible, the Guide also provides an annex where theindicators are calculated through. These calculations are based on a sample financial statement (FIE,Bolivia) and should help anyone who wants to start using the indicators in a practical setting. Asecond annex shows 12 performance indicators for each of the MicroRate 32 based on unadjustednumbers. It also lists two indicators with adjusted numbers (return on equity and return on assets).PORTFOLIO QUALITYPortfolio quality is a crucial area of analysis, since the largest source of risk for any financialinstitution resides in its loan portfolio. The loan portfolio is by far an MFI’s largest asset and, inaddition, the quality of that asset and therefore, the risk it poses for the institution can be quitedifficult to measure. For microfinance institutions, whose loans are typically not backed by bankablecollateral, the quality of the portfolio is absolutely crucial. Fortunately, many microfinanceinstitutions have learned how to maintain loan portfolios of very high quality. In fact, leadingmicrofinance institutions typically better at maintaining a higher portfolio quality than theircommercial bank peers in many countries.1
The most widely used measure of portfolio quality in the microfinance industry is Portfolio at Risk(PaR), which measures the portion of the loan portfolio “contaminated” by arrears as a percentage ofthe total portfolio. Although various other measures are regularly used, PaR has emerged as theindicator of choice. It is easily understandable, does not understate risk, and is comparable acrossinstitutions. A microenterprise loan is typically considered to be at risk if a payment on it is more than30 days late. This rule is much stricter than what is practiced among commercial banks, but it isjustified given the lack of bankable collateral in microfinance.In addition to the Portfolio at Risk indicator, this publication includes three other indicators related toportfolio quality and associated risks: Write-Offs, Provision Expenses and Risk Coverage.1EFFICIENCY AND PRODUCTIVITYEfficiency and productivity indicators are performance measures that show how well the institution isstreamlining its operations. Productivity indicators reflect the amount of output per unit of input,while efficiency indicators also take into account the cost of the inputs and/or the price of outputs.Since these indicators are not easily manipulated by management decisions, they are more readilycomparable across institutions than, say, profitability indicators such as return on equity and assets.On the other hand, productivity and efficiency measures are less comprehensive indicators ofperformance than those of profitability.Microfinance institutions have much lower rates of efficiency than commercial banks because on adollar per dollar basis microcredit is highly labor intensive: a hundred-dollar loan requires about asmuch administrative effort as a loan a thousand times larger. In an MFI, administrative costs may be 15, 20, or even 30 for each 100 in the loan portfolio, so the efficiency ratio is 15%, 20% or 30%,whereas in a commercial bank efficiency ratios of 1.5%, 2% or 3
“best” indicators or to try to interpret them, just to discuss names and definitions. The efforts by this so-called “Roundtable Group,” led to publication of a list of 20 definitions of performance indicators. SEEP, a network of institutions involved in microfinance, provided valuable assistance in coordinating the final phase of this effort. The purpose of this technical guide is .
