Transcription
An ISN PublicationHealth & SafetyPerformance IndicatorsContractor Performance Benchmarking by Contractor Operator,U.S. Oil & Gas, Construction & Facilities Management2015 DataPublication No. 1607ISN.comContractor Operators are large contractors managing subcontractor informationin ISNetworld.
2016 ISN Software Corporation. All rights reserved.Health & Safety Performance IndicatorsContractor Performance Benchmarking by Contractor Operator, U.S.Oil & Gas, Construction & Facilities Management2015 DataISN Publication: No. 1607October 2016ISN , ISNetworld , RAVS and the ISN hexagon logo are registered trademarks of ISN Software Corporation (ISN).The contents of this publication are exclusively owned by ISN Software Corporation and are protected by United States and international copyright law. This publication is intended for access and internal use by activelysubscribed ISNetworld members and their active employees unless access is provided, and use is agreed to, by ISN Software Corporation. No part of this publication may be (i) reproduced, distributed, displayed, stored ina retrieval system, or transmitted in any form or by any means, electronic, mechanical, photocopying, recording or otherwise, (ii) sold or distributed for financial or other gain or (iii) used for any purpose other than expresslyset forth above or provided to a third party without the prior written permission of ISN Software Corporation. Any trademark, copyright or other notice included in this publication may not be altered or removed.
About ISN Established in 2001, ISN is the global leader in contractor and supplier informationISNetworld’s dynamic and configurable scoring criteria assist Hiring Clients andmanagement. We support over 490 Hiring Clients, including over 70 ContractorContractor Operators with measuring key performance metrics relevant to them,Operators, in capital-intensive industries to help manage more than 60,000thus promoting transparency, clear communication and opportunities to connect withcontractors and suppliers with operations in over 85 countries. Headquartered insafe and reliable contractors. By identifying contractors who meet their regulatoryDallas, Texas, ISN has additional offices in Calgary, Sydney, London, Los Angeles, Newstandards, Hiring Clients and Contractor Operators are able to drive tangible andYork, Toronto and Auckland. ISN takes pride in leading efforts to improve the efficiencysustainable performance improvements while strengthening their relationships withand effectiveness of contractor management systems and in serving as a forum fortheir contractors.sharing industry best practices among our members.For more information, visit www.isn.com or contact ISN at 1 214 303 4900 or viaOur innovative online contractor management platform, ISNetworld , is continuouslyemail at InfoRequest@isn.com.evolving to meet ever-changing corporate and regulatory requirements whilereducing unnecessary duplication associated with traditional contractorprocurement processes. Our Review and Verification Services (RAVS ) groupcomprises specialized professionals with experience in health, safety, environmental,procurement and other compliance requirements. RAVS provides an added level of duediligence to the process of reviewing contractors’ self-reported information.ISN.comContractor Performance Benchmarking by Contractor Operator, U.S., 2015 Data // About ISN1
Table of ContentsAbout ISN 1Cross-Industry Summary 53Preface 3Appendix I: Definitions 62Upstream Oil & Gas (Onshore) 5Appendix II: Incident Rate Calculations 63Upstream Oil & Gas (Offshore) 17Appendix III: Analysis Procedure Summary 66Midstream Oil & Gas (Pipeline) 29Appendix IV: Data Interpretation 67Construction and Facilities Management* 41Additional ISN Publications 69*Facilities Management includes both Contractor Operator and Hiring Client customersDisclaimerThe contents of this publication represent an aggregate data compilation and are intended for informational and general guidance purposes only. This publication is not intended for and does not constitute any advice, recommendation orproposal of a particular course of action, by or on behalf of ISN Software Corporation (“ISN”), to any user hereof. While efforts have been made to ensure the accuracy of the information contained in the publication, the information is notexhaustive and may contain both material and immaterial errors. ISN does not warrant or represent the accuracy or completeness of any information herein. ISN disclaims any losses, however arising, as a result of a user’s reliance on thecontents of this publication. Before relying on any such material or data, users should carefully make their own assessment as to its accuracy, currency, completeness and relevance for their purposes and should obtain any appropriateprofessional advice relevant to their particular circumstances. Any access or use of any information or material contained in this publication is at the user’s own risk and constitutes agreement to the terms of this disclaimer.2Contractor Performance Benchmarking by Contractor Operator, U.S., 2015 Data // Table of ContentsISN.com
PrefaceMore than 490 Hiring Clients, including over 70 Contractor Operators,* in capital-inten-This publication is specific to the performance of contractors with operations in thesive industries are currently part of the ISNetworld contractor management platform,United States. The health and safety key performance indicators (KPIs) collected,actively managing the performance and compliance of over 60,000 contractors fromaggregated and presented for each industry peer group include:around the globe. The information collected and shared in this series of benchmarkingreports includes health and safety performance data representing over 13 billion Total Recordable Incident Rate (TRIR)work hours of contractor activity in 2015. A rich and diverse network of peers across Days Away, Restricted or Job Transfer Rate (DART)various industries and a shared source of data such as this provides an opportunity for Lost Time Case Rate (LTC)developing industry-specific peer group benchmarking reports that are unique for their Fatality Rate per 100,000 Employeesinsight and comprehensiveness. Incident Severity (In Days) Experience ModifierThe main objective of this publication is to provide ISNetworld Hiring Clients andContractor Operators with industry-specific benchmarking information on how wellThe data analyzed and represented in the publication is obtained from contractors’their contractors' health and safety performance compares to that of the performancecompany-wide health and performance statistics as reported by contractors in theirof contractors being used by their industry peers. They can use this information to help2015 OSHA 300 and 300A forms.*** All values in this publication are aggregatedestablish a data-driven, objective baseline for contractor and company-wide healthto preserve the anonymity of contractors and their clients. Appendices I – IV provideand safety performance targets; assess their organizations’ contractor selectiondefinitions, calculations, a summary of the analytical procedures used in generating theand management strategies; and ultimately drive the overarching goal of keeping areport and guidelines on how to interpret the report.workplace free of injuries and illnesses.In this publication, organizations with similar types of operations and industries aregrouped together into the following four peer groups: Upstream Oil & Gas (Onshore) Upstream Oil & Gas (Offshore) Midstream Oil & Gas (Pipeline) Construction and Facilities Management***Contractor Operators are larger contractors and suppliers who use ISNetworld to ensure compliance with theirHiring Client’s requirements but also obtain a separate subscription for subcontractor management.**Facilities Management includes both Contractor Operator and Hiring Client customers***29 CFR 1904 - comContractor Performance Benchmarking by Contractor Operator, U.S., 2015 Data // Preface3
4
Section 1Upstream Oil & Gas (Onshore)1.1Total Recordable Incident Rate (TRIR) 61.6Experience Modifier 111.2Days Away, Restricted or Job Transfer Rate (DART) 71.7TRIR vs. DART 121.3Lost Time Case Rate (LTC) 81.8TRIR vs. Experience Modifier 131.4Fatality Rate 91.9Incident Rates by Number of Contractors 141.5Incident Severity (In Days) 101.10 Contractor Connection Overlap & Size Distribution 15ISN.comContractor Performance Benchmarking by Contractor Operator, U.S., 2015 Data // Upstream Oil & Gas (Onshore)5
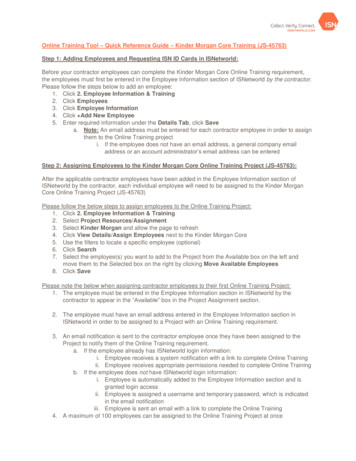
Section 1.1: Upstream Oil & Gas (Onshore)Total Recordable Incident Rate (TRIR)A0.83BENCHMARKING CONTRACTOR OPERATORS (10)B1.04C1.161 ST QUARTILE 1.16D1.19E1.362 ND QUARTILE 1.37F1.37G1.48H1.623 RD QUARTILE 1.802.002.20INCIDENT RATE PER 100 EMPLOYEES (TRIR)6Contractor Performance Benchmarking by Contractor Operator, U.S., 2015 Data // Upstream Oil & Gas (Onshore)ISN.com
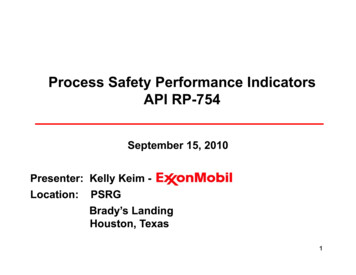
Section 1.2: Upstream Oil & Gas (Onshore)Days Away, Restricted or Job Transfer Rate (DART)A0.51BENCHMARKING CONTRACTOR OPERATORS (10)B0.66C0.671 ST QUARTILE 0.67D0.74E0.882 ND QUARTILE 0.90F0.92G0.98H1.073 RD QUARTILE INCIDENT RATE PER 100 EMPLOYEES (DART)ISN.comContractor Performance Benchmarking by Contractor Operator, U.S., 2015 Data // Upstream Oil & Gas (Onshore)7
Section 1.3: Upstream Oil & Gas (Onshore)Lost Time Case Rate (LTC)A0.22BENCHMARKING CONTRACTOR OPERATORS (10)C0.32D0.341 ST QUARTILE 0.34B0.38F0.422 ND QUARTILE 0.43E0.43G0.47H0.48I3 RD QUARTILE NCIDENT RATE PER 100 EMPLOYEES (LTC)8Contractor Performance Benchmarking by Contractor Operator, U.S., 2015 Data // Upstream Oil & Gas (Onshore)ISN.com
Section 1.4: Upstream Oil & Gas (Onshore)Fatality RateI1.56BENCHMARKING CONTRACTOR OPERATORS (10)A4.49H5.191 ST QUARTILE 5.19D5.47E5.95F2 ND QUARTILE 6.266.57J7.13G7.453 RD QUARTILE ITY RATE PER 100,000 EMPLOYEESISN.comContractor Performance Benchmarking by Contractor Operator, U.S., 2015 Data // Upstream Oil & Gas (Onshore)9
Section 1.5: Upstream Oil & Gas (Onshore)Incident Severity (In Days)H12.07BENCHMARKING CONTRACTOR OPERATORS (10)A12.22I12.501 ST QUARTILE 12.50F12.90E13.402 ND QUARTILE 13.65D13.90C14.16G14.683 RD QUARTILE 0016.0018.0020.00NUMBER OF DAYS10Contractor Performance Benchmarking by Contractor Operator, U.S., 2015 Data // Upstream Oil & Gas (Onshore)ISN.com
Section 1.6: Upstream Oil & Gas (Onshore)Experience ModifierC0.651BENCHMARKING CONTRACTOR OPERATORS (10)A0.666D0.6851 ST QUARTILE 0.685I0.725E0.7352 ND QUARTILE 0.735H0.736G0.750B0.7503 RD QUARTILE 0.750F0.776J0.500.8610.600.700.800.90WEIGHTED AVERAGE EXPERIENCE MODIFIERISN.comContractor Performance Benchmarking by Contractor Operator, U.S., 2015 Data // Upstream Oil & Gas (Onshore)11
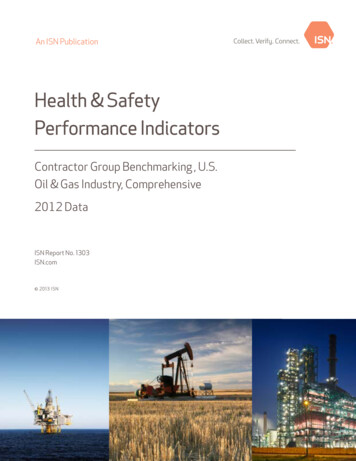
Section 1.7: Upstream Oil & Gas (Onshore)TRIR vs. CDEFGHIJ2.40TRIR2.001.601.200.800.40RATIO OF DART/TRIR70%65%60%55%BENCHMARKING CONTRACTOR OPERATORS (10)12Contractor Performance Benchmarking by Contractor Operator, U.S., 2015 Data // Upstream Oil & Gas (Onshore)ISN.com
Section 1.8: U
proposal of a particular course of action, by or on behalf of ISN Software Corporation (“ISN”), to any user hereof. While efforts have been made to ensure the accuracy of the information contained in the publication, the information is not exhaustive and may contain both material and immaterial errors. ISN does not warrant or represent the accuracy or completeness of any information herein. ISN disclaims