Transcription
ANSI / API RP-754Process Safety Performance Indicators for theRefining & Petrochemical IndustriesPart 1: Business Case & Leadership OverviewBill RalphChair API RP-754 Drafting Committee Welcome and thank you for joining us for the first in a series of four webinars todiscuss the content and implementation of the new ANSI/API RecommendedPractice 754, Process Safety Performance Indicators for the Refining andPetrochemical Industries. All four webinars are being recorded for future playback on the API website. My name is Bill Ralph and I am a Senior Process Safety Consultant for BP and itwas my pleasure to serve as the chairman of the RP-754 drafting committee. Following the presentation, there will be an opportunity for questions and answers. Let’s get started. The API RP-754 Drafting Committee worked hard over an 18 month period toproduce a standard that we believe will help our industry improve its process safetyperformance. Implementing the standard will require effort, but that effort has the potential toyield incredible benefit TRANSITION TO NEXT SLIDE1
Process Safety Incidents Highest potential for multiple injuries/deaths Highest potential for significant environmental harm Highest potential for significant property damage Highest potential for significant business interruption Highest potential for damage to reputation1220 L Street, NW Washington, DC 20005-4070 www.api.org2 Unfortunately, we don’t have to look very far or very hard to find examples ofprocess safety incidents that have resulted in devastating and tragic loss of life,significant environmental harm, costly property damage and businessinterruption, and tarnished reputation. These types of incidents are the focus of RP-754. TRANSITION TO NEXT SLIDE2
“You get what you inspect, not what youexpect.”Unknown1220 L Street, NW Washington, DC 20005-4070 www.api.org3 We’ve all heard some variation of this quote . . . You get what you inspect, notwhat you expect. Intuitively we understand the importance of performance indictors. TRANSITION TO NEXT SLIDE3
CSB Recommendation to API & USW“Work together to develop two new consensus AmericanNational Standards Institute (ANSI) standards. In the firststandard, create performance indicators for processsafety in the refinery and petrochemical industries.Ensure that the standard identifies leading and laggingindicators for nationwide public reporting as well asindicators for use at individual facilities. Include methodsfor the development and use of the performanceindicators.”1220 L Street, NW Washington, DC 20005-4070 www.api.org4 Although the OSHA process safety standard was issued in 1992, there has been nostandardized measure of process safety performance. It was this gap that lead the Chemical Safety Board to issue a recommendation to API andthe USW as part of their investigation into the 2005 BP Texas City incident. The task given to the RP-754 Committee was to create a standard for performanceindicators for process safety ensuring that the standard identifies leading and laggingindicators for nationwide public reporting. TRANSITION TO NEXT SLIDE4
RP 754 – Drafting Committee Membership Academia [1]Associations [5]Engineering & Construction [1]Government [1]Labor [3] Owner / Operators – Refiners[10] Owner / Operator – Chemicals[4][Withdrew 04-Aug-09]1220 L Street, NW Washington, DC 20005-4070 www.api.org5 As required by the ASNI process, there was a broad base of participation toachieve both openness and balance. A variety of groups and individual each with unique perspectives blending into apositive whole. As you can see, we had participants from Academia, Trade & ProfessionalAssociations, Engineering & Construction firms, Government, Labor, and OwnerOperators. Academia [1] MKO Process Safety Center Associations [5] ACC, CCPS, NPRA, UK Petroleum Industry Association, ORC[observer] [ORC Worldwide – Occupation Safety & Health Group] Engineering & Construction [1] UOP Government [1]¾CSB [observer] Labor [3] [Withdrew 04-Aug-09] USW, ICWUC [International Chemical Workers Union], Teamsters Owner/Operators – Refiners [10] BP, Chevron, CHS Inc., Koch Ind., Pasadena Ref, Exxon Mobil,Conoco Phillips, Shell, Marathon, Valero, Owner/Operator – Chemicals [4] Chevron Phillips DuPont Dow Air Products [observer]5
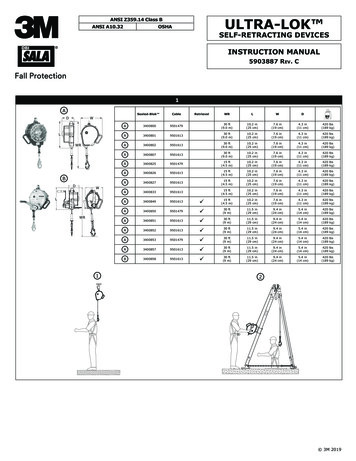
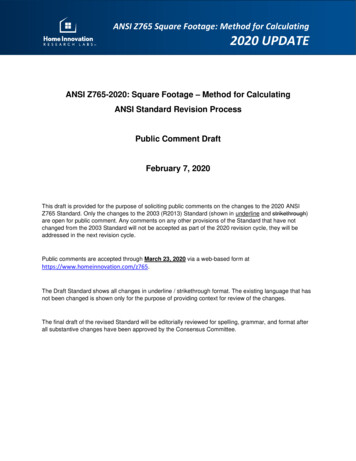
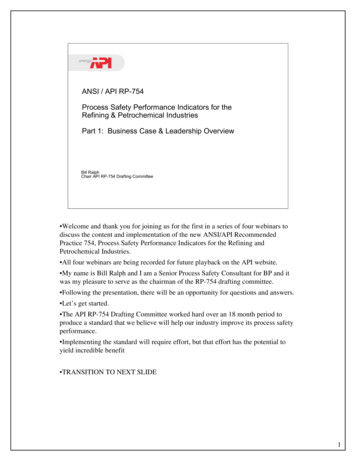
Total Recordable Incident Rate vs. Calendar Year –U.S. RefineriesExpectation that RP-754 will aidin driving similar improvementsin process safety performance1220 L Street, NW Washington, DC 20005-4070 www.api.org6 Why is the Committee confident that implementing RP-754 will result in processsafety performance improvement? We’re confident, because there are clearexamples where a standardized indicator has enabled improvement . . . One ofwhich is the OSHA Recordable Incident Rate. While none of us can be satisfied as long as anyone is getting hurt in our facilities,we can be proud of the tremendous success in reducing the occupational injuryincident rate over time. We expect that by implementing a similar measure for process safety and actingupon the data, we will see similar success over time. TRANSITION TO NEXT SLIDE6
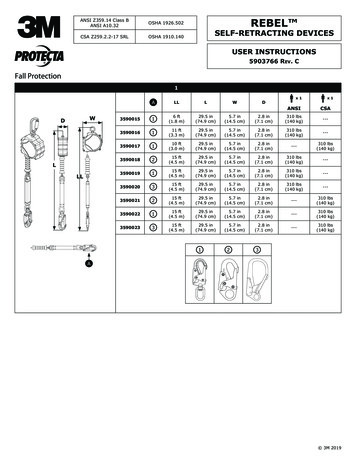
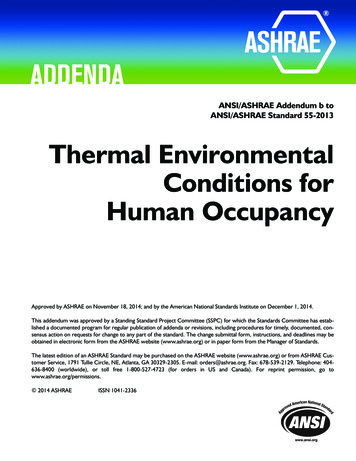
Process Safety Indicator PyramidingggLaTier 1LOPC Events ofGreater ConsequencestoricaIndBroad Access[Nationwide] PublicReporting Tiers 1 & 2 are RP754 standardizeddefinitionsTier 2 Tiers 3 & 4 arecompany definedperformanceindicatorsLOPC Events ofLesser ConsequencestoricaIndChallenges to Safety SystemsingadLeTier 3Tier 4Operating Discipline & Management SystemPerformance Indicators1220 L Street, NW Washington, DC 20005-4070 www.api.org7 RP-754 is predicated on a process safety event pyramid. The pyramid itself reflects the 1931 Heinrich model which embodies twokey concepts: First, events can be placed on a scale of increasing consequence, and Second, precursor or predictive events occur at a lower consequence foreach event with a higher consequence In terms of the CSB recommendation Tier 1 serves as a lagging indicator Tier 2 serves as a leading indicator in that it is predictive of Tier 1events Tiers 3 & 4 serve as indicators for use at individual facilities Leading and lagging labels are often debated, but the classification is notimportant. The important point is to capture information that can be acted upon tocorrect a situation. Indicators at the top of the pyramid tend to be more lagging, whileindicators at the bottom tend to be more leading. While Tiers 1 & 2 measure outcomes of greater and lesser consequence, Tiers 3 &4 measure challenges to our safety systems and gaps in our operating discipline andmanagement systems. Acting upon the data provided by Tier 3 & 4 provides the opportunity to improvethe performance measured by Tiers 1 & 2.7
Tier 1 & 2 -- Process Safety Event An unplanned or uncontrolled release of any material, including nontoxic and non-flammable materials from a process that results in oneor more of the consequences listed below: Harm to people; or Impact upon the community; or Damage to equipment; or A release of a threshold quantity PSE Rate [Total PSE Count/Total Work Hours] x 200,0001220 L Street, NW Washington, DC 20005-4070 www.api.org8 Let me walk you through a summary of the indicators identified in RP-754 The definition of Tier 1 & 2 Process Safety Events is straightforward. Was there an unplanned or uncontrolled release from primary containment? If no, then it is not a Tier 1 or 2 PSE If yes, did it result in harm to people, impact upon the community, damageto equipment, or a release of a threshold quantity of material? The count of process safety events is then used to calculate a rate. Calculating a rate creates a statistical basis for comparison over time, betweenindustry segments, or between sites within a company. TRANSITION TO NEXT SLIDE8
Tier 3 – Challenge to Safety Systems Purpose Typically represent challenges to the barrier system thatprogressed along the path to harm, but were stopped short of aTier 1 or Tier 2 PSE consequence Examples Safe Operating Limit Excursions Primary Containment Inspection or Testing Results OutsideAcceptable Limits Demands on Safety Systems Other LOPC Events1220 L Street, NW Washington, DC 20005-4070 www.api.org9 Tier 3 indicators represent challenges to our safety systems that progressed alongthe path to harm, but were stopped short of a Tier 1 or Tier 2 consequence. Examples include Safe Operating Limit Excursions, Inspection or Testing ResultsOutside of Acceptable Limits, and Demands on Safety Systems. TRANSITION TO NEXT SLIDE9
Tier 4 – Operating Discipline & Management SystemPerformance Purpose Typically represent the performance of individual components ofthe barrier system Indicative of process safety system weaknesses that maycontribute to future Tier 1, 2 or 3 PSEs Examples Process Safety Action Item Closure Training Completed on Schedule Safety Critical Equipment Inspection Completion of Emergency Response Drills1220 L Street, NW Washington, DC 20005-4070 www.api.org10 Tier 4 indicators represent gaps in our Operating Discipline and ManagementSystem Performance. The purpose of these indicators is to measure the performance of individualcomponents of the barrier system that may contribute to future Tier 1, 2, or 3process safety events. Examples include Action Item Closure, Training Completion, and MechanicalIntegrity Testing & Inspection. TRANSITION TO NEXT SLIDE10
Primary Modes of Implementation Report everything . . . Database sorts it out Train personnel to identify and report Tier 1 & 2 events1220 L Street, NW Washington, DC 20005-4070 www.api.org11 As companies begin the process of implementing RP-754, two primary approachesare emerging. One is to have personnel report all Loss of Primary Containment events into acentral database and let the database sort out whether a particular event should beclassified as Tier 1 or Tier 2. The other is to train personnel on the definitions of Tier 1 and Tier 2 and havethem classify the events at the time of reporting. Both approaches can be effective, and it is a matter of company preference as towhich approach to choose. TRANSITION TO NEXT SLIDE11
RP-754 Adoption Plans API, NPRA, OGP, and CONCAWE have committed to 2010 datacollection CCPS is revising their guide on Process Safety Leading & LaggingMetrics to align with RP-754 ACC plans to pilot IPIECA is vetting the reporting requirements with their stakeholders UK HSE provided positive comments during the ballot period1220 L Street, NW Washington, DC 20005-4070 www.api.org12 Throughout the development process, a number of groups were actively followingthe progress of the Drafting Committee and making plans for adoption. API, NPRA, OGP (Oil & Gas Producers) and CONCAWE (CONservation ofClean Air and Water ) have all committed to 2010 data collection. CCPS is revising their guide on Process Safety Leading and Lagging Metrics toalign with RP-754. ACC is planning to pilot the RP-754 definitions with a number of companieswithin their association. IPIECA (International Petroleum Industry Environmental ConservationAssociation) is vetting the reporting requirements with their stakeholders. In addition, the UK Health & Safety Executive provided positive comments duringthe ballot period which may indicate regulatory changes or guidance within the UK. TRANSITION TO NEXT SLIDE12
Benefits of Participation Consequence analysis No. & % DAFWC / Fatalities No. & % Fires No. & % Explosions No. & % Acute Releases Event analysis Type of process Mode of operation Point of release Type of material Industry benchmarking1220 L Street, NW Washington, DC 20005-4070 www.api.org13 So, is adoption of RP-754 merely an academic exercise, or does collecting,analyzing, and reporting the data provide real benefits? We know that acting upon the data is what leads to the benefits, but collecting,analyzing, and reporting the data is the first step; and the greater the participation,the greater the integrity of the data. Implementing RP-754 will enable consequence analysis, event analysis, andindustry benchmarking. It was this same type of information that contributed to theimprovements in occupational safety that I showed earlier. In 2009, API collected 2008 process safety event data from U.S. refineriesequivalent to the Tier 1 definition 19 companies representing 80 facilities participated in the data collection. While that is a good start, it is important for the refining and petrochemicalindustry to increase participation even further. TRANSITION TO NEXT SLIDE13
Broad Access [Nationwide] Public Reporting Annually, each Company publicly reports Tier 1 and Tier 2 PSEinformation. 2010 – Implementation 2011 – Data validation 2012 – Industry aggregated result 2013 – Industry and Company blinded results 2014 – Industry and Company transparent results Tier 2 reporting may lag Tier 1 by one year1220 L Street, NW Washington, DC 20005-4070 www.api.org14 Nationwide public reporting is called for by the CSB recommendation RP-754 requires that Companies publicly report Tier 1 & 2 information annually. Recognizing that this is a new process and that time is needed to implement thestandard and to validate the data, public reporting will be phased. 2010 is an implementation year. 2011 is a data validation year. If all goes well in 2010 and 2011, the industry aggregated result will be publishedin 2012. In 2013, industry and company blinded results will be published. In 2014, industry and company transparent results will be published. Again depending upon the progress of implementation, Tier 2 reporting may lagTier 1 reporting by one year. TRANSITION TO NEXT SLIDE14
Local [Site] Public Reporting Each site determines the appropriate methods to communicate PSEinformation Annual report of site-specific Tier 1, 2, 3 and 4 PSE information toemployees and employee representatives Annually, each Company makes available a su
Chair API RP-754 Drafting Committee Welcome and thank you for joining us for the first in a series of four webinars to discuss the content and implementation of the new ANSI/API Recommended Practice 754, Process Safety Performance Indicators for the Refining and Petrochemical Industries. All four webinars are being recorded for future playback on the API website. My name is Bill Ralph .
![API Ballot: [Ballot ID] – API 510 & API 570, Deferrals, Rev05](/img/5/api510andapi570deferralsrev5.jpg)