Transcription
An ISN PublicationHealth & SafetyPerformance IndicatorsContractor Group Benchmarking , U.S.Oil & Gas Industry, Comprehensive2012 DataISN Report No. 1303ISN.com 2013 ISN
About ISNEstablished in 2001, ISN is a global leader in contractor and supplier management. Wesupport over 320 Owner Clients in capital-intensive and public sector industries to helpmanage over 50,000 contractors and suppliers with operations in more than 75 countries.We are headquartered in Dallas, Texas, with additional offices in Calgary, Sydney, London,Los Angeles and New York.ISN takes pride in leading efforts to improve the efficiency and effectiveness of contractormanagement systems and in serving as a forum for sharing industry best practices amongour members.Our innovative online contractor management database, ISNetworld, is constantly evolvingto meet ever-changing corporate and legislative requirements while reducing unnecessaryduplication associated with traditional contractor procurement processes.Our Review and Verification Services (RAVS ) group is comprised of specializedprofessionals with expertise in health, safety, environmental, procurement, quality andother compliance requirements. RAVS adds a level of due diligence to the informationgathered from contractors and suppliers.ISNetworld’s dynamic and configurable functionality allows Owner Clients to measure thekey performance metrics relevant to them, promoting transparency, clear communicationand sustainable operations. ISN provides an opportunity for Owner Clients to improvetheir risk management processes and to connect with safe and reliable contractors.By identifying contractors and suppliers who meet both client-specific and legislativestandards, Owner Clients are able to drive tangible and sustained performanceimprovements while strengthening their relationships with their contractors and suppliers.For more information, visit ISN.com, contact ISN at 1 214 303 4900 or emailISNTeam@isn.com.ISNetworld.com // Report No. 1303Contractor Group Benchmarking Report, U.S., 2012 Data // Oil & Gas, Comprehensive1
Table of ContentsAbout ISN. 1Preface.3Table 1: 2012 Injury and Illness Rates by NAICS Code.4Table 2: 2012 Injury and Illness Rates by ISN Work Type. 16Appendix 1: Definitions.40Appendix 2: Incident Rate Calculations. 41Appendix 3: Analysis Procedure Summary.44DisclaimerThe contents of this publication represent an aggregate data compilation and are intended for informational andgeneral guidance purposes only. This publication is not intended, and does not constitute any advice, recommendation or proposal of a particular course of action, by or on behalf of ISN Software Corporation (“ISN”), to anyuser hereof. While efforts have been made to ensure the accuracy of the information contained in the publication,the information is not exhaustive and may contain both material and immaterial errors. ISN does not warrant orrepresent the accuracy or completeness of any information herein. ISN disclaims any losses, however arising,as a result of a user’s reliance on the contents of this publication. Before relying on any such material or data,users should carefully make their own assessment as to its accuracy, currency, completeness and relevance fortheir purposes, and should obtain any appropriate professional advice relevant to their particular circumstances.Any access or use of any information or material contained in this publication is at your own risk and constitutesagreement to the terms of this disclaimer.ISNetworld.com // Report No. 1303Contractor Group Benchmarking Report, U.S., 2012 Data // Oil & Gas, Comprehensive2
PrefaceISN gathers and manages a comprehensive range of health, safety and environmental (HSE)performance data from contractors and suppliers in capital-intensive industries. In additionto HSE, procurement, quality and compliance information, annual and quarterly HSE performance statistics are collected through ISN’s web-based system, ISNetworld, then reviewedand verified by ISN’s Review and Verification Services (RAVS) for accuracy and completion.The main purpose of this publication is to provide ISNetworld member contractors, suppliersand Owner Clients pertinent HSE performance information useful for benchmarking theirorganization’s performance against industry peers.Collectively, approximately 50,000 contractors and suppliers actively report informationthrough ISNetworld, representing nearly 11 billion work hours of activity in 2012 alone. A richsource of data such as this provides an opportunity for developing industry-specific benchmarking statistics that are unique for their quality, insight and comprehensiveness.Industry specific performance indicator publications are available for a number of industries, including Oil & Gas, Chemical, Utilities & Power Generation, Manufacturing*, Mining,Pharmaceuticals and Facilities Management. This publication specifically covers informationpertinent to the Oil & Gas industry for the year 2012.The health and safety Key Performance Indicators (KPIs) collected and presented in thisreport include: Total Recordable Incident Rate (TRIR) Total Nonfatal Recordable Incident Rate (Nonfatal TRIR) Days Away, Restricted or Job Transfer Rate (DART) Fatality Rate Per 100,000 Employees Total Number of Fatalities Incident Severity (In Days)These KPIs are organized into two tables: Table 1 provides detailed health and safetyperformance indicators aggregated by NAICS code. For added granularity, Table 2 providesperformance indicators grouped by ISN Work Type designation. All values in this publicationare aggregated to preserve the anonymity of contractor and supplier companies. Appendices1 through 3 provide definitions, calculations and analysis procedures.It is ISN’s hope that users will find the publication useful for benchmarking their HSE performance against that of their peers and for driving continuous health and safety performanceimprovement efforts in the workplace.*Manufacturing includes Steel, Fertilizer Products, Wood and Paper, Food and Agriculture industries.ISNetworld.com // Report No. 1303Contractor Group Benchmarking Report, U.S., 2012 Data // Oil & Gas, Comprehensive3
Table 12012 Injury and Illness Rates,by NAICS CodeISNetworld.com // Report No. 1303Contractor Group Benchmarking Report, U.S., 2012 Data // Oil & Gas, Comprehensive4
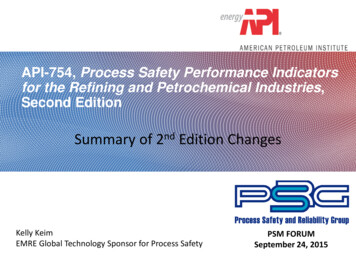
Table 1: 2012 Injury and Illness Rates by NAICS CodeInjuries and Illnesses [b]NAICS[a]CodeNAICS Title [a]Fatalities [c]Severity [d]Total Numberof EmployeesTotal Numberof ExposureHours(in 1,000s)TotalRecordableIncident Rate(TRIR)Nonfatal TotalRecordableIncident Rate(Nonfatal TRIR)Days Away/Restricted orTransfer Rate(DART)Total Numberof FatalitiesFatality Rateper 100,000WorkersIncident Severity(In Days)11Agriculture, Forestry, Fishing and Hunting1,7913,3131.811.810.7800.0014.87 (9.17*)113Forestry and 1.2700.0031.33115Support Activities for Agriculture and Forestry6861,2932.012.010.4600.0013.92 (0.08*)1151Support Activities for Crop Production4388611.86 (1.63*)1.86 (1.63*)0.4600.0022.63 (0.14*)11511Support Activities for Crop Production4378601.86 (1.63*)1.86 (1.63*)0.4600.0022.63 (0.14*)115112Soil Preparation, Planting, and Cultivating4228281.93 (1.70*)1.93 (1.70*)0.4800.0022.63 (0.14*)21Mining, Quarrying, and Oil and Gas 211Oil and Gas Extraction7,65317,6602.12 (1.56*)2.11 (1.55*)1.45 (0.93*)111.3215.642111Oil and Gas Extraction6,27814,4592.23 (1.55*)2.21 (1.53*)1.54 (0.90*)113.8314.2321111Oil and Gas Extraction5,40112,4872.40 (1.62*)2.39 (1.60*)1.70 (0.96*)116.0215.21211111Crude Petroleum and Natural Gas Extraction4,1399,8202.30 (1.31*)2.28 (1.29*)1.73 (0.83*)120.3715.95211112Natural Gas Liquid Extraction5081,0353.293.292.1300.0022.35212Mining (except Oil and Gas)8081,5981.381.381.0000.0032.912123Nonmetallic Mineral Mining and Quarrying5651,1131.261.260.9000.0046.2921232Sand, Gravel, Clay, and Ceramic and Refractory Minerals Mining truction Sand and Gravel Mining2294451.351.351.3500.0057.67213Support Activities for Support Activities for 1Support Activities for 11Drilling Oil and Gas Wells82,414182,5052.082.061.311415.3419.02[a] North American Industry Classification System—United States, 2007. Totals for each NAICS code are based on all records classified at a more disaggregated level and may include data forindustries not shown separately. For example, calculations presented for two-digit NAICS codes will include all records with any of the three, four, five and six-digit NAICS codes that are subsumedin the two-digit NAICS classification.[b] The injury and illness rates represent the number of injuries and illnesses per 100 full-time workers. See Appendix 2 on Incident Rate Calculations.[c] The fatality rate represents the number of fatalities per 100,000 full-time workers. See Appendix 2 on Fatality Rate Calculations.[d] The incident severity (in days) represents the number of days away from work per recordable incident. See Appendix 2 on Incident Severity (In Days) Calculations.- Indicates that the data are suppressed because there are fewer than 10 contractors reporting for the cell.* Indicates that the difference between the rate computed using all valid records and that computed using only those records excluding the highest 0.5th percentile extreme values is greater than orequal to 10%. See sections 3 and 5 of Appendix 3 for more information.** Indicates that the reported fatality rate is greater than or equal to 100.† Indicates that the largest contractor in the corresponding NAICS Code contributes more than 70% of the Total Exposure Hours of all contractors in that NAICS Code.ISNetworld.com // Report No. 1303Contractor Group Benchmarking Report, U.S., 2012 Data // Oil & Gas, Comprehensive5
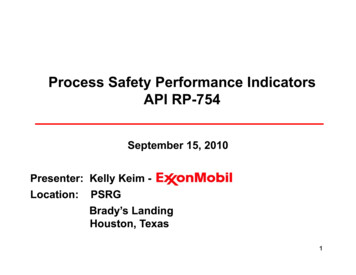
Table 1: 2012 Injury and Illness Rates by NAICS CodeInjuries and Illnesses [b]NAICS[a]CodeNAICS Title [a]Fatalities [c]Severity [d]Total Numberof EmployeesTotal Numberof ExposureHours(in 1,000s)TotalRecordableIncident Rate(TRIR)Nonfatal TotalRecordableIncident Rate(Nonfatal TRIR)Days Away/Restricted orTransfer Rate(DART)Total Numberof FatalitiesFatality Rateper 100,000WorkersIncident Severity(In Days)213112Support Activities for Oil and Gas ies7,16415,7671.641.640.7500.007.302211Electric Power Generation, Transmission and lectric Power ssil Fuel Electric Power tural Gas Distribution2213Water, Sewage and Other Systems22131Water Supply and Irrigation Systems23Construction236Construction of 4,3191.551.550.7834.167.78Residential Building ntial Building Construction5631,1900.840.670.001**0.00236115New Single-Family Housing Construction (except Operative al Building 1Industrial Building Commercial and Institutional Building avy and Civil Engineering 371Utility System 3711Water and Sewer Line and Related Structures 12Oil and Gas Pipeline and Related Structures 3713Power and Communication Line and Related Structures Highway, Street, and Bridge 31Highway, Street, and Bridge 9Other Heavy and Civil Engineering 9Other Heavy and Civil Engineering pecialty Trade 81Foundation, Structure, and Building Exterior Contractors29,56259,9611.701.700.8526.6712.60 (10.36*)23811Poured Concrete Foundation and Structure tructural Steel and Precast Concrete Contractors8,79118,7181.221.220.5800.009.35 (7.84*)23814Masonry Contractors4,1438,1071.211.210.5900.0016.27 (6.63*)ISNetworld.com // Report No. 1303Contractor Group Benchmarking Report, U.S., 2012 Data // Oil & Gas, Comprehensive6
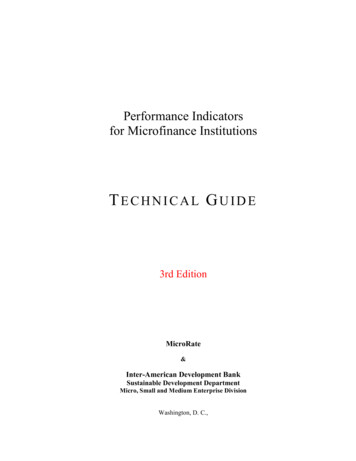
Table 1: 2012 Injury and Illness Rates by NAICS CodeInjuries and Illnesses [b]NAICS[a]CodeNAICS Title [a]Total Numberof EmployeesTotal Numberof ExposureHours(in 1,000s)TotalRecordableIncident Rate(TRIR)Nonfatal TotalRecordableIncident Rate(Nonfatal TRIR)Fatalities [c]Days Away
ISN gathers and manages a comprehensive range of health, safety and environmental (HSE) performance data from contractors and suppliers in capital-intensive industries. In addition to HSE, procurement, quality and compliance information, annual and quarterly HSE perfor-mance statistics are collected through ISN’s web-based system, ISNetworld, then reviewed and verified by ISN’s Review File Size: 654KBPage Count: 50