Transcription
TNO PUBLICAutomotive Campus 305708 JZ HelmondP.O. Box 7565700 AT HelmondThe NetherlandsTNO reportwww.tno.nlTNO 2018 R11448IVECO EURO VI LNG PEMS test reportDate29 November 2018Author(s)Jeroen van SchaijkCopy noNo. of copiesNumber of pagesNumber ofappendicesSponsor1185 (incl. appendices)10Project nameProject numberRolande B.V.Postbus 614286 ZH AlmkerkThe NetherlandsIveco LNG Rolande PEMS060.35579All rights reserved.No part of this publication may be reproduced and/or published by print, photoprint,microfilm or any other means without the previous written consent of TNO.In case this report was drafted on instructions, the rights and obligations of contractingparties are subject to either the General Terms and Conditions for commissions to TNO, orthe relevant agreement concluded between the contracting parties. Submitting the report forinspection to parties who have a direct interest is permitted. 2018 TNOTNO PUBLICT 31 88 866 57 29F 31 88 866 88 62
TNO report TNO 2018 R114482 / 28Contents11.11.21.3Introduction . 3Purpose . 3Assignor . 3Method of testing . 322.12.22.32.42.52.6Test Setup . 4Description of the test vehicle . 4Vehicle specification . 5Equipment used . 8Test route . 11OBD error check . 13Test Procedure . 1333.13.2Test results . 14Checks and conditions . 14Emission Results . 194Summary . 245References . 276Signature . 28AppendicesA Test 1B Test 2C Test 3D Test 4E Test 5F Test 6G Test 7H Calibration reports OBS OneI Details of the gases usedJ Vehicle mass receipt
TNO report TNO 2018 R114483 / 281 Introduction1.1PurposeIn 2017, 2 Euro VI LNG vehicles were tested. One of these vehicles was an Ivecovehicle. In response to the results, further investigation was conducted.A series of seven (7) on-road emission tests were performed on a truck with VehicleIdentification Number WJMM1VRH60C356363. This vehicle is an Euro VI LNGvehicle from the category N3, with a mileage of 182.000 km. This vehicle is thesame vehicle as was used to perform the testing as described in report TNO 2017R11336 [1].The focus of this investigation was on improving emissions in urban operation. Thetest campaign was started with a new dataset compared to the status of the vehiclein 2017.The test setup involved the following steps, in chronological order: 1.2Evaluate the result with the new dataset using 2 different test routes. One ofthese routes was identical to the route used in 2017. The other route has aslightly different share of urban operationEvaluate the effect of driving styleEvaluate the effect of payload (10 and 100% payload have been evaluated)Evaluate the effect of a 2nd new dataset. This dataset was implemented byIveco Turin.AssignorThe emission tests were performed at the request of Rolande B.V.Rolande B.V.Postbus 614286 ZH AlmkerkThe Netherlands1.3Method of testingThe emission tests have been performed using a Portable Emission MeasurementSystem (hereinafter ‘PEMS’). The method of testing was according to theprocedures described in Regulation EU No. 582/2011 [2] as last amended by EU136/2014 [3] , yet was not intended to serve as a in-service conformity test.
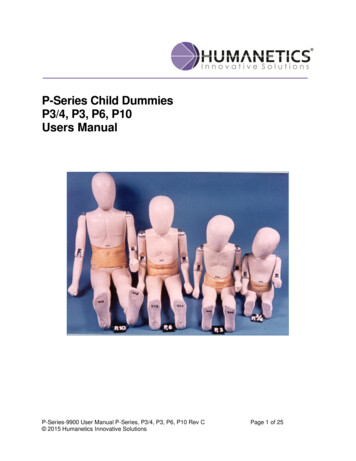
TNO report TNO 2018 R114482 Test Setup2.1Description of the test vehicleThe test have been performed on the vehicle as shown in Figure 1.Figure 1The test vehicle4 / 28
TNO report TNO 2018 R114482.22.2.15 / 28Vehicle specificationVehicle informationTable 1 lists the relevant information on the test vehicle. Table 2 and Table 3 list therelevant information on the engine and aftertreatment system respectively.Table 1General informationModelVehicle ownerLicense plate no.Date of registrationOdometer reading at intakevehicleGross Vehicle Weight (GVW)Registered mass runningorderLoading capacityAxle configurationVIN (chassis number)WheelbaseVehicle classGearbox make typeNumber of forward gearsTyre make and type rear axleTyre sizeTyre test pressureFuel tank capacityTable 219800 kg7760 kg12040 kg4x2WJMM1VRH60C3563633.79 mN3ZF-AS Tronic 12AS1931TD12Pirelli TR:01315 / 70 / R22,58.5 bar2x598 lEngine informationEngine typeFuel injection systemEngine serial numberNumber of cylindersDisplacementEuro ClassTurboIntercoolerEGRTable 3Iveco Stralis NP400Cornelissen Transport B.V.28-BHX-416-12-2016182363 kmF2CFE601E-J002Multi-point port injection00013716568.710 lEuro VIYesYesNoAftertreatment informationAftertreatment system(downstream)Three-Way-Catalytic converter(TWC)
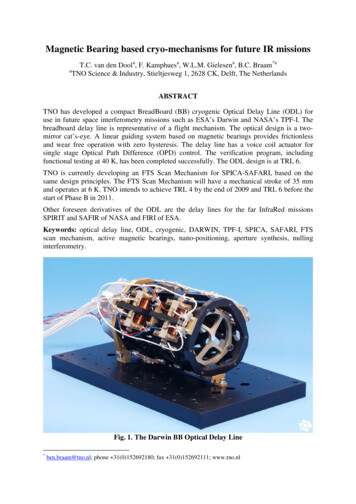
TNO report TNO 2018 R114482.2.26 / 28Vehicle payloadThe vehicle has been tested with payloads of 10, 55 and 100%The load percentage of 55% results in a mass of the ballast load of 15862 kg.Therefore a combined test mass of 7760 kg (running order mass truck) 7400 kg(running order mass trailer) 15862 kg (loading mass) 31022 kg (total test mass)has been used. The same approach has been used for the 10% payload, resultingin a total mass of 18044 kg. The 100% payload test has been performed with themaximum allowed mass of the total combination of 44000 kg.The results of the total combination mass measurements can be found in AppendixJ.An artificial payload is used to load the combination to the desired payloads. Theload consisted of concrete blocks, a container filled with water, sand bags and themeasurement equipment. The payload of 55% is shown in Figure 2.Figure 2 The vehicle payload of 55%
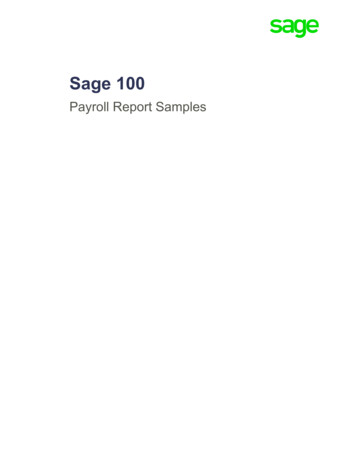
TNO report TNO 2018 R114482.2.37 / 28Fuel specificationsFor the performed tests the vehicle was fuelled at Rolande B.V. Veghel with LNG.The specifications of the LNG fuel batch at the time of refuelling were provided byRolande B.V. as shown in Figure 3.Figure 3 LNG fuel specifications provided by Rolande B.V.
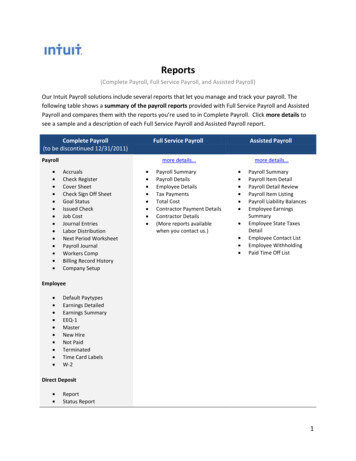
TNO report TNO 2018 R114482.38 / 28Equipment used2.3.1Gaseous emissionsThe analyser that was used for measuring the gaseous emissions is the OBS-ONEGS12 (PEMS) with serial number 63JNMN52. For its specifications see Table 4.Detailed information about the checks performed for the calibration of the gaseousanalysers can be found in Appendix I.The PEMS analyser installed in the vehicle is shown in Figure 4.Table 4OBS-ONE-GS12 racyFlame IonizationDetector (FID)Non-DispersiveInfrared (NIDR)0 – 10000 ppmCWithin 0.3% of full scale or 2.0%of readings (whichever is larger)Within 0.3% of full scale or 2.0%of readings (whichever is larger)CO2Non-DispersiveInfrared (NIDR)0 – 20 %Within 0.3% of full scale or 2.0%of readings (whichever is larger)NOChemiLuminescenceDetection (CLD)ChemiLuminescenceDetection (CLD)0 – 3000 ppmWithin 0.3% of full scale or 2.0%of readings (whichever is larger)0 – 3000 ppmWithin 0.3% of full scale or 2.0%of readings (whichever is larger)CONOxFigure 40 – 10 %The PEMS analyser mounted in the truck
TNO report TNO 2018 R114482.3.29 / 28Exhaust flow meterThe exhaust mass flow, pressure and temperature are measured with a Pitot FlowMeter Unit (PF) and flow tube as shown in Figure 5; for specifications see Table 5.Detailed information about the calibration of the pitot flow module and tube can befound in Appendix A. An additional NOx sensor was installed by Iveco downstreamof the TWC, connected to their Telemaco system.Table 5Horiba Pitot Flow Meter specificationsPF serial numberFlow tube serial numberFlow tube diameterFlow measurement rangeFlow measurement accuracyExhaust temperature measurementrangeExhaust temperature accuracyExhaust pressure measurementrangeExhaust pressure accuracyEFM CableFigure 5PG7RUL35170219GH5 inch (G-tube)0 – 45 m³/minWithin 2.0 % of full scale0-800 CWithin 0.5 % of full scale or 2.0 % ofreadings (whichever is larger)70-115 kPa (abs)Within 0.5 % of full scale or 2.0 % ofreadings (whichever is larger)Exhaust H/L Tube and ThermocoupleCableThe flow tube connected to the exhaust
TNO report TNO 2018 R114482.3.310 / 28Other equipmentTable 6 lists the remaining equipment that was used to operate the measurementsystem.Table 6Other equipmentSystemsoftwareDIAdemsoftwarePower supplyPower terminalPower cableGPS sensorWeather stationProtocoladapterHeated lineSystem batterySilver Scan-ToolsoftwareversionSilverscan CANinterface1.2.92.11.1Gen set: Honda 20i EAAJ-182018524V Power supplyPower Cable BATT24V to DC3 DC4 to DC3extension cableU-Blox ANN-MS-1-005 GPS AntennaTemp and RH sensor HoribaKvaser Leaf Light v2 73-30130-00685-0Single Heated Line 191 C2x 12V 170 Ah 1000 A (EN)6.22.36.28520Kvaser Leaf Light v2 018504
TNO report TNO 2018 R114482.411 / 28Test routeTwo different test routes were used in this test campaign:.Route 1 fulfills the trip composition requirements based on vehicle speed as shownin Table 7.Table 7 Trip composition as stated in EU 582/2011[2]TypeSpeed rangeTime shareUrban0-50 km/h20 5%Rural50-75 km/h25 5%Motorway 75 km/h55 5%Route 2 corresponds with the N3 route as was used in report TNO 2017 R11336[1]. Compared to route 1, route 2 has a different urban part and the same rural andmotorway part.Even though this route was used in unchanged form, changes in road and trafficcircumstances have led to a different vehicle speed profile such that the tripcomposition could not be reproduced. As a result of this, the trip composition asspecified in Regulation EU No. 582/2011 [2] could not be met during this testingseries.The test sequence is shown in Table 8 and the corresponding routes that weredriven are shown in the figures on the next page. The location of the periodic checkof the PEMS analysers is pointed out on the map in Figure 6 and Figure 7.Test 1 has been started with a warm engine. Test 2 to 7 were started with a coldengine. A coolant temperature of 70 C was used as criterion for a warm engine.The periodic check of route 1 has been performed while driving, before entering themotorway. For route 2 this has been performed at a standstill with the vehicle idling.Table 8 Test sequenceTest #1234567Test ad55%55%55%55%10%100%55%
TNO report TNO 2018 R11448Figure 6Test route 1Figure 7Test route 212 / 28
TNO report TNO 2018 R114482.513 / 28OBD error checkAn OBD error check was performed by TNO prior to start of the first PEMS test. Noactive error codes were found in the vehicle.Software:Adapter:2.6Silver Scan-Tool 6.22.36.28250Kvaser Leaf Light v2 73-30130-00685-0Test ProcedureThe figure below shows the daily test procedure in a flowchart: For test 2 to 7 thestep ‘Vehicle warm up’ was omitted.PreparePEMSVehiclewarm upCalibratePEMS Warm up Change heated filter Check piping and wiring Check OBD for malfunctions with OBD Silver scan-tool (only at first test if nowarnings lights during program) Run warm-up route Coolant temperature 70 C - run warm-up route again Coolant temperature 70 C - go to next step Calibrate PEMS with zero (Synthetic air) and span gas (for specifications seeAppendix I )Run test Start Sampling (Phase 1) Start engine Run Test routePeriodicCheck Stop sampling Zero span check Start sampling Continue test route (Phase 2)End of test Stop sampling Zero Span check Export PEMS data Use HoribaPP (Calculation tool for cycle results by Horiba)Data Check resultsevaluation
TNO report TNO 2018 R1144814 / 283 Test results3.1Checks and conditionsData checks were performed. Chapter 3.1.1 to 3.1.3 show the result of thesechecks for analyser drift, odometer and test conditions respectively. In addition, aconsistency check on the fuel flow was performed as described in section 3.1.4.The requirements regarding trip composition are shown in section 3.1.5 followed bya full load curve check in section 3.1.6.3.1.1Drift checkThe analysers were calibrated prior to testing and checked for drift during theperiodic check. After the test, the analyser drift was determined. Drift correction wasapplied for all the test and fulfilled the criteria as stated in EU 582/2011[2]. Theresults of the drift checks are shown in Appendix A to G, section 4.3.1.2Odometer distance checkAt the start of the test and after testing, the odometer reading was noted. Thetravelled distance is compared to GPS data from PEMS in Table 9. Lower GPSmileage can be caused by loss of GPS connection in tunnels, travelled distanceduring the drift check and odometer accuracy.Table 9Odometer distance check against GPS GPS 98.7198.4
TNO report TNO 2018 R114483.1.315 / 28Test conditionsThe PEMS cycles with the test-vehicle were measured under the conditionsregarding traffic, driving style and weather as shown in Table 10 and Table 11. Fortest 7 a new dataset was used.Table 10Test conditions PEMS tests overview 1/2Testnumber1234567Table 114567Test t1111112Test conditions PEMS test overview 2/2Testnumber123DateTrafficDriving styleAmbient temperatureWeatherNormalBusy urbanBusy urban, hold up atrural, traffic jam atmotorwayNormalTraffic jam at motorwayMinor hold up at urbanNormalNormalNormal19 C26 CSunnySunnyNormal19 CSunnyAnticipatingNormalNormalNormal25 C29 C25 C27 CSunnySunnySunnySunny
TNO report TNO 2018 R114483.1.416 / 28Fuel Consistency checkThe fuel consistency check was performed by TNO as seen in Figure 8. Theconsistency of the data was verified using a correlation between the measured fuelflow from the ECU and the fuel flow calculated from exhaust mass flow measuredby the EFM and gas concentrations according to 582/2011[2]. A linear regressionwas performed for the measured and calculated fuel rate values which resulted in aregression coefficient 0.9. The fuel consistency check result is valid for all testsand can be found in Appendix A to G, section 3.Figure 83.1.5Correlation of ECU Fuel rate to calculated fuel rate test 1Trip compositionThe categories in the tables below are based on the first acceleration by use of firstacceleration method1:Urban- Starts at the beginning of the test including cold start if applicableRural- Starts after the first acceleration above 55 km/hMotorway - Starts after the first acceleration above 75 km/hThe trip compositions of the tests are shown in Table 12 to Table 14. Thecharacteristics during the tests expressed as time share can be seen in Table 15.1Which differs from the EU 582/2011 [2] approach
TNO report TNO 2018 R1144817 / 28Table 12 Trip composition Urban including cold start if applicableTestnumberUrbanDistanceDurationAverage 8616.80:49:3720.3716.50:40:5824.2Table 13 Trip composition RuralTestnumberRuralDistanceDurationAverage .5649.30:53:4855.0749.10:51:2857.2Table 14 Trip composition MotorwayTestMotorwaynumberDistanceDurationAverage :0874.56132.61:40:5078.97132.81:40:2979.3
TNO report TNO 2018 R1144818 / 28Table 15 Trip characteristics including cold rTime shareTime shareTime shareTime 9.468.07.2714.49.871.44.53.1.6Full load curve checkThe torque data provided by the ECU was compared to the full load curve provided.It was found that the engine load as indicated by the engine ECU matched the fullload curve well for all tests. See Appendix A to G, section 5.
TNO report TNO 2018 R114483.219 / 28Emission ResultsThe results of the emission measurements are described in section 3.2.1 and 3.2.2.3.2.1Gaseous emissionsTable 16 shows the total cumulative gaseous emissions divided by the total cyclework excluding the cold start period. A coolant temperature of 70 C was used ascriterion for a warm engine.Table 16Test evaluation: Total cycle gaseous emissions excluding cold 210.4640.3680.133Table 17 shows the total cumulative gaseous emissions, of the tests performed witha cold start, divided by the total cycle work including the cold start period. Test 1has been performed with a warm start and is therefore not included in the table.Table 17Test evaluation: Total cycle gaseous emissions including cold .4010.134The NO, NO₂ and NOx test results were divided in the three trip categories.The emission results are expressed in grams per kilometre for each test. This hasbeen done for the emission results excluding the cold start period in Table 18 andFigure 9. The emission results including the cold start period can be found in Table19 and Figure 10.NO and NO₂ mass- Measured mass on street levelNO mass NO₂ equivalent - Calculated NO₂ mass when all NO is converted to NO₂
TNO report TNO 2018 R1144820 / 28Table 18 Test emissions [g/km] excluding cold start including drift correctionTripTest Emissionscategory[g/km]UrbanRuralMotorwayTest 1Test 2Test 3Test 4Test 5Test 6Test 7NO massNO mass (NO₂ 3211.4772.2831.8130.207NOx mass2.3073.2333.3021.4722.2831.7170.191NO2 mass0.0550.0180.0000.0000.0000.0000.000NO massNO mass (NO₂ 9000.5420.5180.9230.208NOx massNO₂ .0000.0000.0050.0000.000NO massNO mass (NO₂ 2670.2170.2360.2800.144NOx massNO₂ .0000.0000.0010.0000.000Figure 9 NO₂ and NO (NO₂ eq.) [g/km] excluding cold start
TNO report TNO 2018 R1144821 / 28Table 19 Test emissions [g/km] including cold start including drift correctionTripTest Emissionscategory[g/km]UrbanRuralMotorwayTest 1Test 2Test 3Test 4Test 5Test 6Test 7NO massNO mass (NO₂ .0562.6482.2000.235NOx massNO₂ 0.0110.0050.0000.000NO massNO mass (NO₂ .5420.5180.9230.208NOx massNO₂ 0.0000.0050.0000.000NO massNO mass (NO₂ .2170.2360.2800.144NOx massNO₂ 0.0000.0010.0000.000Figure 10 NO₂ and NO (NO₂ eq.) [g/km] including cold start
TNO report TNO 2018 R114483.2.222 / 28Calculated conformity factorsThe CF (Conformity Factor) results for CO, THC and NOx emissions, for both workand CO2 window based methods are shown in Table 21 and Table 22.Only test 1 can be considered as valid test because it fulfils the trip compositionrequirements as stated in EU 582/2011 [2]. The results from test 2 to 7 should beconsidered as indicative only.The reference work and CO2 mass are calculated from the cold and hot WHTCresults as reported in the type approval certificate [4], with the respective weighingfactors of 14% and 86%:Reference work- 27.165 kWhReference CO2 mass - 16224 gramsData was processed according to EU 582/2011 [2], which means that: Data evaluation starts after the coolant temperature has reached 70 C orafter 20 minutes of testing, whichever condition is met first. Windows are marked valid when the average engine power exceeds theminimum power requirement of 20%. When the resulting share of validwindows is below 50%, the power threshold is lowered in steps of 1% (to aminimum of 15%) until the amount of valid windows exceeds 50%; From the resulting valid windows, per emission component the 10% withthe highest calculated emissions are discarded; The conformity factor is determined by dividing the resulting highestemission by the legislative limit for Positive Ignition (PI) engines as seen inTable 20. No CH4 analyser was used during testing, therefore the CH4 limitwas used for THC.Table 20 Euro VI Emission Limits according to EU 582/2011 [2]WHTC NOxmg/kWh460
TNO report TNO 2018 R11448Table 2123 / 28Test evaluation: CF Work based window results at 90% according to regulationrequirementsWork based windowTestnumber1234567Table 0202020202020Test evaluation: CF CO2 based window results at 90% according to regulationrequirementsCO2 based .393.694.9For more detailed test results see Appendix A to G, section 1 and 2.Threshold%20202020202020
TNO report TNO 2018 R1144824 / 284 SummarySeveral tests have been performed with different routes, driving styles and trafficconditions. Eventually a new dataset was used for the last test.The conditions of the tests are summarized in Table 23.Table 23 Test 7222255%10%100%55%TrafficDriving styleNormalBusy urbanBusy Urban & Hold up at rural &traffic jam at motorwayNormalTraffic jam at motorwayMinor hold up at rmalNormalNormal1111112FindingsRepeating the test cycle as was used in TNO 2017 R11336 [1] resulted in similarNOx emissions as were reported in TNO 2017 R11336 [1].Variation of traffic conditions and driving style and changing to a new dataset hasshown that the NOx emissions, as seen in Figure 9, are affected by trafficconditions, driving style and used dataset. The effects described below were mainlyobserved in the urban part of the tests. Test 2 and 4 used the same routes. Test 4 was performed with a moreconservative driving style in less dense traffic conditions. This resulted in anapproximate reduction of 50% in NOx emissions, compared to the initialresults.Test 4 was performed using a more conservative driving style compared totest 1, but has comparable traffic conditions. The comparison of the resultsfor these two tests indicates that a conservative driving style has a reducingeffect on NOx emissions.Test 7 was performed with a normal driving style but a new dataset byIveco. A significant reduction of NOx emissions was observed, specificallyfor the urban part, of approximately 90% compared to the initial results ofthis test campaign.General The share of NO₂ on street level in the NOx emissions is very low for alltests.Test were performed with respective payloads of 10, 55 and 100%. Noclear effect of the payload on the NOx emissions are observed. This findingis based on tests with dataset 1 only.Including or excluding the cold-start phase was found to have a limitedeffect on the NOx emissions in urban operation.
TNO report TNO 2018 R1144825 / 28 The driver gave positive feedback after driving with dataset number two(test 7). He observed a smoother behavior during deceleration (downshifting). Result specific for dataset 2: Reduction of NOx emissions was observed for urban and rural operationin test 7. The observed reduction is highest over this test when driving ismore dynamical, as occurs in typical urban driving/traffic. For urban,rural and motorway operation, respectively 93%, 66% and 5% reductionwas found compared to the 2017 results reported in report TNO 2017R11336 [1]. For NOx, the conformity factor for a single PEMS test with dataset 2 is0.4, which is below the applicable limit of 1.5.Figure 11, Comparison on NOx, ISC testing 2017 vs dataset 2 Comparison with diesel trucks:When comparing the dataset 2 (test 7) results to the average EURO VI dieselvehicles from the testing programme as mentioned in rapport TNO 2017 R11336 [1]it is observed that the NOx emissions in [g/km] are lower than those of the averagediesel.
TNO report TNO 2018 R1144826 / 28For urban, rural and motorway operation, respectively 84%, 20% and 4% reductionwas found compared to the 2017 average EURO VI diesel results reported in reportTNO 2017 R11336 [1].The results presented for dataset 2 (Test 7) show lower NOx emissions. It shouldbe noted that these conclusions and findings are based on a single PEMS test withthis updated dataset. Iveco has informed TNO that a homologation procedure hasbeen started. This, after homologation, opens up the possibility to adapt alreadyrunning vehicles to the new calibration.
TNO report TNO 2018 R1144827 / 285 References[1]Emissions testing of two Euro VI LNG heavy-duty vehicle in the Netherlands:tank-to-wheel emissions, TNO 2017 R11336[2]Commission Regulation (EU) No 582/2011, of 25 May 2011, implementing andamending Regulation (EC) No 595/2009 of the European Parliament and ofthe Council with respect to emissions from heavy duty vehicles (Euro VI) andamending Annexes I and III to Directive 2007/46/EC of the EuropeanParliament and of the Council.[3]Commission Regulation (EU) No 136/2014, of 11 February 2014amending Directive 2007/46/EC of the European Parliament and of theCouncil, Commission Regulation (EC) No 692/2008 as regards emissions fromlight passenger and commercial vehicles (Euro 5 and Euro 6) and CommissionRegulation (EU) No 582/2011 as regards emissions from heavy duty vehicles(Euro VI).[4]Certificato di omologazione CE, of 30 November 2015motor e3 595 2009 67 2014C 1024 00
TNO report TNO 2018 R1144828 / 286 SignatureHelmond, 30-11-2018Ing. R.A. (Rob) SchutI.A. of Ir. M.D. (Martijn) StammHead of departmentTNOIng. J.W.H. (Jeroen) van SchaijkAuthor
TNO report TNO 2018 R10885A Test 1A.1 CO2-based reportTNO PUBLICAppendix A 1/57
TNO report TNO 2018 R10885A.2 Work-based reportTNO PUBLICAppendix A 2/57
TNO report TNO 2018 R10885A.3 Fuel rate correlationTNO PUBLICAppendix A 3/57
TNO report TNO 2018 R10885A.4 Drift check resultsA.5 Full load curveTNO PUBLICAppendix A 4/57
TNO report TNO 2018 R10885B Test 2B.1 CO2-based reportTNO PUBLICAppendix B 5/57
TNO report TNO 2018 R10885B.2 Work-based reportTNO PUBLICAppendix B 6/57
TNO report TNO 2018 R10885B.3 Fuel rate correlationTNO PUBLICAppendix B 7/57
TNO report TNO 2018 R10885B.4 Drift check resultsB.5 Full load curveTNO PUBLICAppendix B 8/57
TNO report TNO 2018 R10885C Test 3C.1 CO2-based reportTNO PUBLICAppendix C 9/57
TNO report TNO 2018 R10885C.2 Work-based reportTNO PUBLICAppendix C 10/57
TNO report TNO 2018 R10885C.3 Fuel rate correlationTNO PUBLICAppendix C 11/57
TNO report TNO 2018 R10885C.4 Drift check resultsC.5 Full load curveTNO PUBLICAppendix C 12/57
TNO report TNO 2018 R10885D Test 4D.1 CO2-based reportTNO PUBLICAppendix D 13/57
TNO report TNO 2018 R10885D.2 Work-based reportTNO PUBLICAppendix D 14/57
TNO report TNO 2018 R10885D.3 Fuel rate correlationTNO PUBLICAppendix D 15/57
TNO report TNO 2018 R10885D.4 Drift check resultsD.5 Full load curveTNO PUBLICAppendix D 16/57
TNO report TNO 2018 R10885E Test 5E.1 CO2-based reportTNO PUBLICAppendix E 17/57
TNO report TNO 2018 R10885E.2 Work-based reportTNO PUBLICAppendix E 18/57
TNO report TNO 2018 R10885E.3 Fuel rate correlationTNO PUBLICAppendix E 19/57
TNO report TNO 2018 R10885E.4 Drift check resultsE.5 Full load curveTNO PUBLICAppendix E 20/57
TNO report TNO 2018 R10885F Test 6F.1 CO2-based reportTNO PUBLICAppendix F 21/57
TNO report TNO 2018 R10885F.2 Work-based reportTNO PUBLICAppendix F 22/57
TNO report TNO 2018 R10885F.3 Fuel rate correlationTNO PUBLICAppendix F 23/57
TNO report TNO 2018
Kvaser Leaf Light v2 73-30130-00685- Heated line Single Heated Line 191 C System battery 2x 12V 170 Ah 1000 A (EN) Silver Scan-Tool software version 6.22.36.28520 Silverscan CAN interface Kvaser Leaf Light v2 018504 . TNO report TNO 2018 R11448 11 / 28 2.4 Test route