Transcription
Basic CardiacRhythms –Identificationand Response
Module 1ANATOMY, PHYSIOLOGY, &ELECTRICAL CONDUCTION
Objectives Describe the normal cardiac anatomy and physiology and normalelectrical conduction through the heart. Identify and relate waveforms to the cardiac cycle.
Cardiac Anatomy 2 upper chambers Right and left atria 2 lower chambers Right and left ventricle 2 Atrioventricular valves (Mitral &Tricuspid) Open with ventricular diastole Close with ventricular systole 2 Semilunar Valves (Aortic & Pulmonic) Open with ventricular systole Open with ventricular diastole
The Cardiovascular System Pulmonary Circulation Unoxygenated – right side of the heart Systemic Circulation Oxygenated – left side of the heart
AnatomyCoronary ArteriesHow The Heart Works
AnatomyCoronary Arteries 2 major vessels of the coronary circulation Left main coronary artery Left anterior descending and circumflex branches Right main coronary artery The left and right coronary arteries originate at the base of theaorta from openings called the coronary ostia behind the aorticvalve leaflets.
PhysiologyBlood FlowUnoxygenated blood flows frominferior and superior vena cavaRight AtriumTricuspid ValveRight VentriclePulmonic ValveLungsThrough Pulmonary system
PhysiologyBlood FlowOxygenated blood flows from thepulmonary veinsLeft AtriumMitral ValveLeft VentricleAortic ValveSystemic Circulation Blood Flow Through The Heart Cardiology Rap
Physiology Cardiac cycle Represents the actual time sequence between ventricular contractionand ventricular relaxation Systole Simultaneous contraction of the ventricles Diastole Synonymous with ventricular relaxation When ventricles fill passively from the atria to 70% of blood capacity
Physiology Heart rate (HR) Number of contractions (beats per minute) Normal heart rate is 60 – 100 beats per minute (bpm) Stroke volume (SV) Volume of blood being pumped out of ventricles in a single beat orcontraction Normal stroke volume is 60 – 130 mL
Physiology Cardiac output (CO) Amount of blood pumped by the left ventricle in one minute Normal cardiac output is 4 – 8 L/minCardiac Output Stroke Volume x Heart Rate**Our Swan boxes give us a continuous cardiac output reading!
Physiology Pre-load Volume and stretch of the ventricular myocardium at the end ofdiastole After-load Amount of pressure against which the left ventricle must work duringsystole to open the aortic valve Clinically measure by systolic blood pressure
Normal Electrical Conduction System SA node Inter-nodal pathways AV node Bundle of his Left & Right bundle branches Purkinje fibersThe SA Node and the AV Node
Electrical Conduction SystemEKG WaveformsOne complete cardiac cycle P, Q, R, S, (QRS complex),and T wave
Electrical Conduction SystemEKG Waveforms P wave Atrial depolarization (contraction) QRS Complex Ventricular depolarization, atrial repolarization T wave Ventricular repolarization (resting phase)
Module 2INTERPRETING EKGRHYTHM STRIPS
Objectives Utilize a systematic process when approaching the interpretationof the EKG. Identify normal and abnormal components on the EKG.
EASI LeadLead PlacementColor CodeE Brown: Lower sternum (5th intercostalspace)A Red: Left mid-axillary line (5thintercostal space)S Black: Upper sternum (just below sternalangle)I White: Right mid-axillary line (5thintercostal space)Green: Anywhere
Electrical Conduction SystemsEKG Waveforms
Reading EKG Graph PaperGraph paper allows a visualmeasurement of: Time (rate) Measured on the horizontal line Amplitude (voltage) Measured on the vertical line
Reading EKG Graph PaperPaper divided into small squares: Width 1 millimeter (mm) Time interval 0.04 seconds 1 small square 0.04 seconds
Reading EKG Graph PaperDarker lines divide paper into every 5thsquare vertically and horizontally: Large squares measure 5 mm inheight and width Represents time interval of 0.20 seconds 25 small squares in each large square 1 large square 0.20 seconds
Interpreting EKG Rhythm Strips First and most important ASSESS YOUR PATIENT!! Read every strip from left to right, starting at the beginning of thestrip Apply the five-step systematic approach that you will learn in thismodule for consistency with each strip that you interpret
Interpreting EKG Rhythm StripsThe Five Step ApproachThe five-step approach, in order of application, includes analysis ofthe following:1. Heart rate2. Heart rhythm3. P wave4. PR interval5. QRS complex
Interpreting EKG Rhythm StripsStep 1 – Heart Rate Count the number of electrical impulses as represented by PQRSTcomplexes conducted through the myocardium in 60 seconds (1 minute) Atrial rate: Count the number of P waves Ventricular rate: Count the number of QRS complexes
Interpreting EKG Rhythm StripsStep 1 – Heart RateMethods to determine heart rate The 6 second method Denotes a 6 second interval on EKG strip Strip is marked by 3 or 6 second tick marks on the top or bottom of the graphpaper Count the number of QRS complexes occurring within the 6 second interval,and then multiply that number by 10 Using rate determination chart More accurate calculation of HR Preferred method Must use this method for the test!!
Interpreting EKG Rhythm StripsStep 1 – Heart Rate 6 second method
Interpreting EKG Rhythm StripsStep 1 – Heart Rate Using rate determination chart Count spaces between R to R Find number of spaces on the chartto determine the rate
Interpreting EKG Rhythm StripsStep 1 – Heart Rate Example:1. Find an R to R2. Count the small boxes between the R’s 153. On the chart find “15 spaces” 100bpm
Interpreting EKG Rhythm StripsStep 2 – Rhythm Rhythm A sequential beating of the heart as a result of the generation of electricalimpulses Classified as: Regular pattern: Interval between the R waves is regular Irregular pattern: Interval between the R waves is not regular
Interpreting EKG Rhythm StripsStep 2 – Rhythm Measuring a Regular Rhythm Measure the intervals between R waves (measure from R to R) If the intervals vary by less than 0.06 seconds or 1.5 small boxes, the rhythm isconsidered to be regular
Interpreting EKG Rhythm StripsStep 2 – Rhythm Measuring an Irregular Rhythm If the intervals between the R waves (from R to R) are variable by greater than0.06 seconds or 1.5 small boxes, the rhythm is considered to be irregular
Interpreting EKG Rhythm StripsStep 3 – P Wave P wave is produced when the left and right atria depolarize First deviation from the isoelectric lineShould be rounded and uprightP wave is the SA node pacing or firing at regular intervalsThis pattern is referred to as a sinus rhythm
Interpreting EKG Rhythm StripsStep 3 – P Wave P wave: 5 questions to ask1.2.3.4.Are P waves present?Are P waves occurring regularly?Is there one P wave present for every QRS complex present?Are the P waves smooth, rounded, and upright in appearance, or are theyinverted?5. Do all P waves look similar?
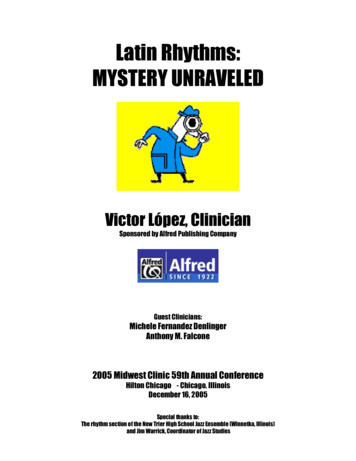
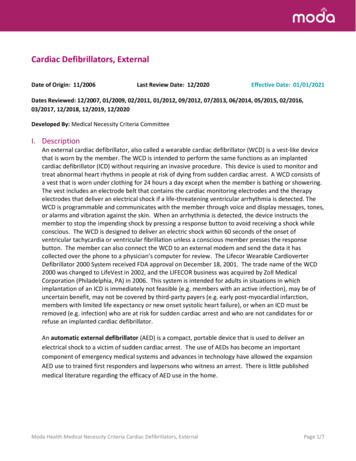
Interpreting EKG Rhythm StripsStep 4 – PR Interval Measures the time interval from theonset of atrial contraction to onset ofventricular contraction Measured from onset of P wave to theonset of the QRS complex Normal interval is 0.12–0.20 seconds(3-5 small squares)
Measuring PR Interval:Red lines indicate where calipers would be placed to measure PR interval
Interpreting EKG Rhythm StripsStep 4 – PR Interval PR interval: 3 questions to ask1. Are the PR intervals greater than 0.20 seconds?2. Are the PR intervals less than 0.12 seconds?3. Are the PR intervals consistent across the EKG strip?
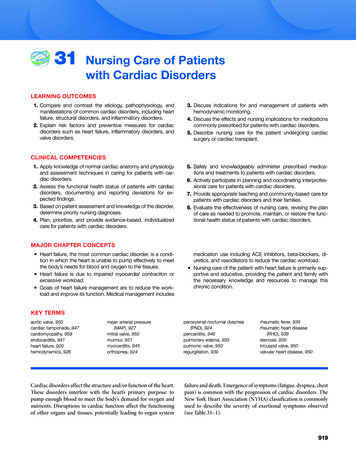
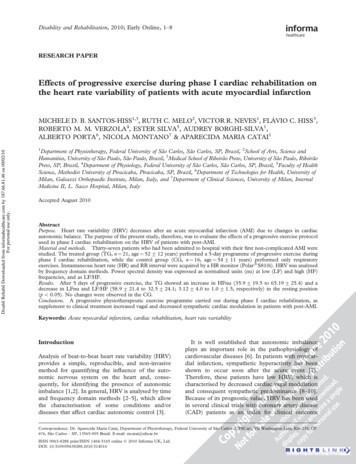
Interpreting EKG Rhythm StripsStep 5 – QRS Complex The QRS complex presentsdepolarization or contraction of theventricles Q wave First negative or downward deflection of thislarge complex R wave First upward or positive deflection following theP wave (tallest waveform) S wave The sharp, negative or downward deflectionthat follows the R wave Normal interval is 0.06-0.12 seconds(1 ½ to 3 small boxes)
Measuring QRS complex:Red lines indicate where calipers should be placed to measure QRS
Interpreting EKG Rhythm StripsStep 5 – QRS Complex QRS complex: 3 questions to ask1. Are the QRS complexes greater than 0.12 seconds (in width)?2. Are the QRS complexes less than 0.06 seconds (in width)?3. Are the QRS complexes similar in appearance across the EKG strip?
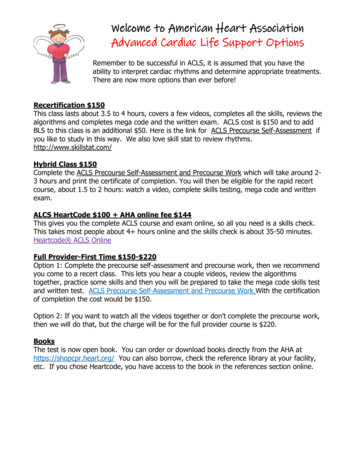
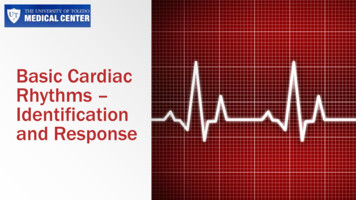
Interpreting EKG Rhythm StripsPractice Strip1. HR # of boxes between R’s 19 spaces 79bpm2. Rhythm regular or irregular regular (R-R’s are equal)3. P waves P wave for every QRS? yes4. PR interval measure from beginning of P to beginning of QRS 0.165. QRS measure from start of Q to end of S 0.08
Interpreting EKG Rhythm StripsT Wave Produced by ventricular repolarizationor relaxation Commonly seen as the first upward orpositive deflection following the QRScomplex
Interpreting EKG Rhythm StripsU Wave Usually not visible on EKG strips If visible, typically follows the T wave Appears much smaller than T wave,rounded, upright, or positive deflectionis they are present Cause or origin not completelyunderstood May indicate hypokalemia
Interpreting EKG Rhythm StripsArtifact EKG waveforms from sources outside the heart Interference is seen on the monitor or EKG strip 4 causes Patient movement (most common)Loose or defective electrodes (fuzzy baseline)Improper grounding (60 cycle interference)Faulty EKG apparatus
Module 3SINUS RHYTHMS
Objectives Recognize sinus dysrhythmias on EKG and relate cause,significance, symptoms, and treatment.
Sinus Rhythms Rhythms that originate in the sinoatrial node (SA node) 5 Common Variations of a sinus rhythm: Normal sinus rhythm (60 – 100 bpm) Sinus bradycardia ( 60 bpm) Sinus tachycardia ( 100 bpm) Sinus arrhythmia (60 – 100 bpm) Sinus pause/arrest
Normal Sinus RhythmSinus rhythm is the normal regular rhythm of the heart set by the naturalpacemaker of the heart called the sinoatrial node. It is located in the wall of theright atrium. Normal cardiac impulses start there and are transmitted to theatria and down to the ventricles.
5 Steps to Identify Normal Sinus Rhythm1. What is the rate?60-100 beats per minute2. What is the rhythm?Atrial rhythm regularVentricular rhythm regular3. Is there a P wave before each QRS?Are P waves upright and uniform?YesYes4. What is the length of the PR interval?0.12-0.20 seconds (3-5 small squares)5. Do all QRS complexes look alike?What is the length of the QRS complexes?Yes0.06-0.12 seconds (1 ½ to 3 small squares)
Normal Sinus Rhythm Nursing Interventions No interventions required!! Monitor patient if ordered by physician.
Sinus BradycardiaSinus bradycardia is a regular but unusually slow heart beat (less than60 bpm). Sinus bradycardia is often seen as a normal variation inathletes, during sleep, or in response to a vagal maneuver.
5 Steps to Identify Sinus Bradycardia Rhythm1. What is the rate?Less than 60 beats per minute2. What is the rhythm?Atrial rhythm regularVentricular rhythm regular3. Is there a P wave before each QRS?Are P waves upright and uniform?YesYes4. What is the length of the PR interval?0.12-0.20 seconds (3-5 small squares)5. Do all QRS complexes look alike?What is the length of the QRS complexes?Yes0.06-0.12 seconds (1 ½ to 3 small squares)
Causes and S/S of Sinus BradycardiaCausesSigns and Symptoms Hypoglycemia Syncope Hypothermia Dizziness Hypothyroidism Chest Pain Previous cardiac history Shortness of Breath Medications Exercise Intolerance Toxic exposure Cool, clammy skin MI – Inferior wall involving rightcoronary artery
Risk and Medical Tx of Sinus BradycardiaRiskMedical Treatment Reduced Cardiac Output Atropine Pacing if the patient ishemodynamically compromised Treatment will be based on whetherpatient is symptomatic
Sinus Bradycardia Nursing Interventions Assess patient – Are they symptomatic? Give oxygen and monitor oxygen saturation Monitor blood pressure and heart rate Start IV if not already established Notify MD
Sinus TachycardiaSinus Tachycardia is a fast heartbeat related to a rapid firing of thesinoatrial (SA) node. The clinical dysrhythmia depends on the underlyingcause. It may be normal depending on the patient.
5 Steps to Identify Sinus Tachycardia Rhythm1. What is the rate?101-160 beats per minute2. What is the rhythm?Atrial rhythm regularVentricular rhythm regular3. Is there a P wave before each QRS?Are P waves upright and uniform?YesYes4. What is the length of the PR interval?0.12-0.20 seconds (3-5 small squares)5. Do all QRS complexes look alike?What is the length of the QRS complexes?Yes0.06-0.12 seconds (1 ½ to 3 small squares)
Causes and S/S of Sinus TachycardiaCausesSigns and Symptoms Damage to heart tissues from heart disease Dizziness Hypertension Shortness of breath Fever Lightheadedness Stress Rapid pulse rate Excess alcohol, caffeine, nicotine, orrecreational drugs such as cocaine Heart palpitations A side effect of medications Response to pain Imbalance of electrolytes Hyperthyroidism Chest pain Syncope
Risk and Medical Tx of Sinus TachycardiaRisk Cardiac output may fall due toinadequate ventricular filling time Myocardial oxygen demand increases Can precipitate myocardial ischemiaor infarctMedical Treatment Aimed at finding and treating cause
Sinus Tachycardia Nursing Interventions Assess patient – Are they symptomatic? Are they stable? Give oxygen and monitor oxygen saturation Monitor blood pressure and heart rate Start IV if not already established Notify MDACLS Protocol Look for the cause of the tachycardia and treat it Fever – give acetaminophen or ibuprofen Stimulants – stop use (caffeine, OTC meds, herbs, illicit drugs) Anxiety – give reassurance or ant-anxiety medication Sepsis, An
Interpreting EKG Rhythm Strips First and most important ASSESS YOUR PATIENT!! Read every strip from left to right, starting at the beginning of the strip Apply the five-step systematic approach that you will learn in this module for consistency with each strip that you interpret . Interpreting EKG Rhythm Strips The Five Step Approach The five-step approach, in order of application, includes .