Transcription
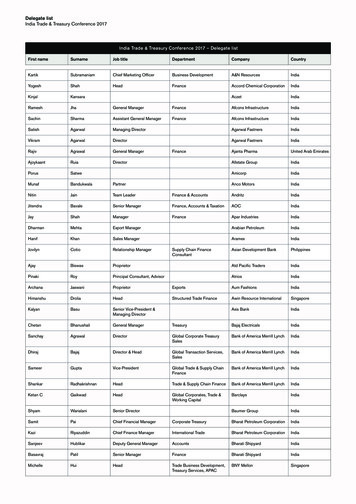
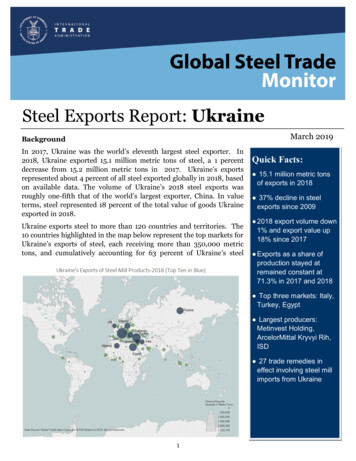
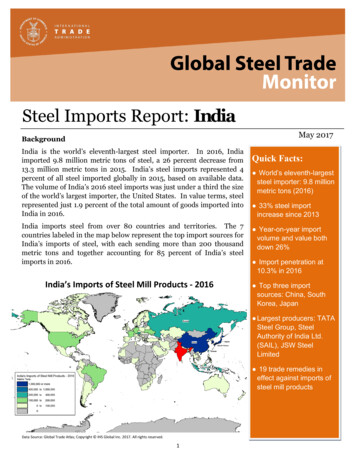
Steel Imports Report: IndiaMay 2017BackgroundIndia is the world’s eleventh-largest steel importer. In 2016, Indiaimported 9.8 million metric tons of steel, a 26 percent decrease from13.3 million metric tons in 2015. India’s steel imports represented 4percent of all steel imported globally in 2015, based on available data.The volume of India’s 2016 steel imports was just under a third the sizeof the world’s largest importer, the United States. In value terms, steelrepresented just 1.9 percent of the total amount of goods imported intoIndia in 2016.India imports steel from over 80 countries and territories. The 7countries labeled in the map below represent the top import sources forIndia’s imports of steel, with each sending more than 200 thousandmetric tons and together accounting for 85 percent of India’s steelimports in 2016.India’s Imports of Steel Mill Products - 2016Quick Facts: World’s eleventh-largeststeel importer: 9.8 millionmetric tons (2016) 33% steel importincrease since 2013 Year-on-year importvolume and value bothdown 26% Import penetration at10.3% in 2016 Top three importsources: China, SouthKorea, Japan Largest producers: TATASteel Group, SteelAuthority of India Ltd.(SAIL), JSW SteelLimited 19 trade remedies ineffect against imports ofsteel mill productsData Source: Global Trade Atlas; Copyright IHS Global Inc. 2017. All rights reserved.1
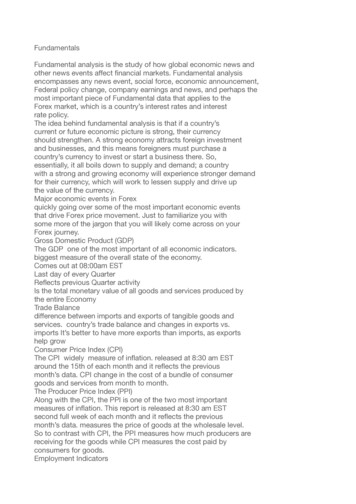
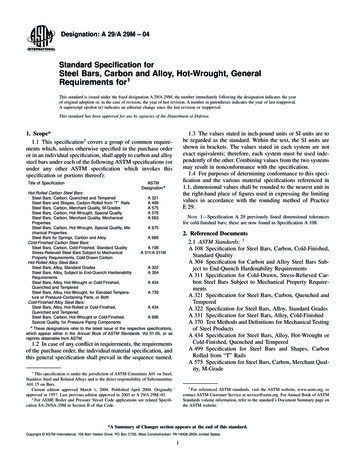
Steel Imports Report: IndiaSteel Trade tr1Millions of Metric TonsIndia's Trade in Steel Mill Products by QuarterSince 2005, India hasExportsImportsalternated between being4a net steel importer and a3.5netsteelexporter.3Imports and exports have2.5displayedaroughly2inverse relationship, as1.5imports declined sharply1in tandem with export0.5growth. Since their most0recent low point in 2013,India’simportshave2005 2006 2007 2008 2009 2010 2011 2012 2013 2014 2015 2016grown 33 percent. IndiaSource: IHS Global Trade Atlasposted a steel trade deficitof -6 million metric tons in 2015. In 2016, however, a jump in exports and a drop in importsresulted in a surplus of 184 thousand metric tons.Import Volume, Value, and ProductIndia's volume of steel imports hit a peak in 2015 at 13.3 million metric tons — a jump of 41 percentfrom 9.4 million metric tons in 2014. Imports in 2016 decreased back down to 2014 levels, down 26percent to 9.8 million metric tons. The value of India’s 2016 imports was 6.7 billion, a 26 percentdecrease from the 9 billion in 2015.Flat products account for the largest share of India’s steel imports. In 2016, 67 percent, or 6.6million metric tons, of India’s steel imports were of flat products. Long products accounted for 14percent, or 1.4 million metric tons, followed by stainless steel at 7 percent (708 thousand metrictons), semi-finished steel at 6 percent (576 thousand metric tons), and pipe and tube products at 6percent (563 thousand metric tons).India's Imports of Steel Mill ProductsIndia's Imports of Steel Mill ProductsBillions of U.S. DollarsMillions of Metric TonsLongPipe & TubeSemi-finishedLong 020092010Stainless14Billions of U.S. DollarsMillions of Metric TonsFlatFlat12108Pipe & TubeSemi-finishedStainless20132015 12 10 8 66 44 22020092010201120122013201420152016Source: IHS Global Trade AtlasSource: IHS Global Trade Atlas22011201220142016
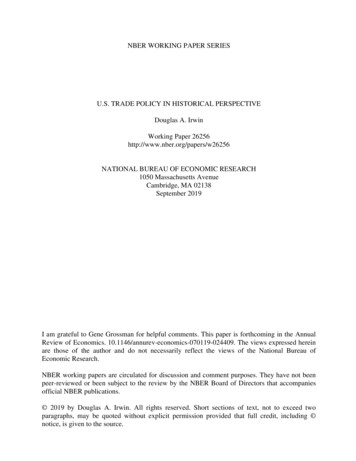
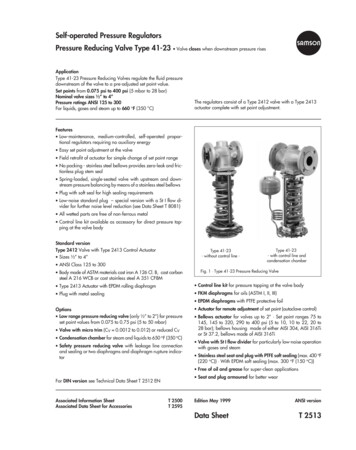
Steel Imports Report: IndiaImports by Top SourceThe top 5 source countries forIndia’s steel imports represented81 percent of the total steelimport volume in 2016 at 7.9million metric tons (mmt).China accounted for the largestshare of India’s imports bysource country at 34 percent(3.3 mmt), followed by SouthKorea at 25 percent (2.4 mmt),Japan at 15 percent (1.5 mmt),Russia at 4 percent (0.4 mmt),and Indonesia at 3 percent (0.3mmt).India's Steel Imports - Top 5 Sources2016 - Millions of Metric TonsChi na34%Res t ofWorl d19%Top 5Sources81%South Korea25%Indonesia3%Rus sia4%Ja pa n15%Source: IHS Global Trade AtlasThe United States ranked 13thas a source for India’s steel imports. India imported 102 thousand metric tons from the UnitedStates in 2016 — an 8 percent decrease from 111 thousand metric tons in 2015.Trends in Imports from Top SourcesThe volume of India’s steel imports decreased in seven of India’s top 10 steel import sources between2015 and 2016. India’s imports from Brazil showed the greatest decrease in volume, down 46.2percent by volume from 2015,followed by Japan (downPercent Change in Imports from Top 10 Sources (2015 to 2016)40.6%),Indonesia(downVolumeValue29.2%), Russia (down 25%), and 200%China (down 24.5%).Only150%India’s imports from Austria,France, and Taiwan showed 100%increases in volume between 50%2015 and 2016, up 148.1 percent,0%40.8 percent, and 3.4 percent,-50%respectively.The overall value of India’s -100%imports decreased in eight of itstop ten sources. As with volumedecreases, the decreases in steelSource: IHS Global Trade Atlasvalue between 2015 and 2016included India’s imports from Brazil (down 50.5%), Indonesia (down 38.3%), Japan (37.7%), Russia(35.9%), and China (28.4%). Only imports from Austria and France increased in value in 2016, up86.8 percent and 25.4 percent, respectively.3
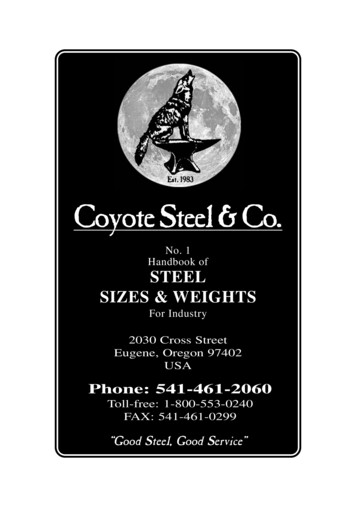
Steel Imports Report: IndiaTop Sources by Steel Product CategoryIndia’s top import sources by volume vary across types of steel products. India imported the largestshare of its flat products from South Korea at 33 percent (2.2 million metric tons) in 2016, followedby China at 26 percent (1.7 million metric tons).China accounted for the largest share of each of India’s imports of long products at 56 percent (769thousand metric tons), pipe and tube products at 71 percent (397 thousand metric tons), andstainless products at 54 percent (385 thousand metric tons). Indonesia held the largest share ofIndia’s semi-finished imports at 42 percent (241 thousand metric tons).Stainless was the only product category for which the United States was a top 5 import source in2016, accounting for 26 thousand metric tons of India’s imports in 2016.India's Top 5 Import Sources by Product - 2016Semi-finishedPipe and TubeLong ProductsFlat ProductsSouth th KoreaUkraineChinaJapanSouth KoreaNepalRussiaIndonesiaBrazilSouth KoreaChinaJapanStainlessChinaJapanSouth KoreaTaiwanUnited States00.511.522.5Millions of Metric TonsSource: IHS Global Trade Atlas4
Steel Imports Report: IndiaIndia’s Export Market Share from Top Source CountriesIn 2015, the share of steel exports sent to India from its top import sources increased in all of India’stop sources except Ukraine. In 2015, the share of Ukraine’s steel exports to India decreased 0.1percentage points from 2014.India's Steel Export Market ShareCountries with notable increasesTop 10 ImportShare ofIndia's RankShare ofIndia's Rankin their shares of steel exports toSourcesExports to Indiain 2014 Exports to Indiain 2015India in 2015 included Indonesia- 2014- 2015(up 3.3 percentage points fromChina4.1%44.3%52014), South Korea (up 2.7South Korea7.1%49.8%4percentage points), and JapanJapan3.8%96.0%6(up 2.2 percentage points).Russia0.5%321.2%19Among India’s top import Indonesia11.4%214.7%3sources, Indonesia and South Ukraine1.6%111.5%11Korea sent the largest shares of Brazil1.7%102.1%9their total steel exports to India Germany0.6%250.9%19in 2015, at 14.7 percent and 9.8 Taiwan1.6%171.9%15percent respectively. In 2015, United Arabflat products accounted for the edonimportdataperreportingcountrylargest share of steel exports to* UAE export data for 2015 are not availableIndia from South Korea at 93percent (2.8 million metric tons) and the second largest share of steel exports from Indonesia at 42percent (123 thousand metric tons). Semi-finished products accounted for the largest share ofIndonesia’s steel exports to India at 55 percent (161 thousand metric tons) in 2015.5
Steel Imports Report: IndiaOverall Production and Import PenetrationMillions of Metric TonsIndia's Import 77.381.387.389.695.6Apparent Import %11.8%9.4%10.8%13.9%10.3%0%Sources: World Steel Association; IHS Global Trade AtlasIndia’s crude steel production has increased every year since 2009, growing 51 percent between2009 and 2016. Production in 2016 was up 7 percent to 95.6 million metric tons from 89.6 millionmetric tons in 2015. Apparent consumption (a measure of steel demand) has tracked relativelyclosely with production over the period but was slightly outpaced by production in the majority ofyears. In 2016, apparent consumption was nearly on par with production. Import penetrationdecreased 3.6 percentage points from 13.9 percent in 2015 to 10.3 percent in 2016 due to a decreasein imports as demand held relatively steady.Top ProducersBefore economic reforms in1991, steel production in Indiawas concentrated among state-ownedcompanies.Currently, private companiesdominatecrudesteelproduction in India. The top6 producers accounted for65.4 million metric tons, or 73percentoftotal2015production, based on availabledata.India’s Top Steel Producers in 2015ProductionMain Products(mmt)Rank Company1TATA Steel Group26.3Hot-rolled/cold-rolled coils andsheets, galvanized, tube2Steel Authority of India Ltd.(SAIL)14.3Flat, structural, rails, tubular3JSW Steel Limited12.4Hot-rolled coils, plates, sheets,galvanized4Essar Steel Group5.7Plates, pipes, cold-rolled,galvanized5Rashtriya Ispat Nigam Ltd(VIZAG Steel)3.6Specialty, wire rod, rebar,structural, rounds6Jindal Steel and Power Ltd(JSPL)3.1Rails, beams, coils, wire rodSources: World Steel Association; Hoovers; MarketLine6
Steel Imports Report: IndiaTrade Remedies in the Steel SectorAntidumping duties (AD), countervailing duties (CVD), associated suspension agreements, andsafeguards are often referred to collectively as trade remedies. These are internationally agreed uponmechanisms to address the market-distorting effects of unfair trade, or serious injury or threat ofserious injury caused by a surge in imports. Unlike anti-dumping and countervailing measures,safeguards do not require a finding of an “unfair” practice. Before applying these duties or measures,countries investigate allegations and can remedy or provide relief for the injury caused to a domesticindustry. The tables below provides statistics on the current number of trade remedies India hasagainst imports of steel mill products from various countries.India’s Trade Remedies in Effect Against Steel Mill ImportsCountryADSuspension Agreementsand UndertakingsCVDTotalChina22European Union33Malaysia11South Africa22South Korea33Taiwan22Thailand11United States33TOTAL1700Source: World Trade Organization, through December 1, 2016Steel Mill Safeguards in EffectCountryProductIndiaHot-rolled steel in coilsIndiaHot-rolled steel flat sheets and platesSource: World Trade Organization, through February 24, 2017717
Steel Imports Report: GlossaryApparent Consumption: Dom estic cr u de steel pr odu ction plu s steel im por ts m inu s steel expor ts. Shipm entdata are not available for all countries, therefore crude steel production is used as a proxy.Export Market: Destination of a cou ntr y’s exports.Flat Products: Pr odu ced by r olling sem i-finished steel through varying sets of rolls. Includes sheets, strips, and plates.Used most often in the automotive, tubing, appliance, and machinery manufacturing sectors.Import Penetration: Ratio of im por ts to appar ent consu m ption.Import Source: Sou r ce of a cou ntr y’s imports.Long Products: Steel pr odu cts that fall ou tside the flat pr odu cts categor y. Inclu des bar s, r ails, r ods, andbeams. Used in many sectors but most commonly in construction.Pipe and Tube Products: Eith er seam less or w elded pipe an d tu be pr odu cts. Used in m any sector s bu t m ostcommonly in construction and energy sectors.Semi-finished Products: Th e initial, inter m ediate solid for m s of m olten steel, to be r e -heated and further forged,rolled, shaped, or otherwise worked into finished steel products. Includes blooms, billets, slabs, ingots, and steel for castings.Stainless Products: Steel pr odu cts containing at m inim u m 10.5% chr om iu m (Cr ) offer ing better cor r osionresistance than regular steel.Steel Mill Products: Car bon, alloy, or stain less steel pr odu ced by either a basic oxygen fu r n ace or an electr icarc furnace. Includes semi-finished steel products and finished steel products. For trade data purposes, steel mill products aredefined at the Harmonized System (HS) 6-digit level as: 720610 through 721650, 721699 through 730110, 730210, 730240through 730290, and 730410 through 730690. The following discontinued HS codes have been included for purposes ofreporting historical data (prior to 2007): 722520, 722693, 722694, 722910, 730410, 730421, 730610, 730620, and 730660.Global Steel Trade Monitor: The monitor provides global import and export trends for the top countries trading in steelproducts. The current reports expand upon the early release information already provided by the Steel Import Monitoring andAnalysis (SIMA) system that collects and publishes data on U.S. imports of steel mill products. Complementing the SIMA data,these reports provide objective and current global steel industry information about the top countries that play an essential rolein the global steel trade. Information in these reports includes global exports and import trends, production and consumptiondata and, where available, information regarding trade remedy actions taken on steel products. The reports will be updatedquarterly.Steel Import Monitoring and Analysis (SIMA) System: The Department of Commerce uses a steel import licensingprogram to collect and publish aggregate data on near real-time steel mill imports into the United States. SIMA incorporatesinformation collected from steel license applications with publicly released data from the U.S. Census Bureau. By design, thisinformation provides stakeholders with valuable information on the steel trade with the United States. For more informationabout SIMA, please go to http://enforcement.trade.gov/steel/license/.8
India is the world's eleventh-largest steel importer. In 2016, India imported 9.8 million metric tons of steel, a 26 percent decrease from 13.3 million metric tons in 2015. India's steel imports represented 4 percent of all steel imported globally in 2015, based on available data.