Transcription
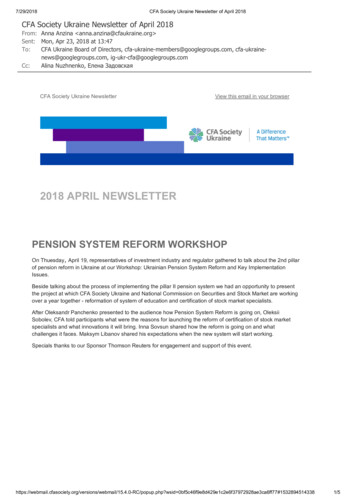
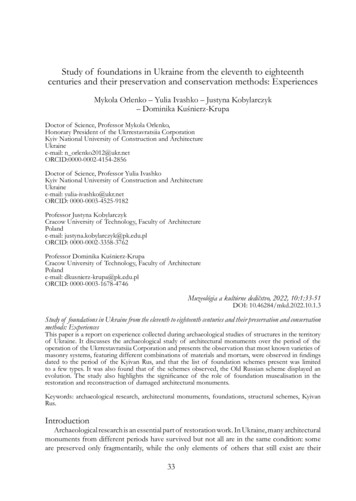
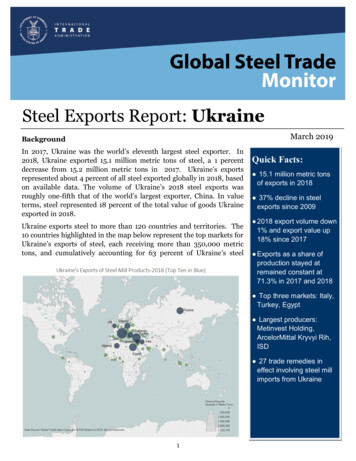
Steel Exports Report: UkraineMarch 2019BackgroundIn 2017, Ukraine was the world’s eleventh largest steel exporter. In2018, Ukraine exported 15.1 million metric tons of steel, a 1 percentdecrease from 15.2 million metric tons in 2017. Ukraine’s exportsrepresented about 4 percent of all steel exported globally in 2018, basedon available data. The volume of Ukraine’s 2018 steel exports wasroughly one-fifth that of the world’s largest exporter, China. In valueterms, steel represented 18 percent of the total value of goods Ukraineexported in 2018.Ukraine exports steel to more than 120 countries and territories. The10 countries highlighted in the map below represent the top markets forUkraine’s exports of steel, each receiving more than 350,000 metrictons, and cumulatively accounting for 63 percent of Ukraine’s steelQuick Facts: 15.1 million metric tonsof exports in 2018 37% decline in steelexports since 2009 2018 export volume down1% and export value up18% since 2017 Exports as a share ofproduction stayed atremained constant at71.3% in 2017 and 2018 Top three markets: Italy,Turkey, Egypt Largest producers:Metinvest Holding,ArcelorMittal Kryvyi Rih,ISD 27 trade remedies ineffect involving steel millimports from Ukraine1
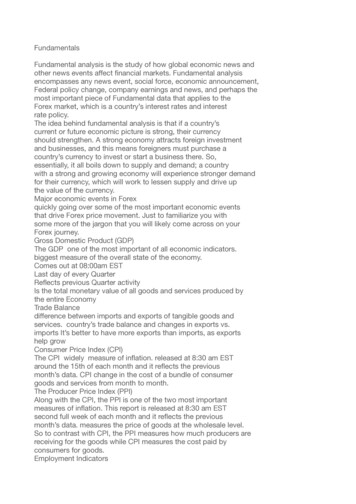
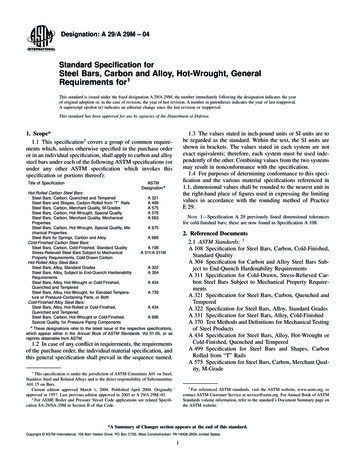
Steel Exports Report: UkraineSteel Trade Balance9.0Over the past decade, Ukraine hasmaintained a trade surplus in steel millproducts. Between 2009 and 2013,Ukraine’s steel trade surplus averaged23.1 million metric tons per year.Ukraine has seen a near steady declinein its steel trade balance between 2014and 2018, falling an average of 2.3million metric tons a year. Ukraine’ssteel trade surplus nonetheless stood at13.6 million metric tons in 2018, down2 percent from 13.8 million metric tonsin 2017.8.0Ukraine's Trade in Steel Mill ProductsMillions of Metric Tons7.06.05.04.03.0Exports2.0Imports1.00.02005 2006 2007 2008 2009 2010 2011 2012 2013 2014 2015 2016 2017 2018Source: U.S. Department of Commerce - IHS Ma rkit Global Trade Atl asExport Volume, Value, and ProductSince the most recent peak of 25.9 million metric tons in 2011, the volume of Ukraine’s steel exportshas been trending downwards, with exports decreasing by 42 percent. From 2017 to 2018, this trendcontinued, with Ukrainian steel export volumes down 1 percent. By contrast, the value of Ukraine’s2018 exports increased by 18 percent from 2017, reflecting a recent rise in global steel prices. Thevalue of Ukraine’s steel exports decreased by 54 percent over the entire period from 2011 to 2018.Semi-finished products accounted for the largest volume share of Ukraine’s steel exports at 43percent, or 6.4 million metric tons (mmt), in 2018, followed by flat products at 34 percent (5.2 mmt),long products at 19 percent (2.8 mmt), pipe and tube products at 4 percent (636 thousand metrictons), and stainless steel at 0.4 percent (58 thousand metric tons).9Ukraine's Exports of Steel Mill ProductsMillions of Metric Tons85Ukraine's Exports of Steel Mill ProductsBillions of U.S. Dollarsflatflatlonglong7pipe and tubepipe and 4321002016 20182016 20182016 20182016 20182016 20182016 2018Source: IHS Ma rkit Global Trade Atl as2016 20182016 2018Source: IHS Ma rkit Global Trade Atlas22016 20182016 2018
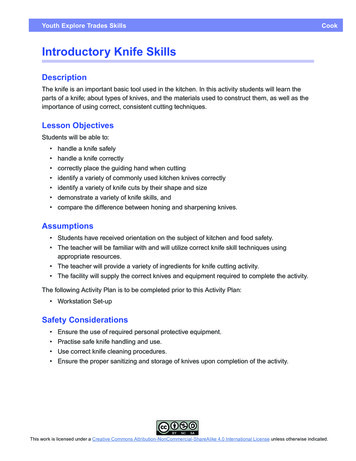
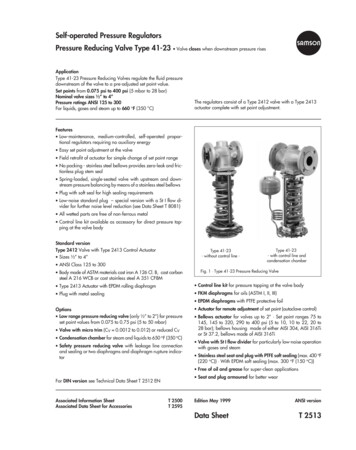
Steel Exports Report: UkraineExports by Top MarketUkraine's Steel Exports-Top 10 Markets,Exports to Ukraine’s top10steelmarketsrepresented 63 percent ofUkraine’s steel exportvolume in 2018 at 9.47million metric tons (mmt).Italy was the largestmarketforUkraine’sexports at 15 percent (2.32mmt), followed by Turkeyat 10 percent (1.58 mmt),Egypt at 8 percent (1.21mmt), Russia at 7 percent(998 thousand metrictons), and Poland at 5percent (749 thousandmetric tons).2018 - Percent of VolumeSource: U.S. Department of Commerce - IHS Markit Global Trade AtlasThe United States ranked18th as a destination forUkraine’s steel exports, receiving 205 thousand metric tons in 2018, down 21 percent from 2017.Trends in Exports to Top MarketsBetween 2017 and 2018, Ukraine’s exports decreased in volume to 6 of its top 10 export markets.Export volumes to Algeria showed the largest decrease, down 34 percent from 2017, followed byexports to Lebanon and Russia (bothPercent Change in Exports to Top 10 Markets (2017 - 2018)-25%), Iraq (-22%), Turkey (-5%),and Egypt (-4%). Over the sameItalyVolumeperiod, Ukraine’s exports to BulgariaTurkeyValueincreased 13 percent in volume,Egyptfollowed by the United KingdomRussia(5%), Poland (3%), and Italy (2%).PolandThe value of Ukraine’s exportsBulgariaincreased to 6 of its top 10 exportAlgeriamarkets in 2018. The UnitedKingdom had the largest increase,Iraqrising 28 percent. This is followedLebanonby the Bulgaria (24%), Italy (22%),United KingdomPoland (21%), Turkey (15%), and-50% -40% -30% -20% -10% 0% 10% 20%Egypt (14%). Ukraine’s exports to 4of its top export markets decreased Source: U.S. Department of Commerce - IHS Markit Global Trade Atlasin value with Algeria showing the largest decrease (-28%), followed by Russia (-13%),Lebanon (-13%) and Iraq (-4%).330% 40% 50%
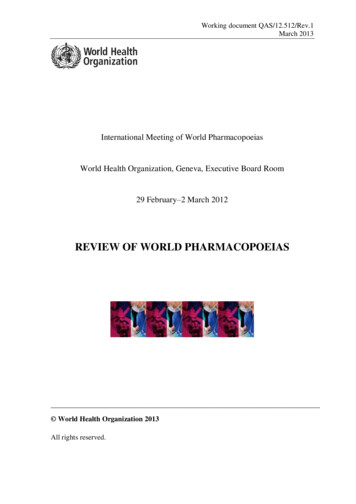
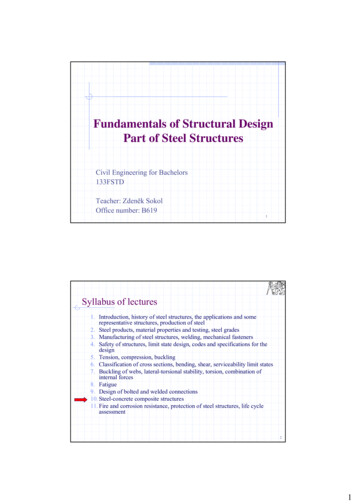
Steel Exports Report: UkraineTop Markets by Steel Product CategoryUkraine’s top export markets by volume vary across types of steel products, with a different countryreceiving the largest share of each product type.Russia received the largest share of Ukraine’s flat products in 2018 at 13 percent (651.8 thousandmetric tons), and was a top-five export destination in every category, except for semi-finishedproducts. Iraq received the largest share of Ukraine’s exports of long products at 14 percent (398.7thousand metric tons). Italy received the largest share of Ukraine’s semi-finished steel exports at33% (2.1 million metric tons), and Germany received the largest share of Ukraine's stainless steelexports at 30 percent (17.5 thousand metric tons).The United States received the largest share of Ukraine’s pipe and tube exports at 21 percent (130.5thousand metric tons) and was also a top-five export destination for Ukraine’s stainless steel,receiving 9 percent (5.1 thousand metric tons) of Ukrainian exports in this steel category.Semi-finishedPipe and TubeLong ProductsFlat ProductsUkraine's Top 5 Export Markets by Product - SenegalIsraelUnited riaBulgariaStainlessGermanyRussiaItalyUnited StatesUnited Kingdom00.511.52Mi l lions of Metric TonsSource: U.S. Department of Commerce - IHS Ma rkit Global Trade Atl as42.5
Steel Exports Report: UkraineUkraine's Import Market Share in Top DestinationsIn 2018, the import market share forUkraine’s steel products increased in halfof Ukraine’s top export destinations forwhich data are available. The share of theRussia’s steel imports from Ukraineincreased the most in 2018, up 5.7percentage points followed by importshares in Italy, and the United Kingdom,up 0.6 percentage points and 0.5percentage points, respectively. The shareof imports from Ukraine declined inBulgaria, Turkey, and Poland, down 3.1,2.1,and0.4percentagepoints,respectively, compared with 2017. Datafrom Algeria, Iraq, Lebanon, and Egyptwere unavailable for 2018.Ukraine's Steel Import Market ShareTop 10 ExportMarketsShare ofImportsfromUkraine2017Ukraine'sRank in2017Share 4%Iraq**N/ALebanon**N/AUnited Kingdom 4.9%Ukraine's Change inRank inShare201812N/A151N/A007N/AN/AN/AN/AAmong Ukraine’s top export markets, semi Source: IHS Markit Global Trade Atlas, based on import data per reporting country-finished steel comprised the largest share *2018 data unavailabe for Egypt and Algeriaof imports from Ukraine in Italy, at 92 **2017 and 2018 Data unavailable for Iraq and Lebanonpercent (2.3 million metric tons, MT) in 2018. Flat products comprised the largest share of steelimports from Ukraine in Turkey, at 26 percent (619.1 thousand MT). In Russia, long products tookthe largest share of steel imports from Ukraine, with 52 percent (1.2 million MT) of steel importsconsisting of long products.Steel Import Composition of Top Market-Share Countries-2018RussiaFlatLongStainlessPipe & TubeSemi-finishedTurkeyLongFlatPipe & TubeSemi-finishedStainlessItalyLongFlatPipe & TubeStainlessSemi-finished0.01.02.0Source: IHS Ma rkit Global Trade Atl as, based on i mport data per reporting country53.0Mi l lions of Metric Tons
Steel Exports Report: UkraineOverall Production and Export Share of ProductionUkraine’s crude steel production has steadily decreased from a peak of 25.9 million metric tons in2011. Production in 2018 decreased by 1 percent from 2017 to 15.0 million metric tons. Apparentconsumption (a measure of steel demand) has also shrunk from a peak of 11.4 million metric tons in2011 to a low of 6.0 mmt in 2015, but has subsequently increased to 7.6 mmt in 2018. Demand in2018 was up 2 percent from 2017 but still fell behind production by 13.5 million metric tons.Ukraine’s steel export share of production peaked at 78.9 percent in 2014 and has decreased nearly12 percentage points to 71.3 percent in 2018. From 2017 to 2018, export share of productionremained at 71.3 percent.10090Ukraine's Export Share of Production, Millions of Metric TonsExport share, percent, right 10ProductionApparent ConsumptionExportsExport Share of Production201120122013201420152016201720182009 2010 2011 2012 2013 125.924.124.621.517.818.215.215.180.0% 75.1% 73.3% 73.1% 75.1% 78.9% 77.2% 75.3% 71.3%71.3%Source: U.S. Depa rtment of Commerce, Worl d Steel As s oca ti on, IHS Ma rki t Gl oba l Tra de Atl a sTop ProducersUkraine’s steel production isheavily concentrated in threemajor companies: MetinvestHolding, ArcelorMittal KryvyiRih, and ISD (50.2% owned byMetinvest). The top two steelproducers together accounted forover 75 percent Ukraine’s totalsteel production in 2017, basedon available data.Ukraine's Top Steel Producers in 2017RankCompany1Metinvest HoldingPJSC ArcelorMittalKryvyi RihISD (Industrial Unionof Donbass)23Production(mmt)Main Products10Hot-rolled, plate, billet, bars, rails, pipe7Rebar, wire rod, billets, bars, sectionsN/AHot-rolled, cold-rolled, plate, pipeSource: World Steel Association; Metal Bulletin, Iron and Steelworks of the World Directory,2017; Company websites6
Steel Exports Report: UkraineTrade Remedies in the Steel SectorAntidumping duties (AD), countervailing duties (CVD), associated suspension agreements, andsafeguards are often referred to collectively as trade remedies. These are internationally agreed uponmechanisms to address the market-distorting effects of unfair trade, or serious injury or threat ofserious injury caused by a surge in imports. Unlike anti-dumping and countervailing measures,safeguards do not require a finding of an “unfair” practice. Before applying these duties or measures,countries investigate allegations and can remedy or provide relief for the injury caused to a domesticindustry. The table below provides statistics on the current number of trade remedies variouscountries have against steel mill products from Ukraine.Steel Trade Remedies in Effect Against Ukraine2Brazil3CanadaEgypt15Russia2European UnionIndia1Indonesia1ADSuspensionagreementsand undertakings4MexicoPakistan1Taiwan1Thailand1United StatesCVD301Source: World Trade Organization, through June 30, 2018223456Global Steel Mill Safeguards in EffectCountryGulf lippinesSouth AfricaProduct(s)Flat-rolled steelHot-rolled steel flat sheets and plates1) Flat-rolled products of iron or non-alloy steel; 2) I and H sections of other alloy steel1) Steel concrete reinforcing bar; 2) Steel wire rod and deformed bar in coil1) Cold-rolled sheets and plated or coated sheets; 2) Reinforcing bars and wire rodsSteel angle barsHot-rolled steel flat products1) Hot-rolled steel flat products with certain amounts of alloying elements; 2) Unalloyed hot-rolledThailandsteel flat products in coils and not in coils; 3) Structural hot-rolled H-beams with alloy1) Semi-finished and certain finished products of alloy and non-alloy steel; 2) Pre-paintedVietnamgalvanized steel sheet and stripSource: World Trade Organization, through September 30, 20187
Steel Exports Report: GlossaryApparent Consumption: Domestic crude steel production plus steel imports minus steel exports. Shipment data are notavailable for all countries, therefore crude steel production is used as a proxy.Export Market: Destination of a country’s exports.Flat Products: Produced by rolling semi-finished steel through varying sets of rolls. Includes sheets, strips, and plates. Usedmost often in the automotive, tubing, appliance, and machinery manufacturing sectors.Import Penetration: Ratio of imports to apparent consumption.Import Source: Source of a country’s imports.Long Products: Steel products that fall outside the flat products category. Includes bars, rails, rods, and beams. Used inmany sectors but most commonly in construction.Pipe and Tube Products: Either seamless or welded pipe and tube products. Used in many sectors but most commonly inconstruction and energy sectors.Semi-finished Products: The initial, intermediate solid forms of molten steel, to be re-heated and further forged, rolled,shaped, or otherwise worked into finished steel products. Includes blooms, billets, slabs, ingots, and steel for castings.Stainless Products: Steel products containing at minimum 10.5% chromium (Cr) offering better corrosion resistance thanregular steel.Steel Mill Products: Carbon, alloy, or stainless steel produced by either a basic oxygen furnace or an electric arc furnace.Includes semi-finished steel products and finished steel products. For trade data purposes, steel mill products are defined atthe Harmonized System (HS) 6-digit level as: 720610 through 721650, 721699 through 730110, 730210, 730240 through730290, and 730410 through 730690. The following discontinued HS codes have been included for purposes of reportinghistorical data (prior to 2007): 722520, 722693, 722694, 722910, 730410, 730421, 730610, 730620, and 730660.Global Steel Trade Monitor: The monitor provides global import and export trends for the top countries trading in steelproducts. The current reports expand upon the early release information already provided by the Steel Import Monitoring andAnalysis (SIMA) system that collects and publishes data on U.S. imports of steel mill products. Complementing the SIMA data,these reports provide objective and current global steel industry information about the top countries that play an essential rolein the global steel trade. Information in these reports includes global exports and import trends, production and consumptiondata and, where available, information regarding trade remedy actions taken on steel products. The reports will be updatedquarterly.Steel Import Monitoring and Analysis (SIMA) System: The Department of Commerce uses a steel import licensingprogram to collect and publish aggregate data on near real-time steel mill imports into the United States. SIMA incorporatesinformation collected from steel license applications with publicly released data from the U.S. Census Bureau. By design, thisinformation provides stakeholders with valuable information on the steel trade with the United States. For more informationabout SIMA, please go to http://enforcement.trade.gov/steel/license/.8
In 2017, Ukraine was the world's eleventh largest steel exporter. In 2018, Ukraine exported 15.1 million metric tons of steel, a 1 percent decrease from 15.2 million metric tons in 2017. Ukraine's exports represented about 4 percent of all steel exported globally in 2018, based on available data. The volume of Ukraine's 2018 steel exports was