Transcription
The MaterialFlows, EcologicalFootprints andCarbon Emissionsof Global IndustrySectorsCraig Simmons, Co-founder andTechnical DirectorIgnacio Gonzalez, Lead ResearcherBest Foot Forwardwww.bestfootforward.com
Outline OPB Programme – what is it? Global Sectors Analysis – BFF, GFN & SEI– Feasibility Phase (Feb-Oct 2005)– Development Phase (Nov 2005 – July 2006) Methodology DetailOverview of Sector & Country ResultsMapping Sectors to ‘Needs’Mobility Model
Global Industry Sector Analysis Early 2005: WWF approached BFF to assessfeasibility of producing ‘resource maps’ ofindustry sectors by Country Spring 2005: team formed of BFF, SEI and GFN June - October 2005: Feasibility Studycommissioned with three main outputs:– Methodology Report– Draft Global Resource Review– Model Industry Sector Report
Feasibility Phase Peer ReviewAll outputs subject to 2-stage review Internal Reviewers–––––––Oliver Greenfield (WWF)Steve Goldfinger (GFN)Mathis Wackernagel (GFN)Craig Simmons (BFF)Ignacio Gonzalez (BFF)Tommy Wiedmann (SEI)Stefan Giljum (SERI)Plus Industry Partners, Steering Group, ERM & ADLittle External Reviewers– Manfred Lenzen (Univ of Sidney),– Franz Berkhout (Univ of Amsterdam)– Joe Ravetz (Univ of Manchester)
Conclusions of Feasibility Study It IS possible to estimate material flow, ecologicalfootprints & CO2 emissions from different industry sectors but some outstanding data & methodology issues This ‘evidence base’ would be useful to industry partnersand policy-makers but later stages of analysis need to be undertaken in closecollaboration with industry partners to provide sector-specificoutputs Global Resource Review problematic without firstproducing evidence base – important to get ‘bigmessages’ clear and link industry output to human need
Where we are now Nov 2005 – Now: Capacity building, on-goingconsultations with AG, OECD, IEA & other data providers,internal review, methodology update Æ change in focusto needs & models Outputs of current work programme:– Evidence base for 31 Countries ( 10) and 48 sectors ( 7)using pre-release OECD IO tables for 2000 (prev. 1995)– OPB Methodology training – SERI and Envirocentre– ‘Global pies’ linking sector outputs to human needs(COICOP)– Model and data to illustrate global mobility scenarios
Methodology Outline Add in weblink toMethodolgoy report and otherdocumentation?
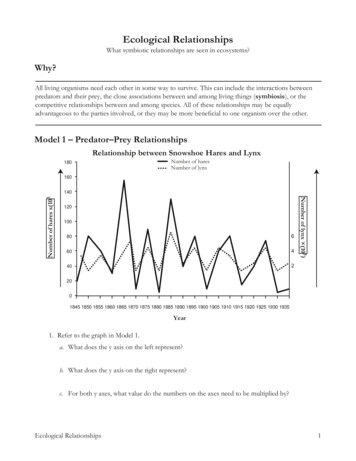
OPB MethodologyGeneral SchemeMaterial DE (MOSUS)CO2 Emissions (IEA)Footprint (GFN)Imports (COMTRADE)Input OutputAnalysis Source: OECD (2006) Coverage: 48 IndustrialSectors & 31 CountriesAnalysis linksfinal demand toupstream materialuse, footprint andcarbon emissionsfor each sector bycountry
OPB MethodologyGeneral SchemeMaterial DE (MOSUS)For each of the three analyses:CO2 Emissions (IEA) Data sources; resolution, datayears, formatFootprint (GFN)Imports (COMTRADE) Method for dealing withdomestic production andimports Allocation to IO sectors
OPB MethodologyMaterial Flow AnalysisMaterial DE (MOSUS) Material Domestic Extraction (DE) data– Developed by SERI during the course of MOSUSproject (www.mosus.net)– Format follows EUROSTAT (2001) guidelinesCO2 Emissions (IEA)– Four main groups (ktonnes):Footprint (GFN)Imports (COMTRADE) Biomass (152) – sum.to agric/forestry/fishingFossil Fuels (6) – summarised to coal/oil/gasMetal Ores (37) – summarised to ferrous/non-fIndust. & Construct. Minerals (65) – summarisedto industrial/construction– Coverage: 188 countries from 1980 to 2002– Following EUROSTAT (2001) guidelines, only ‘usedextraction’ was considered.
OPB MethodologyMaterial Flow AnalysisMaterial DE (MOSUS)CO2 Emissions (IEA)Footprint (GFN)Imports (COMTRADE)Example: France, 2002FRANCEDE (used - sum)Fossils (used)Metal Ores (used)I&C Minerals (used)Biomass 0 tons1000 tons1000 tons1000 tons1000 tons
OPB MethodologyMaterial Flow AnalysisMaterial DE (MOSUS)CO2 Emissions (IEA)Footprint (GFN)Imports (COMTRADE) Imports extracted fromCOMTRADE. Products categories follow SITC,Rev.1. Level of detail:– Groups: 625 (4-digit level)» Assumption: Imported materials are mappedto those sectors which outputs contain sameor similar products.» Only imports going to intermediate demandincluded
OPB MethodologyMaterial Flow AnalysisMaterial DE (MOSUS)CO2 Emissions (IEA)Footprint (GFN)Imports (COMTRADE)Allocation to IO sectors Fossil Fuels Æ IO Sector 3“Mining & Quarrying (Energy)”Metal Ores: Iron Æ IO Sector 12 “Iron & Steel”Non-Ferr. MetalsÆ IO Sector 13“Non-ferr. metals”I&C Minerals: I. Min. Æ IO Sector 11“Other non-metallic mineral products”C.Min Æ IO Sector 26“Construction”Biomass: Agri.& Fishing Æ IO Sector 1“Agriculture, hunting, fishing and forestry”.Forestry ÆIO Sector 6 “Wood & productsof wood and cork”
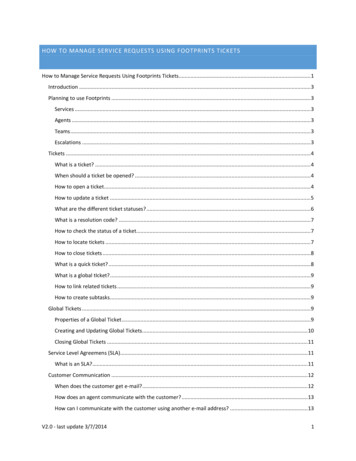
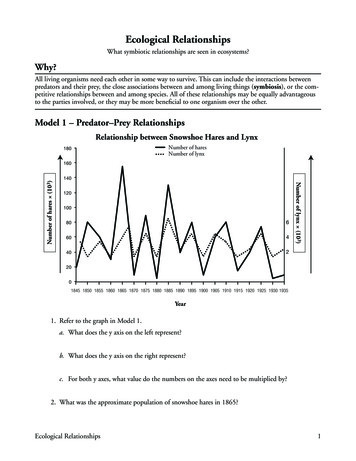
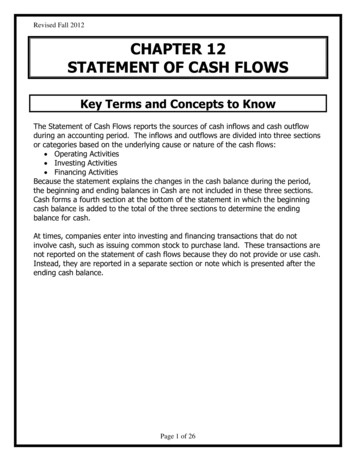
Italy: materials by sector
OPB MethodologyCO2 EmissionsMaterial DE (MOSUS) Domestic Production– Source: International Energy Agencywww.iea.orgCO2 Emissions (IEA)Footprint (GFN)Imports (COMTRADE)– CO2 Emissions for Fuel Combustiondatabase (2005 Edition)– Coverage: 30 OECD Countries (19602002) and over 100 Non-OECDCountries (1971-2002)– Level of detail:– 6 main groups– 33 sub-groups
OPB MethodologyCO2 EmissionsMaterial DE (MOSUS)CO2 Emissions (IEA)Footprint (GFN)Imports (COMTRADE) Example: France, 2002CO2 Sectoral ApproachPublic Electricity and Heat ProductionUnallocated AutoproducersOther Energy IndustriesManufacturing Industries and ConstructionTransportOther SectorsMt CO2/y380.2937.225.4518.7479.18140.8198.88
OPB MethodologyCO2 EmissionsMaterial DE (MOSUS)CO2 Emissions (IEA)Footprint (GFN)Imports (COMTRADE) Embodied in Imports– Calc. from Imports data (COMTRADE/NFA)– Calculation Process: NFA contains data for Embodied Energy(Gj/t) for materials. Data collated fromAlcorn, 1998; IVEM, 1999; and LCA.Exception of “Fuels, lubricants, ”: Datafrom DUKES.– Energy embodied in every imported category Converted to CO2/t using world averagecarbon
OPB MethodologyCO2 EmissionsMaterial DE (MOSUS) Example: France, 2002CO2 Emissions (IEA)Footprint (GFN)Imports (COMTRADE)Imports (t)Bovine cattle including buffa 17,561.04Sheep,lambs and es,asses,mules and hinn 3,860.30EmbodiedEnergy (Gj/t)4555.7631.2828.245Total Emb.Ener. 3.63Tonnes ofC15,804.949,565.285,535.684,659.903,474.27Tonnes ofCO257,951.4535,072.7120,297.4917,086.2912,739.00
OPB MethodologyCO2 EmissionsMaterial DE (MOSUS) Allocation to IO sectors Domestic productionCO2 Emissions (IEA)Footprint (GFN)Imports (COMTRADE)– IEA Sectoral disaggregation follows ISICRev.3 so allocation was quitestraightforward.– For those IEA categories whichcorresponded to more than one IO Sector,percentages out of total sectoral output wereused. Embodied in Imports– Followed the same allocation as the importedcategories which they were calculated from.
OPB MethodologyCO2 EmissionsMaterial DE (MOSUS) Allocation to IO SectorsIEA CategoryCO2 Emissions (IEA)Public Electricity PlantsPublic CHP PlantsIron and SteelFootprint (GFN)Imports (COMTRADE)Chemical and PetrochemicalIO Sector2626 28139 10Food and Tobacco4Domestic Air Transport35Road Transport33National Navigation34Machinery15 16 17 18 19
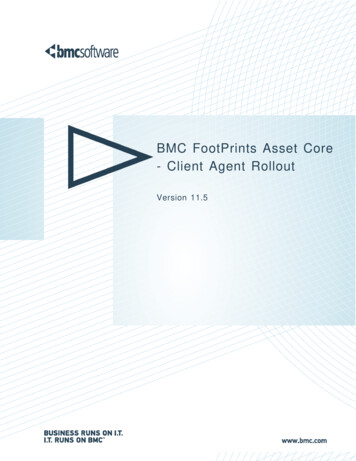
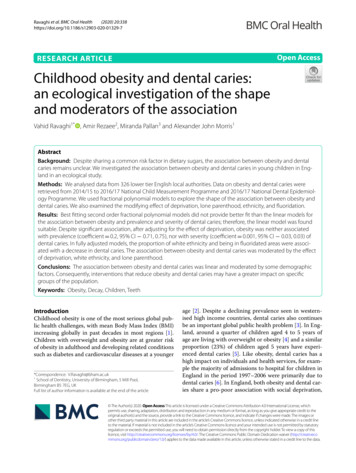
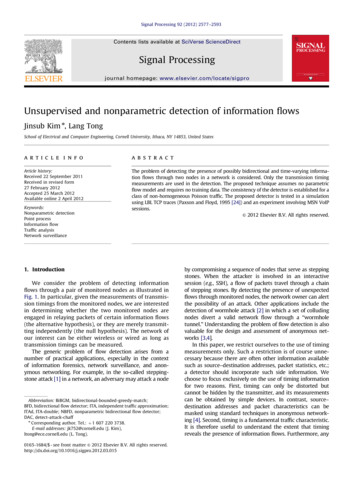
Italy: CO2 by sectorItalyTotal RequirementsOECD IOSector iculture, hunting, forestry and fishingMining and quarrying (energy)Mining and quarrying (non-energy)Food products, beverages and tobaccoTextiles, textile prods. leather & footwearWood and products of wood and corkPulp, paper, paper prods, print & pubsCoke, refined petroleum prods & nuclearChemicals exluding pharmaceuticalsPharmaceuticalsRubber & plastics productsOther non-metallic mineral productsIron & steelNon-ferrous metalsFabricated metal products, excpt m & eMachinery & equipment, necOffice, accounting & computing mach.Electrical machinery & apparatus, necRadio, television & communication eqptMedical, precision & optical instrumentsMotor vehicles, trailers & semi-trailersBuilding & repairing of ships & boatsAircraft & spacecraftRailroad equipment & transprt equip necManufact. nec; recycling (incl furniture)Production, collect & distrib of electricityManufact of gas; distrib of gas. fuels througSteam and hot water supplyCollection, purification & distrib of waterConstructionWholesale & retail trade; repairsHotels & restaurantsLand transport; transport via pipelinesWater transportAir transportSupport & aux transpt activities; travel agenPost & telecommunicationsFinance & insuranceReal estate activitiesRenting of machinery & equipmentComputer & related activitiesResearch & developmentOther Business ActivitiesPublic admin. & defence; social securityEducationHealth & social workOther community, soc. & pers. servicesPrivate households with employed personsTOTALCO2CO2 (Mtonnes) CO2 (Tonnes)(Mtonnes)-Embodied in-Embodied 01
OPB MethodologyEcological FootprintMaterial DE (MOSUS)CO2 Emissions (IEA)Footprint (GFN)Imports (COMTRADE) Source: NFA, 2005 GFNwww.footprintnetwork.org Coverage: 149 countries, timesseries:1961-2002 Based on UN/FAO/IEA statistics onproduction, imports, exports and yieldsfor resource and product categories. For a detailed description of the method,see Monfreda et al. (2004) andWackernagel et al (2004b).
OPB MethodologyEcological FootprintMaterial DE (MOSUS) Example: France, 2002CO2 Emissions (IEA)Footprint (GFN)Imports (COMTRADE)CroplandPastureSeaForestWood FuelEnergyfossil fuelsnuclearBuilt landHydro areaTOTALTotalStockExportsProduction ImportsConsumptionUseChanges(E)(P)(I)(SC)(P I SC(P I 010.010.015.742.83-0.068.502.825.61
OPB MethodologyEcological FootprintMaterial DE (MOSUS) CO2 Emissions (IEA)Footprint (GFN)Imports (COMTRADE)Allocation to IO sectors:– All land types except energy and builtland allocated to IO Sector 1 “Agriculture ”– Fossil Fuels Domestic Productionallocated using sectoral percentagesfrom CO2 Emissions (IEA data)– Fossil Fuels Imports allocated usingsectoral percentages from embodied CO2Emissions in imports– Nuclear & hydro land - IO Sector 26“Prod. Collec. & Distri. Of Electricity”.– Built land - IO Sector 30 “Construction”
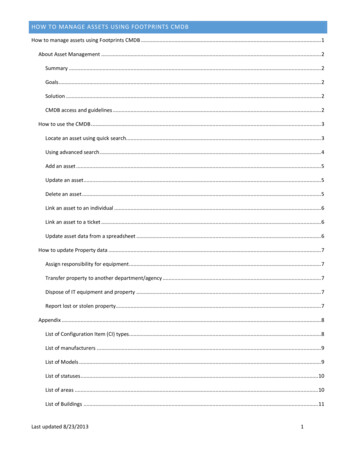
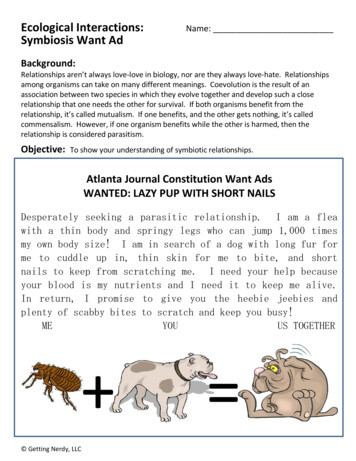
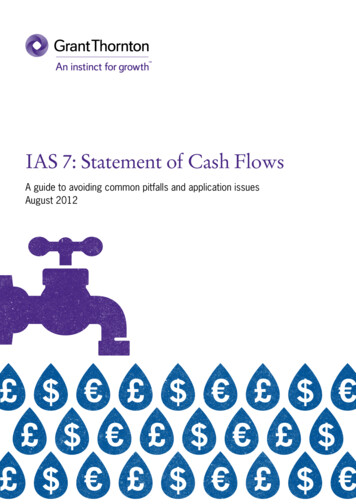
Italy: footprint by sectorOECD IOSector FCropland PastureAgriculture, hunting, forestry and fishingMining and quarrying (energy)Mining and quarrying (non-energy)Food products, beverages and tobaccoTextiles, textile prods. leather & footwearWood and products of wood and corkPulp, paper, paper prods, print & pubsCoke, refined petroleum prods & nuclearChemicals exluding pharmaceuticalsPharmaceuticalsRubber & plastics productsOther non-metallic mineral productsIron & steelNon-ferrous metalsFabricated metal products, excpt m & eMachinery & equipment, necOffice, accounting & computing mach.Electrical machinery & apparatus, necRadio, television & communication eqptMedical, precision & optical instrumentsMotor vehicles, trailers & semi-trailersBuilding & repairing of ships & boatsAircraft & spacecraftRailroad equipment & transprt equip necManufact. nec; recycling (incl furniture)Production, collect & distrib of electricityManufact of gas; distrib of gas. fuels througSteam and hot water supplyCollection, purification & distrib of waterConstructionWholesale & retail trade; repairsHotels & restaurantsLand transport; transport via pipelinesWater transportAir transportSupport & aux transpt activities; travel agePost & telecommunicationsFinance & insuranceReal estate activitiesRenting of machinery & equipmentComputer & related activitiesResearch & developmentOther Business ActivitiesPublic admin. & defence; social securityEducationHealth & social workOther community, soc. & pers. servicesPrivate households with employed personsTOTALEF SeaItalyTotal Requirements (gha)EFEFEnergyEF Forest EnergyFFFF 365,858,6554,925,937-85,64911,262,06
Footprint (GFN) Imports (COMTRADE) Embodied in Imports – Calc. from Imports data (COMTRADE/NFA) – Calculation Process: NFA contains data for Embodied Energy (Gj/t) for materials. Data collated from Alcorn, 1998; IVEM, 1999; and LCA. Exception of “Fuels, lubricants, ”: Data from DUKES. – Energy embodied in every imported category