Transcription
Research Journal of Applied Sciences, Engineering and Technology 6(3): 387-392, 2013ISSN: 2040-7459; e-ISSN: 2040-7467 Maxwell Scientific Organization, 2013Submitted: July 17, 2012Accepted: August 28, 2012Published: June 15, 2013Analysis and Simulation of Drainage Capacity of Urban Pipe Network1Wenting Zhang, 1Xingnan Zhang and 2, 3Yongzhi LiuNational Engineering Research Center of Resources Efficient Utilization and Engineering Safety, HohaiUniversity, Nanjing 210098, China2The State Key Laboratory of Hydrology-Water Resources and Hydraulic Engineering, NHRI,3Hydrology and Water Resources Department, Nanjing Hydraulic Research Institute,Nanjing 210029, China1Abstract: With the rapid development of urbanization, impervious areas spread quickly, which have greatlyinfluenced regional hydrology and water resources. The water quality is getting worse and worse. The flood anddrought disasters have aggravated. Human living environment has changed and consequently sustainabledevelopment of economy is restricted. The drainage pipe network plays a very important role in urban drainage andflood control. In the study, using of computer technology, the drainage capacity of study area in different designrainstorm return periods (P 0.25, 0.5, 1, 2, 5, 10 a, respectively) is analyzed and simulated by Storm WaterManagement Model (SWMM). Part of the pipe network that are filled slowly and change great are found out fewerthan 6 design rainstorms, which provide the basis for reconstruction of urban conduits. The simulation results canprovide strong technical support for the city drainage system planning and management.Keywords: Drainage capacity, modeling, numerical simulation, pipe network, SWMMuse changes and city construction. Face this issue, thedrainage network in many cities start to redesign andtransformation, in order to meet the needs of the city'sdrainage capability.In this background, the storm water managementmodel (referred to as the SWMM model) has beenapplied in this study; the drainage capability in designstorm conditions of Yuhua District in Nanjing city wassimulated. Through simulation, provide the basis for thedesign and reconstruction of the actual pipe network, toavoid the city water logging disaster.INTRODUCTIONDue to the urbanization, the city population and theimpervious areas are increasing. These two parts willalso lead to other aspects of problems. First, theprecipitation that falls on impervious surfaces becomessurface runoff which is connected directly to the sewernetwork. This will increase peak flows and decreasespeak flow lag times. The drainage system must be ableto cope with the increased peak flows to reduce potentialdamage and inconvenience. But the initial sewernetwork's capacity has been not enough to contain allthe runoff from surface; the exceeding surface runoffwill cause urban flooding. Second, because of the largecity and its population, the demand of water resourceswill also increase sharply.The drainage network as an important andindispensable infrastructure for city, which is using forcity Underground Drainage, drainage, flood controlworks. With the accelerating progress of urbanization,drainage task assumed by the drainage network becomeheavier. In many cities, the existing drainage networkdue to the construction of age-old design, the drainagecapacity is lack (Parka et al., 2008); drainage capabilitycan no longer meet the increasing demand of urban landBASIC THEORY OF SWMMThe EPA Storm Water Management Model(SWMM) is a dynamic rainfall-runoff simulation modelused for single event or long-term (continuous)simulation of runoff quantity and quality from primarilyurban areas. It was used in Tianjin and Shanghai city(Liu and Xu, 2001). This model is mainly used in smallcities’ runoff and water quality forecasting, riverdrainage simulation and compute and drainage pipenetwork system verification and management. It consistsof runoff yield model, infiltration model, surface runoffconcentration model and pipe hydraulic dynamic model(Wang and Xu, 2008).Corresponding Author: Wenting Zhang, National Engineering Research Center of Resources Efficient Utilization andEngineering Safety, Hohai University, Nanjing 210098, China387
Res. J. Appl. Sci. Eng. Technol., 6(3): 387-392, 2013RUNOFF YIELD MODELThe process of rainfall turning into net rain is calledrunoff yield. Based on the land use status and surfacedrainage directions, study area is discredited into severalsub catchments. According to the hydrology differences,each Sub catchment can be divided into pervious andimpervious sub areas. Surface runoff can infiltrate intothe upper soil zone of the pervious subarea, but notthrough the impervious subarea. Impervious areas arethemselves divided into two subareas - one that containsdepression storage and another that does not. Thosethree subareas’ runoff yield is computed separately andthe sub catchments’ runoff is the sum of subareas.Surface runoff concentration model: The task ofsurface runoff concentration is to convert the subareas’net rainfall process into sub catchments’ dischargeprocess. In SWMM, this task is realized by making threesubareas approximated as nonlinear reservoir. Namely,solving continuity equation and Manning Formulasimultaneously. It is a lumped model.𝑄𝑄𝑔𝑔𝑔𝑔 𝑄𝑄 𝐴𝐴(1)1𝑔𝑔𝑔𝑔 ℎ 𝑆𝑆𝑓𝑓 𝑆𝑆0 0 Steady flow: Steady Flow routing represents thesimplest type of routing possible (actually norouting) by assuming that within eachcomputational time step flow is uniform and steady.Thus it simply translates inflow hydrographs at theupstream end of the conduit to the downstream end,with no delay or change in shape. The normal flowequation is used to relate flow rate to flow area (ordepth).Kinematic wave: This routing method solves thecontinuity equation along with a simplified form ofthe momentum equation in each conduit. The latterrequires that the slope of the water surface equal theslope of the conduit. The maximum flow that can beconveyed through a conduit is the full normal flowvalue. Any flow in excess of this entering the inletnode is either lost from the system or can pond atopthe inlet node and be re-introduced into the conduitas capacity becomes available. Kinematic waverouting allows flow and area to vary both spatiallyand temporally within a conduit. This can result inattenuated and delayed outflow hydrographs asinflow is routed through the channel. However thisform of routing cannot account for backwatereffects, entrance/exit losses, flow reversal, orpressurized flow and is also restricted to dendriticnetwork layouts. It can usually maintain numericalstability with moderately large time steps, on theorder of 1 to 5 min. If the aforementioned effectsare not expected to be significant then thisalternative can be an accurate and efficient routingmethod, especially for long-term simulations.Dynamic wave: Dynamic Wave routing solves thecomplete one-dimensional Saint Venant flowequations and therefore produces the mosttheoretically accurate results. These equationsconsist of the continuity and momentum equationsfor conduits and a volume continuity equation atnodes. With this form of routing it is possible torepresent pressurized flow when a closed conduitbecomes full, such that flows can exceed the fullnormal flow value. Flooding occurs when the waterdepth at a node exceeds the maximum availabledepth and the excess flow is either lost from thesystem or can pond atop the node and re-enter thedrainage system. Dynamic wave routing canaccount for channel storage, backwater,entrance/exit losses, flow reversal and pressurizedflow. Because it couples together the solution forboth water levels at nodes and flow in conduits it Pipe hydraulic dynamic model: The pipe flow routingin SWMM is calculated by conservation of mass andconservation of energy formula. And three solvingmethods are supplied: Steady Flow, Kinematic Waveand Dynamic Wave (Rui, 2004): Infiltration model: Infiltration is the process of rainfallpenetrating the ground surface into the unsaturated soilzone of pervious sub catchments areas. SWMM offersthree choices for modeling infiltration: Horton'sEquation, Green-Ampt Method and SCS Curve NumberMethod. Horton's Equation mainly describes therelationship that infiltration intensity changes withrainfall duration and does not reflect the underlyingsurface status of saturated and unsaturated zone. GreenAmpt Method assumes that a sharp wetting front existsin the soil column, separating soil with some initialmoisture content below from saturated soil above. Asufficient rainfall and infiltration process can make thesoil saturated. SCS Curve Number Method assumes thatthe total infiltration capacity of a soil can be found fromthe soil's tabulated Curve Number. During a rain eventthis capacity is depleted as a function of cumulativerainfall and remaining capacity. txSfSo(2)where,Q Discharge, m3/sA Area of the wetted cross section, m2h Pipe water depth, m388Time, sPipe length along the water directionResistance slopePipeline slope
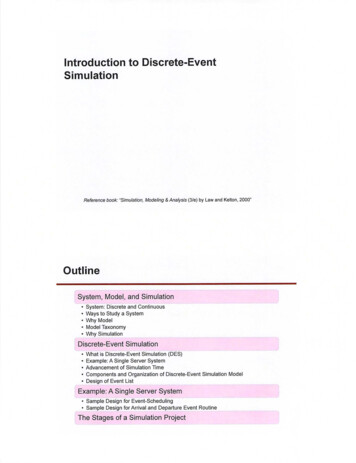
Res. J. Appl. Sci. Eng. Technol., 6(3): 387-392, 2013can be applied to any general network layout, eventhose containing multiple downstream diversionsand loops. It is the method of choice for systemssubjected to significant backwater effects due todownstream flow restrictions and with flowregulation via weirs and orifices. This generalitycomes at a price of having to use much smaller timesteps, on the order of a minute or less (SWMM canautomatically reduce the user-defined maximumtime step as needed to maintain numerical stability).is located in the Yuhua District, Nanjing, JiangsuProvince, which an area of 950.28 ha, an averagegradient of 4.67%, including residential area accountedfor 28%, road area accounted for 9.98%, other land andgreen area accounted for 62.02%.The drainage capacityof the study area as Fig. 1.Subcatchment division: Need to division the study areawhen use the swmm model to simulation, which processincluding division the whole catchment into several subcatchments and generalization each sub-catchmentshydrological characteristics. In the cities, existence ofreal sub-catchment areas, but due to the development ofthe city's own characteristics and urbanization change ofsurface condition, so leading to determine its true subcatchment areas become difficult. If reasonablydetermine the sub-catchment areas, makes the modelsimulation results to better fit the actual situation. Inorder to better divide sub-catchment areas and try tosimplify the model input data in the condition of ensureits simulation accuracy, this study use an approachescombination the road and DEM of the study area.Through the method using the Hydrological Analysisdivision the study area and then using the land use mapwith artificial merger and adjustment, which finalcompletion the division of the sub-catchmentEach of these routing methods employs theManning equation to relate flow rate to flow depth andbed (or friction) slope. The one exception is for circularForce Main shapes under pressurized flow, where eitherthe Hazen-Williams or Darcy-Weisbach equation isused instead.THE APPLICATION OF SWMM INSTUDY AREAThe surface area, catchment area width, slopegradient, the Manning roughness coefficient, infiltrationrate, the length of the pipeline, pipeline diameter andother data is necessary input of the model. In order toevaluation the drainage capacity of the study area, firstneed to build model of the research area. The study areaFig. 1: Drainage system of study area389
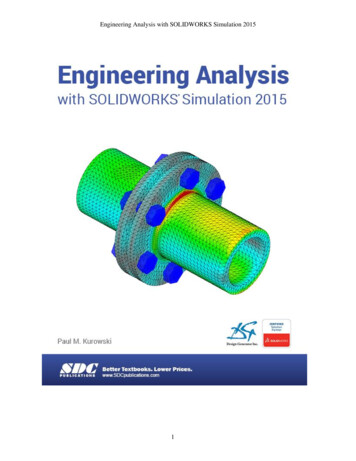
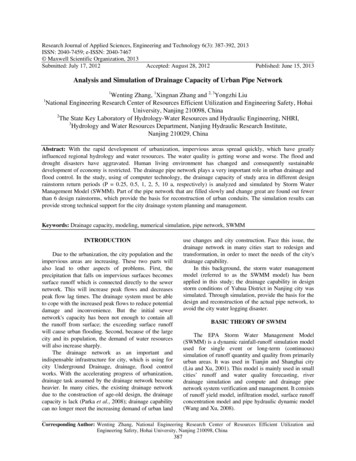
Res. J. Appl. Sci. Eng. Technol., 6(3): 387-392, 2013600.00Rainfall intensity (L/S.hm-2)areas. When determined the sub-catchment areas, thenuse the geostatistical module in ArcGIS to calculate theslope, area, SWMM model parameters, of each subcatchment areas, which provide a reliable and fastguarantee for build the model (Tang and Yang, 2006).Model parameter calibration: SWMM parameters canbe divided into two kinds: surface input parameters andpipe input parameters. Surface input parameters in thisarea consist of : characteristic width of the overlandflow path for sheet flow runoff, area of the subcatchment, Percent of the impervious land area, averagepercent slope of the sub catchment, Manning's n foroverland flow over the sub catchment including theimpervious portion and pervious portion, depth ofdepression storage and infiltration parameters. Pipeinput parameters consist of: conduit cross-section,conduit length, Manning's roughness coefficient,maximum depth of the conduit's cross section, conduitelevation. Because water lagging, water concentrationtime and outflow hydrograph are affected by W(characteristic width of the overland flow path for sheetflow runoff), W is temporarily fixed as a constant, usingthe real rainfall event to calibrate.2989.3(1 0.6711𝑔𝑔𝑔𝑔 )(𝑡𝑡 80.00060.040.0020.000.000.00Time (min)Fig. 2: Different frequency distribution of storm intensityIn China, the storm sewer design return period isgenerally used in 1 to 3, for important areas, generallyused in 2 5a. In order to test the drainage capacity ofthe pipeline network in the condition of differentfrequency rainstorm, using the type (3) seek the returnperiod P 0.25 a and 0.5, 1, 2, 5, 10 a, respectivelyheavy rain intensity distribution, as shown in Fig. 2.According to the storm intensity, seek thecorresponding frequency of rainfall process line.Rainfall used in the simulation time interval of fiveminutes, the rainfall lasted for 1 h, calculate thecorresponding frequency of rainfall is 34.14, 45.71,57.28, 68.85, 84.14, 95.71mm, respectively.Rainfall data selection: Using SWMM model tosimulate the rainfall data is very importance, especiallywhen the rainfall data can reflect the actual rainfall; thisrainfall data will improve precision of the modelsimulation results. Different regional climate differencesand resulting differences in rainfall patterns, law ofdistribution of rainfall is suitable for what kind of curve,which requires a lot of statistical analysis on the basis ofsummed up. Commonly used synthetic storm modelapproach has Huff, CHM, PC and YC (Xu, 2009). In thedomestic applicability of better synthetic rainstormmodel is Chicago synthetic storm hydrograph (CHMmethod), it is by of Keifer and Chu (1957) storm sewersystem in Chicago put forward a synthetic rainstormprocess line. In recent years, many regions through theheavy rain observation data of arrangement put forwardthe suitable for all heavy rains in strength formula.Access to relevant information, according to theMeteorological Research Institute of Nanjing stormintensity formula, select the study area storm intensityformula as follows:𝑞𝑞 P 0.25aP 0.50aP 1.00aP 2.00aP 5.00aP 10.00a500.00SIMULATION RESULTS ANALYSISIn order to analysis the drainage capacity of thestudy area, this study selecting the check wells andpipelines simulation results. The result of the timeseries is for every 5 min read and the total time is 6 h.Analysis of water depth in check wells: Whendrainage pipe network’s load is too large, the checkwells was easy to produce water, also was likely toexceed its maximum drainage capacity. So check thewell’s water depth can be used as an indicator toreflect the drainage capacity of the pipe network.Figure 3 shows inspection wells node J1 - J108which connection the network C13, C18 and C46 in thecase of 10a’s rainstorm the water depth of the checkwells and pipe network. Through the figure can see thecondition of the drainage pipe network.The study area contains 109 check wells; eachinspection wells have a maximum allowable depth andexceeds the maximum allowable depth of rain is easy tooverflow. In the different frequency of heavy rainconditions, according to the simulation results, can bedrawn from the wells of each check node maximum(3)whereq Rainfall intensity, L/(S.hm2)p Design rainfall return period, at Duration of rainfall, min390
Elevation (m)J18J1J44Res. J. Appl. Sci. Eng. Technol., 6(3): 387-392, 2013a diagram of the inspection wells J 18 in the conditionsof P 10 a design storm conditions, the water’s depthchange figure. Be seen from the statistical results, J 24and J 18 of the maximum depth of approximately thesame time in different rainstorm case. This is mainlydue to using Storm Data rain type peak on the first fewminutes, resulting in the maximum depth of the checkwells in about 10 min. Contrast the biggest water depthduration and average water depth, J 18 is far larger thanJ 24. Exists the difference is mainly J 24 inflow mainlyfrom sub-catchment area of rain water through surfacerunoff into the pipe , but J18 in addition to the inflowcatchment areas, as well as other multi-stage pipelineconvergence. Evaluation of regional drainage capacity,J18 type checking wells can be used as an importantbasis. In the condition of P 0.25a, 0.5a, 1a, 2a, 5a,10a, obtain the proportion of the total of the time ormore than one hour of inspection wells were 14.7, 17.4,23.9, 32.1, 38.5, 41.3%, respectively of which thelongest duration of nearly 2 h. The maximum waterlasted for more than 1 h of this part of the inspectionwells, which connection’s pipeline networks areplaying a key role in the transformation of the drainageof the study area. This part of the pipeline networkreconstruction is very ance (m)2500300056Fig. 3: Water elevation profile: NodeJ1-J182.5Depth (m)2.01.51.00.50.001234Elapsed (hrs)Analysis of drainage capacity: The result of the checkwell can reflection part of the condition of the pipenetwork, but detailed situations should be the stateanalysis on pipeline network for water. The study areahas 108 pipes and the total length is about 31 km.Pipeline flow in the duration of the full flow state iscalled the pipeline full flow time and pipeline full flowtime can reflect the drainage load of the pipe network.When the full flow a long time, on the ground may haveserious water and which explain that the drainagecapacity of the pipe network was inadequate. In thecondition of P 0.25, 0.5, 1, 2, 5, 10 a, respectively thepipeline full flow time was different. The Table 2 is thepipeline full flow time distribution range tale.Full flow time distribution range tale. Combinedwith Table 2, we can see that the pipe network of thestudy area in the case of different frequency designstorm, with the increase of rainfall intensity, thepipeline full flow time becomes longer and number wasincrease. From the statistics result, when p is small,20.4% of the pipeline in study area full flow a longtime, as P increases, 57.4 percent of the pipeline fullflow a long time. This 57.4% of the pipeline played alimited role to the research area. Find out this part ofthe pipeline, combined with the parameters and theposition in the drainage pipe, can be found that themain reason for this is to produce a larger catchmentarea, a smaller pipe diameter and slope. Such as theFig. 4: Water depth of node J 18Table 1: The see per time of J 24 and J 18P/a0.25 0.51J24 M time/h/min0:11 0:10 0:10Average/depth /m 0.17 0.18 0.18Duration time4.2 4.34.5/minJ18 M time/h/min0:07 0:07 0:07Average depth /m 0.45 0.45 0.46Duration time73.8 74.4 .47780:06 0:060.48 0.498182.2Table 2: The time of surcharge ----------Number0.250.512510Full lowt 021151311 10 8time /min 0 t 3043353333 31 3330 t 60 22242111 5560 t22344153 62 62depth of occurrence time and duration time. There aretwo type inspections well; one is connected to a singlepipeline and the other connecting section of thepipeline. Table 1 is the result of the connection ofsingle and multistage pipeline which the nameisinspection wells J 24 and J 18 contain the averagewater depth and maximum depth of duration in thedifferent frequency of heavy rain conditions. Figure 4 is391
Res. J. Appl. Sci. Eng. Technol., 6(3): 387-392, 2013main drainage channels C56, diameter of only 400mm,the slope is only 0.002, but bear the confluence ofseveral sub-catchment areas. Through simulation, wecan see that the problems of the existing pipe networkof the study area, mainly due to the lack of pipedrainage capacity, thereby affecting the drainage of theentire region in a big rainstorm case, this shortfall wasmore pronounced. According to these pipes networkspecific condition, we can put forward thecorresponding improvement plan in the actual networkof transformation.The Key Program of National Natural ScienceFoundation of China(41030636); The FundamentalResearch Funds for the Central Universities(2011B04414); Open fund of state key laboratory ofhydro science and engineering. Tsinghua University(sklhse-2008-A-03); and ministry of water resources'scientific special funds for non-profit public industry(201101053).CONCLUSIONKeifer, C.J. and H.H. Chu, 1957. Synthetic stormpattern for drainage design. ASCE J. HydraulicsDivision, 83(HY4): 1-25.Liu, J. and X. Xu, 2001. City storm model in Tianjinurban drainage analysis calculation. Hehai Water,1: 9-11.Parka, S.Y., K.W. Leeb, I.H. Parkb and S.R. Ha, 2008.Effect of the aggregation level of surface runofffields and sewer network for a SWMM simulation.Desalination, 226: 328-337.Rui, X., 2004. Hydrology Principle. Water Power Press,Beijing, China.Tang, G. and X. Yang, 2006. ArcGIS GeographicInformation System Spatial Analysis ExperimentalCourse. Science Press, Beijing, China.Wang, X. and Z. Xu, 2008. Study on simulation modelof city rain water flood development. Proceedingof Conference on China Water ConservancySociety, China Water Power Press, Beijing, 2:931-939.Xu, Z., 2009. Hydrological Model. Science Press,Beijing, China.REFERENCESIn this study, in the case of different frequencydesign storm drainage capacity of the regional pipelinenetwork changes, provide a reference to the actualidentification of the drainage capacity of the pipenetwork. The study found that the regional networkdesign storm in return period is small, can satisfy thedrainage requirements, but when the rain gets largereturn period, especially when P increased to 5 or 10 a,the network has 57.4% of the pipeline full flow over along period of time, which cause the rain overflow,produce the submerged. Combined with the actualrequired drainage requirement, Statistical problems incharge of this network, we can make targeted to improvethe program. At the same time, based on the powerfuldrainage system simulation function of SWMM model,the model can also be used for improvement andassessment of city drainage system planning programand can provide strong technical support for the citydrainage system planning and management.ACKNOWLEDGMENTThis study was supported by the National NaturalScience Foundation of China (41101510), (41101504);392
The drainage pipe network plays a very important role in urban drainage and flood control. In the study, using of computer technology, the drainage capacity of study area in different design rainstorm return periods (P 0.25, 0.5, 1, 2, 5, 10 a, respectively) is analyzed and simulated by Storm Water Management Model (SWMM).