Transcription
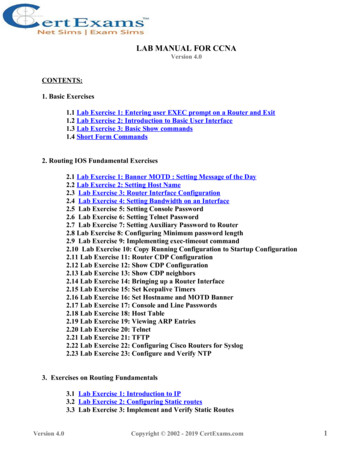
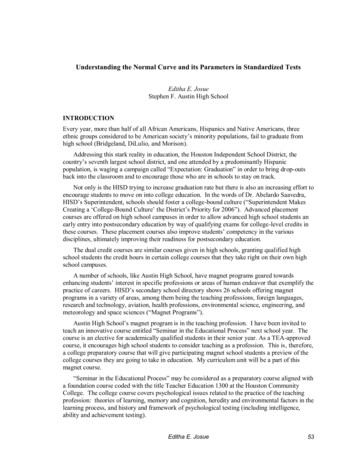
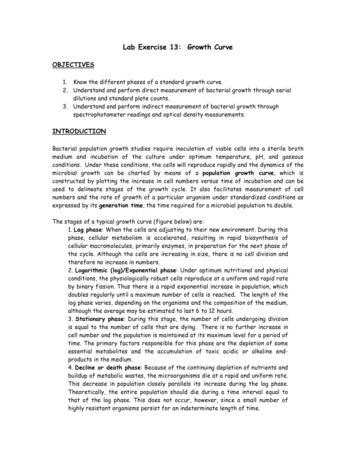
Lab Exercise 13: Growth CurveOBJECTIVES1. Know the different phases of a standard growth curve.2. Understand and perform direct measurement of bacterial growth through serialdilutions and standard plate counts.3. Understand and perform indirect measurement of bacterial growth throughspectrophotometer readings and optical density measurements.INTRODUCTIONBacterial population growth studies require inoculation of viable cells into a sterile brothmedium and incubation of the culture under optimum temperature, pH, and gaseousconditions. Under these conditions, the cells will reproduce rapidly and the dynamics of themicrobial growth can be charted by means of a population growth curve, which isconstructed by plotting the increase in cell numbers versus time of incubation and can beused to delineate stages of the growth cycle. It also facilitates measurement of cellnumbers and the rate of growth of a particular organism under standardized conditions asexpressed by its generation time, the time required for a microbial population to double.The stages of a typical growth curve (figure below) are:1. Lag phase: When the cells are adjusting to their new environment. During thisphase, cellular metabolism is accelerated, resulting in rapid biosynthesis ofcellular macromolecules, primarily enzymes, in preparation for the next phase ofthe cycle. Although the cells are increasing in size, there is no cell division andtherefore no increase in numbers.2. Logarithmic (log)/Exponential phase: Under optimum nutritional and physicalconditions, the physiologically robust cells reproduce at a uniform and rapid rateby binary fission. Thus there is a rapid exponential increase in population, whichdoubles regularly until a maximum number of cells is reached. The length of thelog phase varies, depending on the organisms and the composition of the medium,although the average may be estimated to last 6 to 12 hours.3. Stationary phase: During this stage, the number of cells undergoing divisionis equal to the number of cells that are dying. There is no further increase incell number and the population is maintained at its maximum level for a period oftime. The primary factors responsible for this phase are the depletion of someessential metabolites and the accumulation of toxic acidic or alkaline endproducts in the medium.4. Decline or death phase: Because of the continuing depletion of nutrients andbuildup of metabolic wastes, the microorganisms die at a rapid and uniform rate.This decrease in population closely parallels its increase during the log phase.Theoretically, the entire population should die during a time interval equal tothat of the log phase. This does not occur, however, since a small number ofhighly resistant organisms persist for an indeterminate length of time.
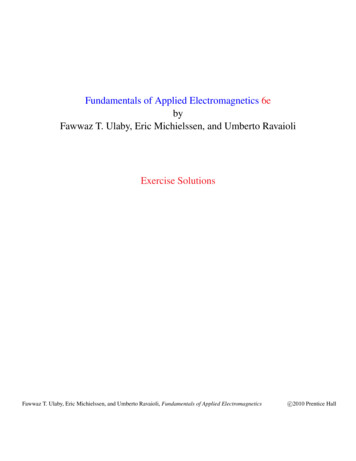
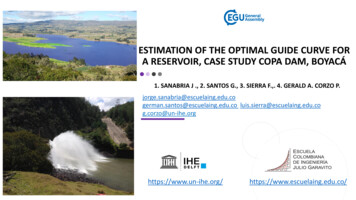
Construction of a complete bacterial growth curve requires that aliquots of a 24-hourshake-flask culture be measured for population size at intervals during the incubationperiod, however, such a procedure does not lend itself to a regular laboratory session. Thisexperiment is designed to include only the lag, log and possibly stationary phases ofpopulation growth. Upon completion of this experiment, you will plot the data collectedduring this experiment by using two values for the measurement of growth. The directmethod requires that you use serial dilution to plate out cells at 30 minute intervals in orderto calculate the number of colony forming units (CFUs) at a given time. The indirect methoduses spectrophotometric measurements of the developing turbidity at the same 30-minuteintervals, as an index of increasing cellular mass (assumed to correlate with an increase inthe number of cells).You will determine generation time with indirect and direct methods by using data youcollect, once it has been plotted onto a graph like the one shown below. Indirectdetermination is made by simple extrapolation from the log phase as illustrated in thefigure below. Select two points on the optical density (OD) scale, such as 0.2 and 0.4, thatrepresent a doubling of turbidity. Using a ruler, extrapolate by drawing a line between eachof the selected optical densities on the ordinate and the plotted line of the growth curve.Then draw perpendicular lines from these end points on the plotted line of the growth curveto their respective time intervals on the abscissa. With this information, determine thegeneration time as follows:
GT t(O.D. 0.4) ‐ t(O.D. 0.2)GT 90 minutes ‐ 60 minutes 30 minutesThe direct method uses the log of cell number scale on the growth curve and the followingformula:GT t log 2/[log b ‐ log B]Where GT generation time; B number of bacterial CFUs at some point during the logphase; b number of bacterial cells at a second point of the log phase; and t time in hoursor minutes between Band b.
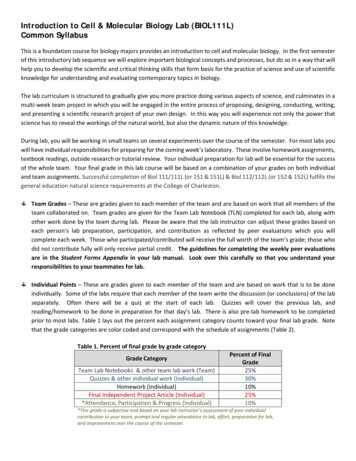
LAB EXERCISESI. Indirect growth measurements- the spectrophotometer and optical densityTable suppliesSpectrophotometerTeam suppliesSide arm flask with E. coli in TSB (eachtable will have a different start timefor inoculation)Media blanksProtocol:1. Starting at time 0, you will do the following every 30 minutes for a total of 4 time points:1. Set and calibrate the spectrophotometer. To do this, set the wavelength knob(top of instrument) to 600 nm. Then, adjust the meter needle to zero byrotating the zero control knob (left side, front of instrument, see figure below).2. Blank the spectrophotometer. To do this, insert a test tube containing themedium you are using (called a blank) into the sample holder. Adjust the meterneedle to read 100 % transmittance by rotating the light control knob (right side,front of instrument, see figure below).3. Remove the blank from the instrument.4. Swirl culture flask to resuspend organisms and carefully pour medium into sidearm. Wipe down the side arm if it is at all dirty on the outside. Insert side arm intosample holder. Try to maintain the same orientation of arm to flask for each timepoint reading.5. Read and record the % transmittance and the optical density (OD) of theculture.
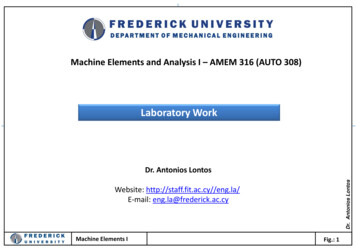
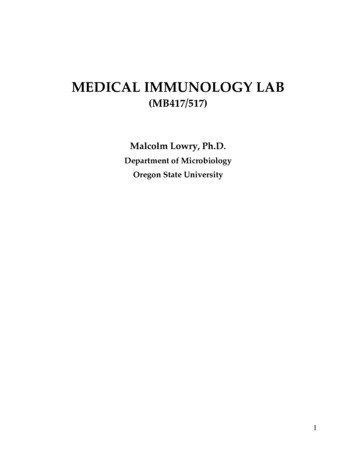
II. Direct growth measurements: serial dilutions and standard plate countsClass suppliesShaking 37 C incubatorTeam suppliesSide arm flask containing E. coli in TSB(each table will have a different start timeof inoculation)4 dilution blanks (9.9 ml water)16 dilution blanks (9 ml water)16 TSA platesp200 pipettep1000 pipettePipette tips for both pipettesTurn tableMetal spreaderAlcoholProtocol:1. Your flask will be inoculated by the instructor prior to class and allowed to incubate at37 C in a shaking incubator during lecture.2. Starting at time 0, you will do the following every 30 minutes for a total of 4 time points(see figure below):1. Label one (1) 9.9 ml dilution blank O. Label four (4) 9 ml dilution blanks I- IV.Label 4 plates with time point (i.e. 0, 30m, 60m, 90m) and dilution factor (i.e. 10-4,10-5, 10-6, 10-7).2. Remove 100 µl of culture from the side-arm flask and add to dilution blank O.Mix thoroughly by rolling in hands. DO NOT shake the dilution blanks asmaterial will spill out.3. Remove 1 ml from dilution blank O and add to dilution blank I. Mix thoroughlyby rolling in hands.4. Remove 1 ml from dilution blank I and add to dilution blank II. Mix thoroughlyby rolling in hands.5. Repeat serial dilution with blanks III and IV.100 µl1 mlDilution blankOBlank volumeDilution factor1 ml1 ml1 mlIIIIIIIV9.9 ml9 ml9 ml9 ml9 ml-2-3-41010100 µl10-4-510100 µl10-510100 µl10-610-6100 µl10-7
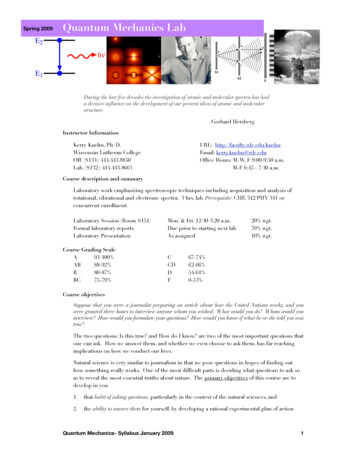
6. Top spread 100 µl from dilution blanks I, II, II, and IV onto the TSA plates.Sterilize spreader by dipping in alcohol and then briefly flaming to burn off excessalcohol (see figure below).7. Allow to dry and then incubate inverted at the appropriate temperature.DATA AND OBSERVATIONSDay one:1. Record your indirect measurements of OD and % transmittance in the table below.Day two:1. Collect your plates from the 37oC incubator. Count the number of distinct colonies oneach plate.2. For each time set, keep only those plates which contain between 30-300 colonies, discardall the rest. If more than one plate contains 30-300 CFUs, average the numbers and recordonly one for each time set.3. Determine the number of CFUs/ml of the original culture for each of the time sets andrecord the data in the table below.IncubationTime (min)Optical Density(600nm)% transmittanceBacterialconcentration(CFU/ml)Log ofCFU/ml4. Based on the instructions in the introduction to the lab, calculate the generation timeusing your CFU/ml calculations. Remember that B and b can be any two time points, but themost accurate would be those that give the longest interval:
Direct Generation Time 5. Plot the OD600nm on the Y axis and incubation times on the X axis of the provided semi-loggraph paper.6. Identify the log phase (if present) for the graph and determine the generation time ofyour bacterial culture using the indirect method described in the introduction to this labexercise. Remember that the log phase is represented by the straight-line portion of thecurve.Indirect Generation Time
DISCUSSION1.Does the term growth convey the same meaning when applied to bacteria and tomulticellular organisms? Explain.2. Were the generation times from your direct and indirect measurements similar? Give apossible explanation for why or why not?3. Was your bacterial culture in log growth during this experiment?possible growth phase for your culture and explain why.If not, provide a4. Did any of your classmates have a culture in log growth?5. Why do variations in generation time exist:a.among different species of microorganisms?b. within a single microbial species?6. The generation time and growth rate of an organism grown in the laboratory can beeasily determined by constructing a typical growth curve. Would you expect the growthrate of the infectious organisms found in an abscess that developed from a wound tomimic the growth curve obtained in the laboratory? Explain.
Construction of a complete bacterial growth curve requires that aliquots of a 24-hour shake-flask culture be measured for population size at intervals during the incubation period, however, such a procedure does not lend itself to a regular laboratory session.