Transcription
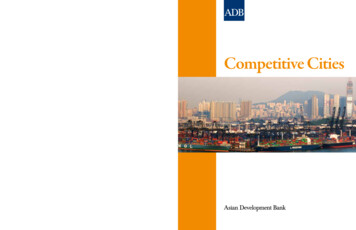
Competitve Cities: City Cluster Economic DevelopmentEconomic challenges in developing Asian countries have become more complex: urbanpopulations are growing at great cost to the environment, climate change has increased risksof natural disasters, and income gaps within and between developing countries are widening.These factors threaten the sustainable growth and development of urban areas, the drivers ofAsia’s economy. A strategic approach for inclusive growth is needed. The City Cluster EconomicDevelopment approach provides a strategic framework and a set of analytical tools, whichgovernments, businesses, and communities can use to support the inclusive and sustainabledevelopment of competitive urban economies in Asia. Said approach was developed andtested by the Asian Development Bank to improve the basis for integrated planning anddevelopment of urban regions in Asia and the Pacific. It also helps urban managers and othercity stakeholders identify action plans and determine priority investment areas.About the Asian Development BankADB’s vision is an Asia and Pacific region free of poverty. Its mission is to help its developingmember countries reduce poverty and improve the quality of life of their people. Despite theregion’s many successes, it remains home to two-thirds of the world’s poor: 1.8 billion peoplewho live on less than 2 a day, with 903 million struggling on less than 1.25 a day. ADB iscommitted to reducing poverty through inclusive economic growth, environmentallysustainable growth, and regional integration.Based in Manila, ADB is owned by 67 members, including 48 from the region. Its maininstruments for helping its developing member countries are policy dialogue, loans, equityinvestments, guarantees, grants, and technical assistance.Asian Development Bank6 ADB Avenue, Mandaluyong City1550 Metro Manila, Philippineswww.adb.orgPublication Stock No. 102656Printed on recycled paperPrinted in the PhilippinesCompetitive Cities
Needed: Inclusive UrbanEconomic GrowthEmpirical data demonstrate that the productivityof urban economies is at least two or three timeshigher than that of the non-urban sector in manyAsian countries. Further, there is a positive correlationbetween gross domestic product (GDP) andurbanization (Figure 1). This is why urban areas areknown as “engines of economic growth.”Figure 1 Correlation Between Urbanizationand GDP GrowthUrbanization and GDP/CapitaAsian DMCsGDP/capita (PPP 2005 constant)The Asian Development Bank (ADB) iscommitted to reducing poverty in Asiaand the Pacific. Inclusive development andsupport to growth-promoting economic activitiesare the underpinnings of its Strategy 2020. As Asiais urbanizing rapidly, it is projected that, by 2030,more than 55% of the Asian population will residein urban areas.25,000Republic of Korea20,000y 1060 .1e 0.0304 xR ² 30405060708090100% UrbanizedGDP gross domestic product, DMC developing member countries,PRC People’s Republic of China.Source: ADB.Competitive Cities 1
But some cities perform much bettereconomically than others, as indicated ina study by the Organisation for EconomicCo-operation and Development (2006) thatranked the competitiveness of cities acrossmany countries. Large cities do not necessarilyperform better than others, the questionis how those cities lagging behind canimprove their performance to catch up withcompetitors.How can Asian cities seize the opportunitiesof local economic growth? What factors make2 Competitive Citiestheir urban industries more competitive?Or, how could governments or developmentagencies strategically invest to simultaneouslyboost the competitiveness and sustainabilityof local economic development?Urban areas are theengines of economicgrowth and povertyalleviation.
What Makes a CityEconomically Competitive?Governments around the world havea growing interest in how to makecities more competitive—attractinginvestment and creating jobs that help reducepoverty and unemployment. However, instriving to become more competitive (seeBox 1 for definition), there is a growingrealization that the quality of the urbanenvironment, social systems, and employmentcan no longer be neglected. These factorsare part of the competitiveness equation.Balancing the quest for development,sustainability, and improved competitiveness isBox 1 What is the Competitiveness of Cities?The competitiveness of cities refers to the ability ofan urban region or cities to produce and market aset of products (goods and services) that representgood value (not necessarily lowest price) in relationto comparable products of other urban regions.(Modified based on Webster, D., and L. Muller. 2000. UrbanCompetitiveness Assessment in Developing Country UrbanRegions: The Road Forward. Washington, DC: World Bank.)a difficult challenge for most cities—especiallyin the rapidly urbanizing Asian context.Competitive Cities 3
Many common factors contribute tomaking cities competitive: quality of urbaninfrastructure, communications and publicservices, business rivalry and cooperation,access to natural resources and skills, locationin relation to markets, risk management, socialcapital, and quality of life. Not all cities are wellendowed with these factors—especially citiesin the developing world.Much of the thinking around competitivenesshas been developed from the ideas ofendogenous growth theory, which focuseson nurturing city competitiveness andinnovation of industry clusters. Exportdriven development remains important, butit is subject to powerful global economicfactors and influences. In Singapore,4 Competitive CitiesHong Kong, China, and Bangalore, India,the focus of economic development hasmoved away from an emphasis on low-costinfrastructure, low labor costs, and low taxes,toward highly competitive cities and industryclusters with skilled workers, advancedinfrastructure, and innovation.Successful cities increasinglyfoster growth in high valueadded industry clustersusing skilled workers,advanced infrastructure andinnovation.
How to Build Competitive Cities?Shifting the Growth Paradigm:City Cluster EconomicDevelopmentCities gain competitiveness from acontinuous process of, and commitmentto, learning and adjusting in response tothe actions of competitors and change.Enhancing a city’s competitive position togain national and/or global prominencetakes time. It requires stakeholders to beactively engaged in a city’s developmentand management, carefully analyzing1what makes it competitive. It also involvesgood planning, innovation, and strategicinterventions to attract investment,encourage economic development andknowledge, and create a pleasant place tolive. This section sets out the City ClusterEconomic Development (CCED) approachthat allows national and local governmentsto analyze what makes cities competitive.Michael Porter’s seminal work onThe Competitive Advantage of Nations (1990)1drew attention to the need for nations toenhance their competitiveness to fosterPorter, M.E. 1990. The Competitive Advantage of Nations. New York: Macmillan.Competitive Cities 5
growth and economic development.However, Krugman (1997)2 argued thatnations do not compete against each otherin any real sense, rather firms and cities arethe competitors. Thus, urban managers andbusiness enterprises need to understand whatfactors enable cities to compete successfullyfor trade and investment.Ultimately, the intended impact of the CCEDapproach is the creation of more job andincome opportunities, in both the urbanand rural areas and its rural hinterland. Bybetter understanding a city’s attributesof competitiveness, policy makers andinvestors can better foster key investmentsby government and business that will lead toenhanced competitiveness.2The CCED approach (Figure 2) provides a newparadigm for urban economic development,i.e., proactively supporting private sectordevelopment, promoting productivity ofindustry, and small and/or medium-sizedenterprise (SME) clusters and fosteringcompetitiveness of cities. The approachcan help ADB’s developing membercountries target their investments basedon their visions for economic growth andpoverty reduction.The impact of the CCEDapproach is to providemore job and incomeopportunities.Krugman, P. 1997. Development Geography and Economic Theory. Boston: Massachusetts Institute of Technology Press.6 Competitive Cities
Assessing theCompetitiveness of CitiesThe CCED approach provides an understandingof the strengths and weaknesses of the keyelements of city competitiveness. The approachincludes an analytical methodology—a stepby-step guide to assess the competitivenessof cities and industry clusters. Based on thisassessment, action plans can be prepared andimplemented.Step 1. Compiling profiles of NationalEconomic Strategy. The first step of analysisinvolves a macro-level overview of the nationalpolicy environment, institutional relationships,strategies supporting economic development,the national urban system, and governanceat the national and local levels. Much of thenecessary information can be collected fromexisting public reports and studies.Figure 2 The CCED ApproachThe CCED Approach is a New Way of Pursuing Local Economic Developmentin Partnership: Conceptual FrameworkEnhancing Competitiveness of Citiesgovernment as facilitatorEnhancing Competitiveness of Industry Clustersdriven by the private sectorTriggering Local Economic Development: Private and public sectors collaborationIncreasing Income and/or Job Opportunities, thus Reducing PovertySource: ADBCompetitive Cities 7
Step 2. Understanding Six Key BuildingBlocks of City Competitiveness. Based onthe framework of the World Economic Forum’scompetitiveness index reports, the Philippines’competitiveness of cities index3 providesa useful and relatively simple method forevaluating the competitiveness of cities. Itmeasures six key building blocks (elements)of competitiveness (Figure 3) using a mix ofqualitative and quantitative data collectedfrom statistical and survey assessments on49 attributes affecting city competitiveness.Many Asian countries, including the People’sRepublic of China, India, the Philippines,and Viet Nam, have begun to measure thecompetitiveness of their cities.The Building Blocks are the following: Enabling Business Environments. Thegovernance structures and organizationalarrangements define the rules forbusiness. Strong enabling environmentsprovide a set of clear and transparentrules (i.e., a good governance system) forbusiness in local economies. Business Dynamics. Attributes that affectthe dynamics of doing business in a localeconomy include the flow of information,the openness to business and new ideas,the aversion to risk, the taxation regime,the costs of doing business, and theawareness of new technology and its use.Figure 3 Six Building Blocks of City Competitiveness and Sample AttributesUnder the “Infrastructure” Building BlockToward the Competitiveness of Cities (6 Key Building ource andTrainingInfrastructureEndowedResourcesAre the roads, bridges, electricity, telephone lines, water supply, etc.in good condition?Domains: Overall management of transportation services of the city,reliability of utilities and environmental facilitiesNumber of indicators: 10 based on surveyWeight of Driver: 15%Source: AIM. 2007. Philippine Cities Competitiveness Ranking Project; andMacaranas, F. 2008. Philippine Cities Competitiveness Project 2007.3Asian Institute of Management (AIM). 2007. Philippine Cities Competitiveness Ranking Project. Manila.8 Competitive CitiesCatalysts
A highly regulated or controlled marketsignificantly reduces business dynamics. Endowed Resources. Assets or qualitiesderived from natural capital or areinherited come in many forms or types.Two important types of endowedresources are natural resources and builtenvironment. Human capital. Access to diverse andhighly developed pools of human capitalis probably one of the most importantattributes for maintaining a competitiveposition in open market economies. Inparticular, this refers to (i) alignment ofthe skills base with the production base;(ii) strong and effective local leadership;(iii) research and development capacity;and (iv) social capital—social interactionand exchange of information amongcolleagues, and others. Infrastructure. Strategic infrastructurecomprises the hard and soft infrastructureneeded to support key industry sectorsthat will drive the development of theeconomy. It can include cluster-specificassets, such as supercomputers andscientific or testing facilities, multimodaltransport and logistics, and informationand research facilities. Catalysts. Catalysts play a key role infacilitating the development of industryclusters. Civic entrepreneurs championinginnovative ways for local governmentsto develop important projects play acritical role in creating new investmentsand infrastructure, management services,community development organizations,and more.Box 2 provides example of city competitiveanalysis.Competitive Cities 9
Box 2 Which City is More Competitive?A city competitiveness study was undertaken in June 2008 to score 49 attributes of competitiveness in a total of 54 cities inBangladesh, India and Sri Lanka. The median score for the 54 cities was 5.96 out of a maximum of 10.00. Cities with overallcompetitiveness scores of 7.00 or more are considered internationally competitive. Cities with scores of less than 4.00 are mainlylocal service economies (they are heavily dependent on imports and produce few regional exports). Overall, the level of citycompetitiveness in the three countries is weak—with most being competitive at the national and regional levels and only sevenbeing internationally competitive.Ranking competitiveness for Indian CitiesCities’ 2.00PuneSetting the median score 5.96 as a benchmarking “zero point,” the study found onlyseven cities internationally competitive:Bangalore, Chennai, Delhi, Mumbai,Hyderabad, Kolcata, and Pune.Coimbatore-3.00PuducherryDelhiPanajiGreater tsar3.00VadodraBangaloreSuratBhubneswar1.00Shimla Business -2.00PuneCities’ Ranking on Business Environment IndexAnalysis by Building BlocksCities’ Ranking on Infrastructure IndexThirivantapuramJaipurPuducherryPanaji BusinessEnvironment Infrastructure CatalystsDelhi Human CapitalGreater 00 Endowed ore-3.00DelhiPuducherryPanajiGreater ucknow KolkataIndoreJaipurKochiSource: ADBStep 3. Identifying the Competitivenessof Industry Clusters at the Local Level.Within the city context described above, itis important to identify the industry clusters(Box 3 for definition) in a selected city (or cityregion) which can best contribute to increase10 Competitive Citieslocal GDP. This involves a multisector industryanalysis at the local level, comparing localperformance with the national levelto understand the changing patternsand structure of local industry and localeconomic potentials.
STEP 4. Spatial Mapping of IndustrySector Cluster in a Selected Local Area.This analysis identifies significant spatialconcentrations of employment and businessactivities and financial related transactionsthat occur between businesses in the samelocality. The spatial mapping of industryclusters in a city will be useful for planningand locating key strategic infrastructure anddevelopment projects. Cluster maps provideuseful information about the scale andmagnitude of a cluster for spatial planning.Spatial plans can be used to encourage theco-location of supporting industries andlogistics facilities that the cluster needs. Theycan also provide important information onhow the cluster functions and the factorsthat support its operation and development.Figure 5 illustrates where rubber industryclusters are located in the ColomboMetropolitan Region, and location changesover time.Box 3 Industry Clusters and ClusterDevelopmentClusters are geographic concentrations ofinterconnected companies, specialized suppliers,service providers, and associated institutionsin a particular field. Clusters arise because theyincrease productivity due to economies of scale,within which agglomerated companies compete.Cluster development focuses on reducing thecosts of doing business for a cluster by making itssupply chain more efficient or by supplying neededsocial and economic infrastructure or by providingopportunities for expanding production or movingoutput to higher value-added products.(Modified from www.isc.hbs.edu/econ-clusters.htm: Institutefor Strategy and Development, Harvard University)Figure 4 shows an example of the analysisof evolving industry sectors and clusters.Generally, industry sectors (local clusters) inthe upper right quadrant are emerging andgrowing; those in the lower left quadrant arefading, aging.Figure 4 Rise and Fall of Industry Clusters in a Hypothetical Urban Area:Using Location Quotient and Shift Share Analysis2.0DefenseAutomobile manufacturing1.75DecliningGrowing1.50LQ Year YFinance1.25Education-20-15-10-50Wholesale and ture2025Emerging0.5% share year X0.25% share year Y% Change in LQ Period X & YICT information and communication technology, LQ location quotient.Source: ADBCompetitive Cities 11
Figure 5 Spatial Mapping: Change in Rubber and Plastic Industry—Cluster ColomboMetropolitan Region, Sri LankaSource: Sevanatha Urban Resource Center12 Competitive Cities
Step 5: Conducting Gap Analysis forIndustry Clusters. This step aims to assessthe relative competitiveness of the selectedindustry. Analysts apply a scoring or rankingusing a nominal scale or symbols ( ) toevaluate the strength of five factors4 (Porter1990) using 47 indicators. Indicators maydiffer depending on country context. The fivecompetitiveness factors are:(i) Input factor condition includes accessto capital, land and facilities, spatialconcentration, availability of skilled labor,education and training facilities, quality oflogistics and utilities, or cost of services, andquality of living environment for workforce,proximity to raw material, and cost andquality of raw materials for the cluster.4(ii) Demand conditions include whetheropportunities exist to expand the demandside, such as through export or newdomestic markets, new products, andreceptiveness to change.(iii) Firm strategy, structure and rivalrycondition. Competitiveness is enhancedif firms have flexibility of productionsystems, responsiveness to managementchange, and capacity to diversify thescale of joint ventures, to engage incollaboration on technology applications,to build business networks and socialcapital, and to share industry knowledge.(iv) Related supporting industries. Thisfactor focuses on analyzing strengths ofPorter’s diamond model is one of the most widely used techniques for industrial cluster analysis. It involves analysts workingwith industry focus groups to score the relative strengths of the competitiveness of the selected industry cluster(s) within acity or city region. (Porter 1990)Competitive Cities 13
related services for the local business,the extent of value-adding supplychains, and business capacity toseek and engage with higher valueadding chains.approval systems, promoting sustainableindustry development and research anddevelopment.The next step is to assess gaps in theindustry’s current and future competitivenessattributes. Actions to strengthen weakattributes can then be planned. Box 4 showsthe results from a gap analysis on the rubberindustry cluster in Sri Lanka.(v) Government’s role. Government canenhance the competitiveness of industryclusters by providing support for clusterdevelopment, streamlining of businessBox 4 What Insights are Gained from Competitiveness Analysis for the Rubber Industry Clusterin Colombo?The production of rubber and manufacture of rubber products have been a solid part of Sri Lanka’s economysince the 1870s. Sri Lanka is now the sixth largest exporter and the eighth largest natural rubber–producingcountry. Presently, the rubber industry’s contribution to export earnings of the country is about 8%. The demandfor rubber-based products is increasing, and there is need to enhance the competitiveness of the industry clusterin the Colombo Metropolitan Region. The cluster is an important contributor to the economic growth of the saidmetropolitan region.Figure 6a Can Percentage of Value Be Added along the Supply Chain? Example ofRubber Industry Cluster in Colombo, Sri LankaA Structural Map of Rubber Industry Cluster ProvideInsights on Value-Added Supply nthethicRubber andR&DProcessingAids– Processes– ProductsFillers/Chemicals– ServicesFabric,Steel wireEquipment/ToolsTesting(Dice,Moulds)Value- 25% facpounding sTyres (Solid, Pneumatic)Latex Products(Foam Rubber, Dipped Products)ExportingSignificant presenceRetailchainsDirectSalesMoulded and Extruded Products15% ?Marketingand SalesBrand ManagementProduct ActivitiesProductDevelopmentDomestic15% ?5% ?Some presence40% ?Limited presenceSource: ADB.Figure 6a shows the industry’s value-added structural chain, identifying that support in product developmentand in activating synthetic rubber processing, fillers/chemicals, fabric and dice moulds, will greatly increase theindustry’s value addition.14 Competitive Cities
Figure 6b sets out the analysis of the 22 attributes under the five competitiveness factors in the rubberindustry cluster.Figure 6b Analysis of 5 Factors and 22 Attributes Contributing to the Rubber Industry’s CompetitivenessContext for FirmStrategy and Rivalry Availability of skilled workforceGood quality infrastructure services/logisticsGood quality telecom servicesEasy and guaranteed supply of domesticallysourced good quality rubber at competitive prices Good working conditionΘ Lack of education and training facilitiesΘ High cost of services (energy in particular)Factor (input)Conditions ΘΘPresence of reputed foreign firmsProactive business associationsLow level of knowledge sharingLow level of technology applicationRelated andSupporting IndustriesΘ Lack of business developmentserviceΘ Low response time and equality oflocal support servicesΘ Firms inability to exploit valueaddition potentialDemandConditions Global recognition for manufacture ofquality productsΘ Small domestic marketΘ Slow responsive and innovativeness changeΘ Lack of demand expansion capacity for newexpansionΘ Lack of readiness to face risksΘ Less emphasis of product branding andmarketingGovernment Policyand Support High focus to enhance natural rubber production(land extent)Θ Lack of government support for industry development(R&D, cost of utilities, long-term plans)The factor condition in the cluster is relatively strong (3.54) and internationally competitive (above the score 3.0). It has a well-trainedworkforce and good—but aging—infrastructure supporting the industry. But the demand condition (2.7) is below internationalcompetitiveness requirements.The diamond model and competitiveness deficiency analysis led to the identification of key areas of intervention that will be necessary tosupport the development of the cluster. These key initiatives include develop basic infrastructure, enhance research and development andthe education and training system, improve the business environment, and support technology development.Figure 6c Graphic Summary of Gap Analysis Results for Rubber Industry Clusters in the Colombo Metropolitan RegionFACTOR CONDITIONSGOVERNMENT 5.00Labor4.504.00Value AddingInfrastructure3.503.002.50Supply ChainsEndowed Resources2.001.501.00RELATED SUPPORTINGSocial Environment0.50INDUSTRIES0.00Technology OrientationDEMAND CONDITIONSCollaborationMarketsStructureSource: ADBFIRM STRATEGY,STRUCTURE, ANDRIVALRYNew ProductsBusiness EnvironmentCurrent Competitive Position Rubber ClusterFuture Desired Competitive Position RubberClusterCompetitive Cities 15
Step 6 Preparing a Strategic Business PlanBased on the Results of the Gap Analysis.Industry leaders, government, or parties whohave a stake in industry clusters can utilizethe results of the CCED analyses to addresscompetitive weaknesses by developing actionplans and priority investments. After obtaininga strong commitment from stakeholders,a consensus on how to develop a clustershould define:sustainable development strategy for a city.The core interventions5 are:(i) A Business Plan. What should eachindustry cluster’s stakeholders intend toachieve collectively?(iii) institutions and regulatory systems, e.g.,investment in SME promotion throughindustry associations and e-governance toreduce transaction costs;(ii) Time-Bound Action Plans. What needsto be done to foster the development ofthe cluster, i.e., aligning with the analysisresults of the six building blocks forcity competitiveness and five factors ofcompetitiveness for industry clusters.(iii) Benefits of Participating. What do stakeholders potentially gain from participatingin the development of a cluster?(i) logistics and infrastructure catering tothe local industry cluster, e.g., specializedwastewater treatment for tanneries;(ii) human resource development, e.g.,vocational education and supply chaincapacity development;(iv) technology development anddissemination, e.g., support todevelopment activities of industryassociations, research and developmentat local educational and researchinstitutions, pilot projects, and outreachand awareness programs and campaigns,among others; andImplementing ClusterDevelopment Projects—the Key Intervention Areas(v) business systems, e.g., specializedfinancial institutions (adapted to the localindustries’ need for credit, hedging, exportcredit, and other financial needs) andother specialized facilities.The range of activities needed to supportthe development of industry clusters is wellwithin the scope of activities funded by ADB.The significant departure from past practiceis integrating the demands of industry forinfrastructure and finance in the context of aSupport to a regional institution is alsoneeded to foster coordination of governmentinvestment and collaboration for “regionalmarketing,” cooperative purchasing of inputs,and other collective activities. The relationshipis represented in Figure 6.5ADB. 2010. City Cluster Economic Development: Towards More Competitive, Sustainable and Inclusive Asian Cities. Manila.16 Competitive Cities
Figure 6 Critical components ofCity Cluster Economic DevelopmentInfrastructure logistics/connectivity specializedBusinessSystems- Specializedfinancinginstitutions etc.RegionalStructuresEnablingInstitutions elopment/DisseminationExamples of Best PracticesMany projects related to the competitivenessof cities and industry cluster developmenthave been implemented since the early 1990s.One of the famous cluster developmentprojects is the information technology(IT) industry cluster in Bangalore, India.Bangalore is referred to as the Silicon Valleyof India because of the large number of ITcompanies located in the city. Its IT industrycluster contributed 33% of India’s IT exportsin 2006–2007 (amounting to 32 billion).Recently, however, the industry of Bangalorehas been under stress, mainly due to the lackof urban infrastructure to accommodate flowsof people, goods, and services. There are manyglobal examples of successful industry clusterssupported by various types of projects,such as: Textile and/or garment industry cluster:Tirupur, IndiaCompetitive Cities 17
Stainless steel cutlery industry cluster:Wazirabad, Pakistan Local Cluster Competitiveness in the Stateof Pernambuco, Brazil, supported by theInter-American Development Bank (IADB) North Grande Competitiveness Program:Argentina, also supported by IADB 71 cluster development projects in16 countries supported by the MultilateralInvestment Fund (MIF) Numerous Industry-cluster projects inAfrica, Asia, and Latin America by theUnited Nations Industrial DevelopmentOrganization (UNIDO).The experience, and later the evaluation,of both the MIF and UNIDO projects havedemonstrated the successful applicationof the industrial cluster approach. Thisapproach has stimulated innovation inproducts, processes, and productive functions;facilitated access to new markets; andcontributed to building or strengtheninglocal institutions (by creating collective normsand organizations). Moreover, there has beena growth in sales, employment, production,productivity, and exports. Box 5 sets out anexample of a cluster development projectin Argentina.Box 5 Project Design for Competitive Industry Cluster Development ProjectIADB-financed Loan (Document AR-L1003). Program for Industry ClusterDevelopment and Competitiveness in the Province of Mendoza, Argentina (2005)Background: Mendoza is Argentina’s fifth largest province in terms of its contribution to national gross domesticproduct (GDP) (3.89% in 2003). The province’s main economic activities with the greatest potential are wine industry,manufacturing, and tourism. Mendoza’s economy shrank considerably between 1993 and 2002. In that period, closeto 40% of its industries disappeared. According to the provincial industrial census f
The CCED approach provides an understanding of the strengths and weaknesses of the key elements of city competitiveness. The approach includes an analytical methodology—a step-by-step guide to assess the competitiveness of cities and industry clusters. Based on this assessment, action plans can be prepared and implemented. Step 1.

