Transcription
Overdose Surveillance SummaryAlabama Department of Public Health (ADPH)Center for Health Statistics;Bureau of Communicable Disease;Office of Emergency Medical Services; andBureau of Prevention, Promotion, and SupportJuly 2019
ADPH is the lead agency for surveillance of fatal andnonfatal drug overdoses, 911 runs related to drugoverdose, and naloxone administration by emergencymedical services personnel. This surveillance summaryis intended to provide information for overdoseprevention efforts, resource allocation, policydecisions, and to assist in monitoring the impact ofthese activities. The Alabama Department of Mental Health and theAlabama Opioid Overdose and Addiction Council leadthe comprehensive coordinated strategy to combatAlabama's opioid crisis and reduce the number ofdeaths and other adverse consequences in the state.Read more about opioids and how Alabama isaddressing the crisis at:– isis/– r/smalldoses/Alabama Opioid Overdose and .pdf
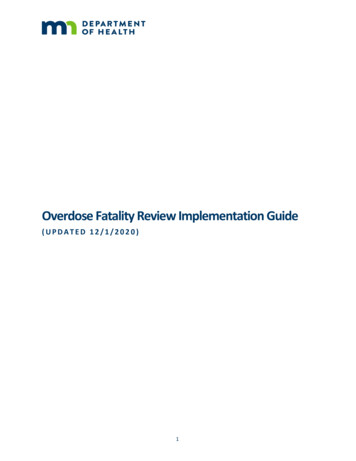
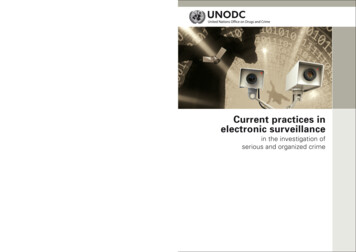
Number of Drug-Related Overdose Deaths by Substance —Alabama, 2015–2017The number of overdose deaths involving fentanyl doubled between the first quarter of 2015, and the fourthquarter of 2017, surpassing the number of deaths involving heroin and stimulants. The 2018 death data are notavailable at this time.AllOpioidsHeroinStimulantsNumber of Drug-Related 0Q1Q2Q32015Q4Q1Q22016Year by QuarterQ1Q22017
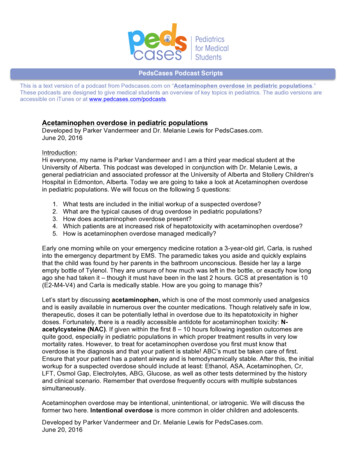
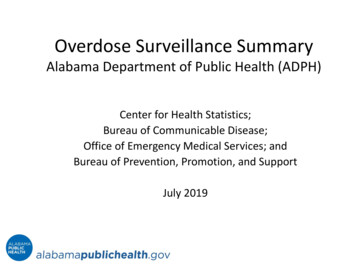
Ranking of Top 10 Drugs Involved in Overdose Deaths —Alabama, 2013–2017Overdose deaths involving fentanyl and methamphetamine are on the rise and prescribed opioids are on the decline.In 2016 and 2017, fentanyl was the top drug involved in overdose deaths followed by heroin. Rankings are based oninformation obtained from death certificates where known or suspected drug(s) were specifically provided.Therefore, rankings may not accurately reflect overdose deaths with incomplete or missing data on involved drugs.Rank201320142015201620171METHADONE (39)HEROIN (123)HEROIN (105)FENTANYL (140)FENTANYL (161)2HEROIN (37)METHADONE (42)FENTANYL (59)HEROIN (126)HEROIN (128)3COCAINE (28)COCAINE (43)METHADONE (41)COCAINE (81)METHAMPHETAMINE (110)4OXYCODONE (24)HYDROCODONE (34) COCAINE (39)METHAMPHETAMINE (45)COCAINE (98)5HYDROCODONE (16) FENTANYL (32)OXYCODONE (36)METHADONE (34)ALPRAZOLAM (78)6FENTANYL (15)OXYCODONE (28)METHAMPHETAMINE (28)OXYCODONE (31)OXYCODONE (68)7OPIATE (15)ALPRAZOLAM (28)HYDROCODONE (25) ALPRAZOLAM (30)8MORPHINE (13)METHAMPHETAMINE (19)MORPHINE (19)HYDROCODONE (30) METHADONE (32)9ALPRAZOLAM (12)OPIATE (15)ALPRAZOLAM (18)MORPHINE (21)MORPHINE (24)10METHAMPHETAMINE (13)MORPHINE (14)OPIATE (17)TRAMADOL (11)TRAMADOL (23)Total DrugRelatedDeaths579685726749HYDROCODONE (54)836
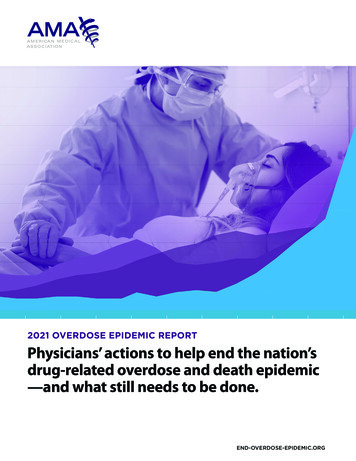
Number of Drug Overdose-Related Emergency Department (ED) Visits by Substance —Alabama, 2017–2018The number of all drug overdose-related ED visits is stable for all drug classes from 2017–2018. These data do notaccount for patient outcome.All DrugOpioidHeroinStimulantsNumber of Drug-Related ED Q1Q2Q3Q4Q1Q2Q3Q4500020172018Year by Quarter
Number of Drug Overdose-Related 911 Runs by Substance —Alabama, 2018BioSpatial, the new 911 data visualization application, facilitates categorization of 911 runs by substance. Thenumber of 911 runs for all drug overdose-related runs rose by almost 1,000 between the first and fourthquarters of 2018.All DrugNumber of Drug-Related 911 2,0001,0009541,2811,0871,0510Q1Q2Q32018Year by QuarterQ4
Rates of All Drug-Related Overdose Deaths by County of Residence —Alabama, 2015–2017Maps show the rates of all drug overdose deaths by county of residence and year. In 2017, the highest rates of all drugrelated deaths occurred in the Northeastern district; Jefferson, Blount, St. Clair, Calhoun, Etowah, and DeKalb counties.Note: County of residence rates calculated with few deaths (numerator) and small populations (denominator) can beunreliable.201520162017Average 14.9 per 100,000 populationAverage 15.4 per 100,000 populationAverage 17.1 per 100,000 population
Rates of Opioid-Related Deaths by County of Residence —Alabama, 2015–2017Maps show the rates of opioid overdose deaths by county of residence and year. Over time, the rate of opioid-relateddeaths increases and extends along the I-59 corridor and northwest Florida border. Note: County of residence ratescalculated with few deaths (numerator) and small populations (denominator) can be unreliable.201520162017Average 5.7 per 100,000 populationAverage 7.0 per 100,000 populationAverage 8.6 per 100,000 population
Percentage of All Drug Overdose-Related ED Visits by County of Residence —Alabama, 2015–2017In general, trends in nonfatal overdoses are geographically similar to fatal overdoses. Note: One ED visit does notnecessarily translate to one person.20172018Average 0.57% of all ED visitsAverage 0.51% of all ED visits
Percentage of Opioid Overdose-Related ED Visits by County of Residence —Alabama, 2015–2017In general, trends in nonfatal overdoses are geographically similar to fatal overdoses. Counties in the Northern,Northeastern, Jefferson, and West Central districts had the highest rates of opioid-related ED visits.20172018Average 0.12% of all ED VisitsAverage 0.10% of all ED Visits
Rates of All Drug Overdose-Related 911 Runsby County of Residence — AlabamaRates of Opioid Overdose-Related 911 Runsby County of Residence — Alabama20182018Average 37.8 per 10,000 populationAverage 5.5 per 10,000 population
Rates of Naloxone Administration by County of Residence —Alabama, 2015–2017201520162017Average 111.6 per 100,000 populationAverage 96.2 per 100,000 populationAverage 129.6 per 100,000 populationNote: One dose of naloxone counts as one administration. These data do not account for outcomeafter administration.
Number of All Drug-Related Overdose Deaths by Age Group and Sex —Alabama, 2017The number of all drug-related overdose deaths is higher among 15-54 year old males.MaleFemaleNumber of All Drug-Related 4445-54Age Group (Years)55-6465-7475-8485
Number of Opioid-Related Overdose Deaths by Age Group and Sex —Alabama, 2017Like all drug-related deaths, the number of opioid-related overdose deaths is considerably higher among15-54 year old males. In these age groups, twice as many males died from opioid-related overdose than females.MaleFemaleNumber of Opioid-Related Age Group (Years)45-5455-6465-7475-8485
Number of All Drug Overdose-Related ED Visits by Age Group and Sex —Alabama, 2018In most age groups, more females than males have ED visits for all drug-related overdose.MaleFemaleNumber of All Drug-Related ED 5-2425-3435-44Age Group (Years)45-5455-6465-7475-8485
Number of Opioid Overdose-Related ED Visits by Age Group and Sex —Alabama, 2018In contrast to all drug-related overdoses, ED visits for opioid-related overdoses occur mostly among males. Inthe 25-44 age groups, twice as many males than females had ED visits for opioid-related overdoses.MaleFemaleNumber of Opioid-Related ED -3435-4445-54Age Group (Years)55-6465-7475-8485
Number of All Drug Overdose-Related 911 Runs by Age Group and Sex —Alabama, 2018The number of all drug-related overdose 911 runs was higher among males aged 20-39 years and females aged 50 orolder.MaleFemale30-3940-49Number of Drug-Related 911 Runs2,5002,0001,5001,00050000-910-1920-29Age Group (Years)50-5960-6970-7980
Number of Opioid Overdose-Related 911 Runs by Age Group and Sex —Alabama, 2018The number of all drug-related overdose 911 runs was higher among males 20-49 years old.MaleFemale30-3940-49Number of Drug-Related 911 Runs1,00075050025000-910-1920-29Age Group (Years)50-5960-6970-7980
Number of Naloxone Administrations by Age Group and Sex —Alabama, 2018Naloxone administration occurs more frequently among males than females in most age groups.MaleFemaleNumber of Naloxone 5-44Age Group (Years)45-5455-6465-7475-8485
Number of All Drug–Related Overdose Deaths by Age Group —Alabama, 2015–2017The number of all drug-related overdose deaths continue to rise in the 25-44 age groups.201520162017Number of Drug-Related Deaths25020015010050000-1011-1415-2425-3435-44Age Group (Years)45-5455-6465-7475-8485
Number of Opioid-Related Overdose Deaths by Age Group —Alabama, 2015–2017In contrast to all drug-related overdose deaths, opioid-related overdose deaths have also risen in the 45-64 agegroups. A substantial increase occurred between 2016 and 2017, in the 45-54 age group.201520162017Number of Opioid-Related ge Group (Years)45-5455-6465-7475-8485
Number of All Drug Overdose-Related ED Visits By Age Group —Alabama, 2017–201820172018Number of All Drug-Related ED 25-3435-44Age Group (Years)45-5455-6465-7475-8485
Number of Opioid Overdose-Related ED Visits By Age Group —Alabama, 2017–2018The number of opioid-related overdose ED visits dropped slightly in the 25-44 age groups, but increased slightlyin the 45-64 age group from 2017 to 2018.20172018Number of Opioid-Related ED ge Group (Years)45-5455-6465-7475-8485
Summary of Drug-Related Overdose Deaths In 2017, 836 drug overdose-related deaths were reported; 419 (50%) of thoseinvolved opioids.Number of fentanyl-related overdose deaths are increasing faster than any otherillicit or prescribed drug.Rate of drug-related overdose deaths is intensifying and expanding in countiesalong the I-59 corridor and the northwest Florida border.Drug-related overdose deaths were higher in males aged 15-54; deaths involvingopioids were twice that of females in the same age group.Surveillance is based on information obtained from death certificates; many do notcontain information on specific drugs.Final death data for 2018 are not available at this time.
Summary of Drug Overdose-RelatedED Visits In 2018, 11,081 drug overdose-related ED visits were reported; 2,180 (19%) ofthose involved opioids.In general, the rate of drug overdose-related ED visits were highest in areas withthe highest rates of overdose-related deaths, although rates of overdose-relatedED visits are higher than deaths in the Northern and Northwestern districts.ED visits for all drug overdoses were more frequent among females in older agegroups, but visits for opioid-related overdose are more frequent in younger males.Surveillance is based on clinical syndromes derived from information obtainedfrom chief complaint and diagnosis codes of ED visits when available; ED utilizationand reporting of diagnostic toxicology is unknown.
Summary of Drug Overdose-Related911 Runs and Naloxone Administrations In 2018, 20,353 drug overdose-related 911 runs were reported; 4,373 (21%) ofthose involved opioids.Rate of 911 runs for overdoses were highest in Jefferson and surrounding counties.Similar to the rate of overdose-related ED visits, 911 runs for all drug-relatedoverdoses were higher in older females; 911 runs for opioid-related overdoseswere higher in younger males.Surveillance is based on clinical impression, not diagnoses.In 2018, 6,287 doses of naloxone were administered and reported to the Office ofMedical Services, a 35% increase from 2017 (4,666 doses administered).In 2018, the rate of naloxone administrations was highest in Jefferson andsurrounding counties and males aged 15-44.Naloxone administration may be affected by availability.
ADPH Contributors Center for Health Statistics– Dr. Xuejun Shen, Suzi Turner, Dr. Hua Xu, and Nicole Rushing Bureau of Communicable Disease– Dr. Rendi Murphree, MisChele Vickers, and Dr. Sherri Davidson Office of Emergency Medical Services– Dr. Augustine Amenyah, Gary Varner, and Stephen Wilson Bureau of Prevention, Promotion, and Support– Sarah Khalidi, Kortnei Scott, and Sondra Reese– Leigh Ann Hixon and Nancy Bishop
Contact InformationFatal overdoses: xuejun.shen@adph.state.al.usNonfatal overdoses: syndromic@adph.state.al.us911 and Naloxone: gary.varner@adph.state.al.usInformation contained in this report are subject to limitations that may affectinterpretation. Please consult the authors before use or redistribution.
The following slides contain information ondata sources, definitions, and limitations.
More on Overdose Death SurveillanceData Sources: Data in this report were generated on February 13, 2019, for January 1, 2015-December 31, 2017, death certificate datacollected by the ADPH Center for Health Statistics, Vital Statistics Division. All data were generated using the National Centerfor Health Statistics definitions for drug overdose deaths which include natural opioids, semisynthetic opioids, and syntheticopioids. Drug overdose deaths were defined as having an International Classification of Diseases, 10th Revision (ICD-10)underlying cause of death code of X40-44 (unintentional), X60-X64 (suicide), X85 (homicide), or Y10-Y14 (undeterminedintent).Among deaths with drug overdose as the underlying cause, the type of drug or drug category was determined by thefollowing ICD-10 multiple cause-of-death codes: opioids (T40.0, T40.1, T40.2, T40.3, T40.4, or T40.6); natural/semisyntheticopioids (T40.2); methadone (T40.3); heroin (T40.1); synthetic opioids other than methadone (T40.4), and cocaine (T40.5).Consistent with the National Center for Health Statistics, ADPH defines an overdose drug death as a death resulting fromunintentional or intentional overdose of a drug, being given the wrong drug, taking a drug in error, or taking a druginadvertently.Limitations: Drug overdose deaths regularly involve multiple drugs. In these instances, a single death cannot be exclusively linked to asingle drug, which presents a challenge when interpreting data.Many death certificates provide inadequate details in regard to the definite drugs involved in the death.Particular toxicology screenings (i.e., advanced fentanyl testing) may not be conducted depending on the nature of thedeath.There is a 6 to 9 month delay in retrieving the exact drug(s) associated with a death.Documentation of whether a drug is legal or illegal varies among coroners.
More on ED Overdose SurveillanceGeneral limitations of ED data available in the syndromic surveillance system: The purpose of syndromic surveillance data are to provide estimates and trends rather than precise or exact counts. Like allsurveillance data, syndromic surveillance data are not unbiased and are not a representative sample of the population.Therefore, descriptive statistics are best applied and the use of analytic or inferential statistics may not be appropriate. Thechief complaint is not a diagnosis. It captures the patient’s primary reason for seeking medical care and is commonlyrecorded as a free text field, which may include misspellings or abbreviations. It may also lack context that could assistpublic health with interpretation of the reason for visit. Variability in the chief complaint across healthcare facilities cansometimes make it difficult to measure the exact burden of illness or injury in a community. Final diagnosis may not beavailable; therefore, overdose-related visits are only suspected overdoses. The volume and quality of data transmitted has changed over time, leading to improved coverage of Alabama’s population inmore recent years. This increase in data volume and improvement in data quality should be taken into consideration wheninterpreting trends across years. It is also important to consider fluctuations in data reporting which may result in a decreasein data volume, such as if a healthcare facility were to stop sending data or to experience a change which would cause adelay in their reporting. Please keep these data reporting changes in mind when interpreting syndromic surveillance data. An individual could have more than one ED visit during the reporting period making per capita or population ratecalculations tricky to interpret. No exposure, risk factor, or outcome data are available. County of residence is estimated from patient zip codes. Hospital participation is voluntary. Data in this report were downloaded on February 19, 2019, for January 1, 2017-December 31, 2018, from the Centers forDisease Control and Prevention (CDC) National Syndromic Surveillance Program (NSSP) Biosense Platform using the Essenceprogram using CDC syndrome definitions. Surveillance classification of ED visits are based on clinical syndromes derived from information available in the visit chiefcomplaint and diagnosis codes when available. These definitions (shown on the next slide) are too complex for presentationhere. Please contact syndromic@adph.state.al.us for details.
Partial Definitions for ED OverdoseSurveillanceFor complete definitions contact syndromic@adph.state.al.us
More on 911 Overdose SurveillanceOverdose Definition:Categorical syndrome definition based on Enhanced State Opioid Overdose Surveillance (ESOOS) criteria as defined by the state of Florida,intended to detect incidents involving any drug overdose. The criteria are defined for National Emergency Medical Services InformationSystem (NEMSIS) v2 and v3 as follows: NEMSIS v2: Labeled as general drug overdose if one or more of the following are true: Primary OR secondary impression is "Poisoning/Drug Ingestion" AND the patient is not dead at the scene. (Naloxone [or brand names] listed as medication administered; OR chief complaint contains naloxone [or brand names]) AND themedication response indicates that the patient improved. NEMSIS v3: Labeled as general drug overdose if one or more of the following are true: Primary or secondary impression starts with T36-T50, F11-F16, or F18-F19. Narrative or chief complaint contains "overdose", "opioid", "opiate", "opium", "fentanyl", "heroin", "speedball", "speed ball","spheroin", "hod", "OD", "O.D.", "O/D", "OD/", or "ODED".This syndrome is not applicable to patients declared dead without resuscitation attempts or dead at the scene.This syndrome is restricted to only those incidents with a patient disposition of "Treated Transported", "Treated Transported LawEnforcement", "Treated Transported Private Vehicle", Treated Transferred", "Treated Released", or "Treated Released Against Medical Advice(AMA)".Opioid Overdose Definition:Categorical syndrome definition based on ESOOS criteria as defined by the state of Florida, intended to detect incidents involving opioidrelated overdoses. The criteria are defined for NEMSIS v2 and v3 as follows: NEMSIS v2: Labeled as opioid overdose if the following is true: (Naloxone [or brand names] listed as Medication Administered; OR chief complaint contains naloxone [or brand names]). NEMSIS v3: Labeled as opioid overdose if one or more of the following are true: Primary or secondary impression starts with T40.1-T40.4, T40.60, T40.69, or F11. Narrative or chief complaint contains "opioid", "opiate", "opium", "fentanyl", "heroin", "speedball", "speed ball", "spheroin", or"hod".This syndrome is not applicable to patients declared dead without resuscitation attempts or dead at the scene.This syndrome is restricted to only those incidents with a patient disposition of "Treated Transported", "Treated Transported LawEnforcement", "Treated Transported Private Vehicle", Treated Transferred", "Treated Released", or "Treated Released AMA".
Number of Drug-Related Overdose Deaths by Substance — Alabama, 2015-2017 The number of overdose deaths involving fentanyl doubled between the first quarter of 2015, and the fourth quarter of 2017, surpassing the number of deaths involving heroin and stimulants. The 2018 death data are not available at this time. 203 207 180 136 169 200 201 .