Transcription
Asia Pac J Clin Nutr 2014;23(4):703-713703Original ArticleGeographic factors as determinants of food security: aWestern Australian food pricing and quality studyChristina Mary Pollard PhD1,2, Timothy John Landrigan BSc, Grad Cert Statistics1,3,Pernilla Laila Ellies MPH2, Deborah Anne Kerr PhD1, Matthew Langdon UnderwoodLester BPharm MPS2, Stanley Edward Goodchild Dip Env Health21School of Public Health, Curtin University, Western Australia, AustraliaDepartment of Health in Western Australia, Western Australia, Australia3Australian Bureau of Statistics, Perth, Australia2Food affordability and quality can influence food choice. This research explores the impact of geographic factorson food pricing and quality in Western Australia (WA). A Healthy Food Access Basket (HFAB) was cost and avisual and descriptive quality assessment of 13 commonly consumed fresh produce items was conducted in-storeon a representative sample of 144 food grocery stores. The WA retail environment in 2010 had 447 grocery storesservicing 2.9 million people: 38% of stores the two major chains (Coles Supermarkets Australia and Woolworths Limited) in population dense areas, 50% were smaller independently owned stores (Independent Grocers Association ) in regional areas as well, and 12% Indigenous community stores in very remote areas. TheHFAB cost 24% (p 0.0001) more in very remote areas than the major city with fruit (32%, p 0.0001), vegetables(26.1%, p 0.0005) and dairy (40%, p 0.0001) higher. Higher price did not correlate with higher quality with only80% of very remote stores meeting all criteria for fresh produce compared with 93% in Perth. About 30% of veryremote stores did not meet quality criteria for bananas, green beans, lettuce, and tomatoes. With increasing geographic isolation, most foods cost more and the quality of fresh produce was lower. Food affordability and qualitymay deter healthier food choice in geographically isolated communities. Improving affordability and quality ofnutritious foods in remote communities may positively impact food choices, improve food security and preventdiet-sensitive chronic disease. Policy makers should consider influencing agriculture, trade, commerce, transport,freight, and modifying local food economies.Key Words: food, affordability, quality, geographic factors, food securityINTRODUCTIONChronic diseases account for 60% of the 56 milliondeaths globally, with unhealthy diets being a major contributor to key risk factors (high blood pressure, high cholesterol, low fruit and vegetable intake and overweightand obesity).1 The most socially and economically disadvantaged have the worst health and a greater incidence ofdisease risk factors.2-4 Food choice is in part determinedby food supply, pricing, quality, availability and incomedisparities.4 There are times when individuals have tocompromise the quality or quantity of their diet becauseof a lack of money or access to food.5 Australians relyingon the lowest income have to pay the greatest percentageof their income towards food.6Food insecurity and diet-sensitive chronic diseaseFood security can be defined as existing “when all people,at all times, have physical and economic access to sufficient, safe and nutritious food to meet their dietary needsand food preferences for an active and healthy lifestyle”(FAO, 1996, Rome declaration on food security). Theability of individuals, households and communities toacquire appropriate and nutritious food on a regular andreliable basis using socially acceptable means is deter-mined by people's local food supply and their capacityand resources to access and use that food. Food availability, quality and price influence the affordability of food.7There is no regular monitoring system capturing the severity of food or nutrition insecurity in Australia, however, a single question measures food insufficiency instate-based population surveys. In 2010, 3.3% of WesternAustralia (WA) adults said they had run out of money andcould not afford to buy food during the previous 12months.8 Australians residing in rural and remote areasare susceptible to food insecurity,9 particularly Indigenous Australians who suffer preventable diet relatedchronic disease.2 Ideally, systems to monitor a nation’sfood security should include information about factorsthat affect food supply,10 including food affordability andCorresponding Author: Dr Christina Mary Pollard, CurtinSchool of Public Health, Curtin University, Kent Street Bentley,6012, Western Australia.Tel: 61 8 9266 1142; Fax: 61 8 9266 7947Email: C.Pollard@curtin.edu.auManuscript received 30 April 2013. Initial review completed 06August 2013. Revision accepted 17 May 2014.doi: 10.6133/apjcn.2014.23.4.12
704CM Pollard, T Landrigan, P Ellies, D Kerr, M Lester and S Goodchildquality.Food insecurity has been found to be associated withdiet-sensitive chronic disease (including cardiovasculardisease risk factors (hypertension, and hyperlipidaemia))in children and adults.11,12The Australian policy contextThe National Health and Medical Council’s recent reviewof the dietary guidelines continue to encourage the consumption of nutritious but perishable foods (for example,fruit, vegetables, dairy foods, lean meats, and fish).13These foods require appropriate storage and transportation. Increased transportation costs lead to increased foodprices.In 2013, the Australian Government’s National FoodPlan-Our Food, Our Future (NFP) had a focus on domestic food security and factors affecting food affordability.“In a country as wealthy as Australia is, no-one should gohungry” NFP page 56.14The NFP considered the causes complex and included:poverty; poor infrastructure; lack of social protection (access to a regular income); water; poor education; individual poor management skills; and lack of access to reasonably priced foods. In response to 24% of Indigenouspeople and those living in disadvantaged areas being foodinsecure, compared with 2% of the “general population”,the 2025 goal was to “build on the high level of food security by continuing to improve access to food in remotecommunities or to those struggling with disadvantage”.14The Council of Australian Government’s (COAG) National Strategy for Food Security in Remote IndigenousCommunities outlined actions to improve both the supplyand demand for nutritious food in remote Indigenouscommunities.15,16At the national level, the NFP has been superseded bythe current government’s Agricultural CompetitivenessWhite Paper (ACWP) which focuses Australian food andagricultural policy on agricultural business development.Although food security is within scope “through the creation of a stronger and more competitive agriculture sector,” the emphasis is on economic competitiveness, reducing regulatory burden, reduction of inputs along the supply chain, enhancing exports and exploring new markets.In contrast to the former NFP, the new approach to foodaffordability is on increasing food production withoutputting this in the context of human health or the socialaspects of food affordability in Australia.17Geographical impact on food supply in Western AustraliaIn 2009, in acknowledgment of the challenge of achievingan adequate supply of safe, nutritious and affordable foodin remote areas in Australia, a parliamentary inquiry into“food stores servicing remote Indigenous communities”was undertaken. The inquiry concluded that food costswere higher in remote communities due to the transportlogistics of servicing relatively small communities in isolated geographical locations.16 This is particularly true forWestern Australia (WA) with its vast land mass(2,527,875 square kilometres) and concentrated population, 75% residing in the capital, Perth metropolitan area.Most of the state is categorised rural, remote or very re-mote. Perth is the source of all transport logistics to grocery stores in WA, with the exception of far northern(Kimberly area) stores where some items come fromDarwin, Northern Territory. The food distribution channels to the communities are via long haul road or train,and remote community stores often service a communityof less than 100 people. The relatively small amount offood production and processing in WA means a largeproportion of food is brought into WA from the Easternstates of Australia or overseas. The geographical impacton food pricing and quality in WA is relatively unexplored.Grocery food retail and priceFood accounts for about half (46%) of all retailing turnover in Australia.18,19 Supermarkets and grocery stores areresponsible for 63% of the total food retail in WA atAU 6.6 billion in 2009.19 The price of a small number ofselected foods is collected in capital cities for the calculation of the Consumer Price Index20 and, every five years,the average weekly household expenditure on food ismeasured in the Household Expenditure Survey.21 Thesesurveys do not enable exploration with geographic locations.The price of food in Australia is increasing, particularlyfruit and vegetables, however, there is limited routinelycollected food pricing information in Australia.22 Ad hoc“healthy food” market basket surveys have captured foodaffordability trends in Queensland,23,24 the Northern Territory,25 New South Wales26,27 and South Australia,28,29but there is no regular survey in WA. The dearth of foodpricing information in WA was of particular concern dueto the geographic uniqueness of the state and anecdotalreports of higher food prices in remote areas.Food quality and purchasing decisionsFood purchasing decisions at point-of-sale are in partbased on “appeal” or quality, as well as price, for example, the perception of freshness which is influenced byappearance, colour, aroma or odour, texture, size, shape,flavour, and freedom from defects.30,31 The definition ofquality depends on the food and characteristics beingconsidered. The commercial quality of food considersattributes based on appeal as well as characteristics suchas “cleanliness, firmness, lack of damage, freedom fromdisease, and consistency” and the descriptions vary forspecific fruit and vegetables.32 Lacking is information onthe quality of fresh produce by geographic location inWA.In 2010, the Department of Health conducted the firststatewide Food Access and Costs Survey (FACS) as partof the WA Environmental Health Food Unit’s food monitoring and surveillance program. This paper analyses theFACS to explore the impact of geographical location onfood pricing and quality of a healthy food basket.METHODSThe FACS was developed and implemented in six stages:1. Review of the literature and existing costing surveyinstruments;2. Identification of geographic locations of all grocerystores and selection of a state-wide representative
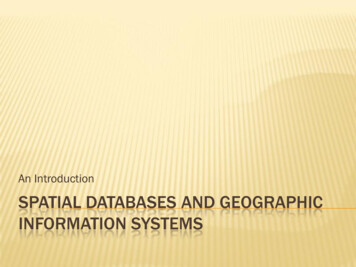
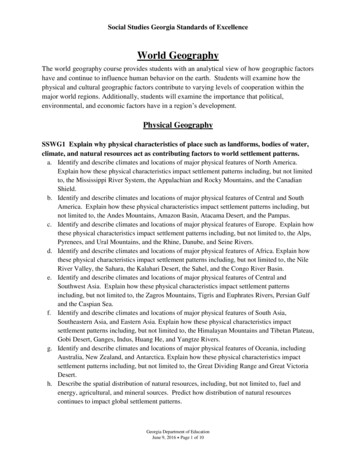
Geographic food choice determinantsstore sample;3. Surveyor recruitment and online training of local government Environmental Health Officers and PublicHealth Nutritionists;4. Notification of grocery stores of the survey timing andcontent;5. Surveys conducted August/September 2010;6. Data entry and analysis.SamplingThe survey was restricted to major grocery supermarketretailers from two main supermarket chains (Coles Supermarkets Australia and Woolworths Limited) and thenetwork of independently owned supermarkets who tradeunder the Independent Grocers Association (IGA ), andall Indigenous community stores. Contact details and geolocations of all stores were obtained from store websitesand for remote community stores obtained from state andlocal governments. A random sample of stores was selected to ensure a representative selection of supermarketsfrom different Statistical Local Areas (SLA) based onsocio-economic status and remoteness. Socio-economicstatus was based on the Australian Bureau of Statistics(ABS) Socio-Economic Indexes for Areas (SEIFA),33 theIndex of Relative Socio-economic Advantage and Disadvantage and remoteness from the Australian StandardGeographical Classification remoteness classification.34All store geographic locations were mapped as weretransportation routes and remoteness categories. For eachSLA, the nearest Coles , Woolworths and IGA storewas chosen and all remote Indigenous Community Storeswere included. This final sample size of 160 stores wasselected from the 447 identified overall.Survey instrument-pricingThe food products and brands priced in the overall surveywere chosen based on consistency with the AustralianDietary Guidelines13 and comparability with Australianstate government food baskets. The brands and productswere chosen to reflect market share (Retail World’s Australasian Grocery Guide 2009 market share and sales byvolume in Australia) and included supermarket ownbranded products.35The regular price of 430 specified food products,across 230 foods types, was recorded in-store on a paperFigure 1. Quality assessment criteria705audit sheet. To increase ease of use, the instrument waspiloted in the three types of grocery chains prior to conducting the state wide survey.Survey instrument-qualityTo standardise quality criteria existing in-store producequality assessment tools were reviewed.23,25,36 To reducesubjectivity, the quality assessment criteria were developed for 13 commonly consumed fruit and vegetablesusing descriptive wording adapted from Australian industry horticultural quality grading system (www.Marketfresh.com.au).25The quality descriptors based on industry standards included: intact-free of major injury and spoilage; soundnot overripe, soft, wilted, free of foreign odours and foreign tastes and free of injury and blemishes; and cleanfree of dirt, dust, unacceptable chemical residues andother foreign matter. The cheapest variety for each fruitand vegetable product on sale in-store was selected by thesurveyor who then assessed the product criteria based onat least 75% of the displayed stock. Each criteria wasrated as present or not, with a “yes” or “no” response.(Figure 1 shows the quality criteria.)Data collectionThe survey was conducted over the same time periodthroughout the state and the completed surveys mailed tothe Department of Health’s Food Unit where the resultswere collated and entered into a Microsoft Excel database.AnalysisData for all surveyed stores were entered and the averageprice per 100 g (or 100 mL) for each food item was calculated. When calculating the cost for each SLA, for everyfood, the prices were averaged across all selected storesin that SLA. Prices for missing foods were imputed usingthe average price from other stores the same distance, byroad, from Perth. Selected stores were categorised by theABS remoteness criteria and the median price of the respective food baskets were calculated by SLA.The healthy food basket for the current analysis isbased on the Queensland healthy food access basket(HFAB).23,25 The HFAB basket contains popular andcommonly available foods in the amounts needed to meet70% of the nutrient requirements and 95% of the energy
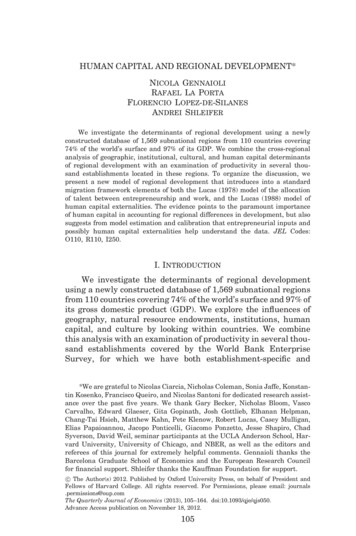
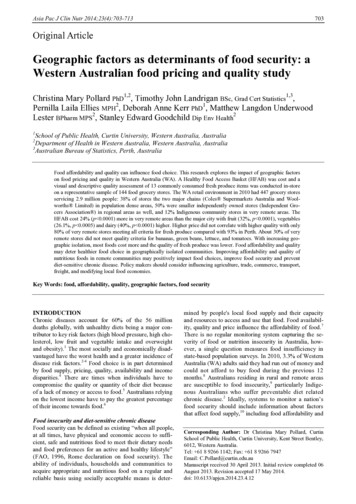
706CM Pollard, T Landrigan, P Ellies, D Kerr, M Lester and S GoodchildFigure 2. Supermarket density in Western Australiarequirements of a hypothetical family of six (including aman and a woman 19 years, an older woman 61 years,a teenage boy 14 years, a girl 8 years and a boy 4 years)over a fortnight.23,25 See Harrison et al (2010) for a fulldescription of the basket.24 As with the HFAB, a “junkfood” basket of less nutritious items (cream biscuits, plainmilk chocolate, ice-cream, a packet of potato crisps, a softdrink and a meat pie) and one brand of cigarettes wereincluded for comparison with the healthy foods.Quality was measured by applying a score to each ofthe quality attributes if that quality was present in 75% ofthe produce on display when assessed at point of sale.These scores were added up to give a quality score out of100 for each fruit or vegetable. The criteria were selectedto represent good quality for each individual produce anda score of 100 was considered good quality. The meanquality scores for the 13 fresh fruit and vegetables weredetermined.Statistical analysis was conducted by the ABS statistician (TL) using Statistical Analysis System (SAS) Enterprise Guide (2006-2008).37 Kendall’s Tau was used to testfor correlations between remoteness and cost. One-wayanalysis of variance was used to assess for differences inmean costs of a healthy food basket across remotenesscategories.RESULTSGeographical location of grocery storesThe location of grocery stores in WA was related topopulation density. Figure 2 displays the geographicallocation of the 447 grocery stores by type (85 Coles , 84Woolworths , 226 IGA stores, and 52 Indigenouscommunity stores). IGA stores vary in size: IGA Xpress (smaller convenience supermarket), Supa-IGA andProgressive Supa-IGA (larger supermarkets).The population density by supermarket density was
Geographic food choice determinantsmuch higher in the Perth metropolitan area comparedwith the rest of the state, 0.05 versus 0.0001 supermarketsper km2 as shown in Figure 2. The population for WA inMarch 2010 was 2.29 million people and approximately75% reside in Perth.38 WA’s population density at June2009 was 0.9 people per square kilometre (km2).39 Mostof the state has a very low population density with 97% ofthe total area of the state having less than one person persquare km compared with Perth statistical division with308 people per km2.39Mapping grocery store and Indigenous community locations, remoteness, and transport routes clearly illustrates the complexity and distance of the transport networks required for the delivery of food in WA.Response rateThe in-store survey response rate was 90% with data received from 144 of the 160 stores selected. Of the 52community stores that were initially identified, eight wereclosed and two were found not to be operating as storeswhen surveyed, resulting in an eligible sample of 38.Ninety seven individual surveyors implemented the 144surveys across the state. It took surveyors an average of4.1 hours to complete the survey. Community stores tookan average of 2.5 hours to complete due to fewer foods tochoose from.Cost of a healthy food basketThe mean cost of a healthy food basket in August/September 2010 was AU 542.10 (see Table 1). Thecost of foods significantly increased with distance fromthe major cities. The increase in cost between the majorcities and very remote areas was across all food groups,particularly perishable foods (fruit, vegetables, and dairy).The increase for non-core foods was high in terms of percentage change, however, not in terms of actual amount.The analysis was also conducted without communitystores to determine whether the increase in cost was dueto store type rather than geographic location. The increasein the mean price of the food basket was less (AU 565.67compared with AU 627.11 for very remote andAU 546.74 compared with AU 567.92 for remote stores),however the prices for remote and very remote areas werestill higher than for the other regions and major cities.The mean price of the Perth metropolitan healthy basketwas influenced by two outliers, supermarkets in affluentsuburbs where the price and quality of foods was significantly higher than in other suburbs.Quality of fresh produceThe mean quality rating for fresh produce ranged from80% to 95%. The mean quality for fresh produce generally decreased with geographical distance from the majorcity, see Table 2 for the mean quality rating for each produce type by geographic location. For most produce, themean quality in stores in urban areas was higher than inremote or very remote stores. There were exceptions; themean quality rating for lettuce and green beans was lowest in remote areas, but lower in Perth than in regionalareas. Oranges were rated better quality in remote stores,possibly due to local production.707DISCUSSIONFood pricing and quality varied by geographical locationin WA, with higher food prices and poorest quality of 13selected fruit and vegetables in the areas of the greatestgeographic and socioeconomic disadvantage. The FACSmethodology using a representative selection of supermarkets state-wide based on socioeconomic status andremoteness allows for generalizes ability of results in WA.Geographic location of grocery stores in Western AustraliaGrocery store mapping illustrates that supermarket density is greatest in areas with accessibly by main roads.The geographical uniqueness of WA, with 25% of thepopulation dispersed across very remote areas accountingfor 75% of the land mass presents particular challengesfor equitable food pricing and quality. Mapping also revealed that the large supermarkets (Coles and Woolworths ) who control Australia’s retail supermarket sector with 76% market share,40,41 only service areas of highpopulation density. The largest number of grocery storesin WA were independently owned and located in smallerrural and remote communities. The areas of lowest population density also have a higher proportion of Aboriginalresidency, 8.4% compared with 1.7%.42 Many of thestores servicing remote Indigenous communities of lessthan 100 people, therefore operate more as an “essentialservice” than as a “viable business”,43 and this is reflectedby community ownership of these stores rather than privately held businesses.Market forces and business drivers dictate grocerystore locations and food prices. The buying power of thetwo major supermarket chains means that they can offeran enormous range of goods at prices that smaller retailers cannot compete with.44 Foods in smaller stores may bemore expensive due to smaller economies of scale andlower turnover, and as we have found in this study, due togeographic location. Metcash, a wholesaler organisation,buys on behalf of the independent grocers (IGA ) to tryto assist them to remain competitive in both product diversity and pricing.44 Community stores do not generallybelong to these competitive buying cooperatives. Although the alliances between wholesalers, retailers andmanufacturers attempt to address economies of scale,stores may require further assistance to reduce food costsassociated with transport logistics.Food costsThe study findings support previous Australian researchsuggesting that food cost and quality may contribute tofood purchasing decisions and possibly the strong associations between food security and socioeconomic disadvantage.28,29 The mean cost of a healthy food basket was23.5% more in very remote areas than in Perth. The priceof fresh produce and dairy foods increased more thanfrozen or standard sized packaged food. As food priceincrease was also seen across almost all foods, it is plausible that transport and freight costs contribute. The findings are consistent with 2009 research which found excessive food prices in remote WA communities.45Fruit, vegetables and dairy foods in very remote areascost more than in metropolitan areas (32%, 26%, and
708CM Pollard, T Landrigan, P Ellies, D Kerr, M Lester and S GoodchildTable 1. Mean cost of WA healthy food access basket per fortnight for food groups, using QLD Healthy Food Access Basket, by remoteness area, (95% CI)Food groupFruitVegetables & legumesBread & cerealsDairyMeat & alternativesNon-core foodsTotal healthy food basketJunk foodCigarettes†Western AustraliaAU (CI)Major citiesAU (CI)Inner regionalAU (CI)Outer regionalAU (CI)RemoteAU (CI)Very remoteAU (CI)113 (107-118)105 (101-110)139 (135-143)50.2 (47.8-52.5)114 (112-116)21.3 (20.4-22.3)542 (526-559)55.7 (52.7-58.7)252 (246-257)103 (97.8-107)98.0 (94.4-102)132 (130-134)44.6 (43.7-45.5)111 (109-114)19.2 (18.7-20.0)508 (499-516)49.9 (49.0-50.8)242 (239-244)103 (95.1-111)97.6 (92.4-103)133 (128-138)44.1 (42.4-45.8)109 (104-114)19.7 (18.4-21.0)507 (496 -518)51.3 (49.0-53.7)241 (234-248)99.1 (91.5-107)97.7 (89.0-106)127 (122-132)47.2 (44.0-50.5)110 (107-114)19.8 (18.6-20.9)501 (490-512)52.0 (49.3-54.8)246 (238-254)123 (108-137)109 (95.7-122)144 (136-153)52.7 (48.7-56.8)116 (112-121)23.1 (20.6-25.6)568 (529-607)58.9 (52.8-65.1)255 (242-269)136 (125-146)124 (113-134)160 (149-171)62.4 (55.9-69.0)120 (114-126)25.2 (22.2-28.3)627 (588 -667)67.2 (54.5-80.0)276 (257-295)Western Australia (WA) and Queensland (QLD).Increase from Majorcities to very ��sTaup-value 0.00010.0005 0.0001 0.00010.0017 0.001 0.0001 0.0001 0.0001
Geographic food choice determinants709Table 2. Mean quality rating for produce by remoteness categoryProduceApples greenApples redBananasBroccoliCarrotsCeleryGreen beansLettuceOnions brownOrangesPearsPotatoesTomatoesTotal 888.392.292.293.3Inner .695.292.394.540% respectively). Meat was usually sold frozen in remote areas and fresh in urban areas, possibly accountingfor the price not increasing. Non-core foods in the healthyfood basket, such as sugar, fats and oils, cost 32% morein remote areas. The price of the small selection of nonperishable, heavily marketed “junk foods” cost about35% more and cigarettes cost 14% more in very remoteareas than capital cities. The additional cost of these itemsin very remote communities could be a disincentive toconsumption; however, at this time there are no dietarysurveys available to explore this further. Bussey, C (2012)found people living in remote communities were morelikely to feel that they had enough money to buy healthyfood if the stores they accessed were selling a range ofnutritious foods, had good management, and promotedand marketed healthy food.45Affordability of foodThe affordability of food changes as it competes withother fixed (eg. housing, transport, power) or unexpected(eg. medical emergency, car maintenance) householdexpenses. Housing, food and non-alcoholic beveragesexpenditure (in that order) accounted for the greatest proportion of goods and services costs in WA in 2010 (website http://www.abs.gov.au/ausstats). Decreases in houseaffordability in WA has led to higher rental demand affecting availability and price, and increases in homelessness. The sociodemographic characteristics of peoplesuffering food insecurity includes low income, renting (asopposed to home ownership), homelessness, single parenthouseholds, and Indigenous peoples.5 An Australianstudy of people accessing emergency food relief servicesin 2012 found that 94% of private renters experienced“rental stress” (with 30% of household income spent onrent).5 Half said it was difficult to access fresh food, meat,fruit and vegetables due to their cost. For many, foregoingfresh foods and relying on smaller servings of cheapercarbohydrate based cereal foods was how they extendedtheir food dollar.Quality of fresh produce by geographic locationThe quality rating in this current study required 75% ofthe produce on display to meet all quality criteria, possibly measuring a higher standard of quality that theNEMS-S unacceptable rating based on the majority( 50%) being bruised, old looking, over ripe or spotted.36Outer .586.092.086.985.976.084.0Very 86.072.779.5Although overall fruit and vegetables quality was good,the quality of specific produce was rated poorer in remotestores. Poorer quality fresh produce may result from foodsupply transport logistics issues including insufficientrefrigeration and storage over long distances. Long haulrefrigerated transportation is expensive and contributingto food cost in remote locations.Geographical impactOverall in WA, the impact of retail grocery stores that arelocated further from the capital city, is higher food pricing and poorer quality of fruit and vegetables. The affordability of food for people living in geographicallyisolated areas is of particular concern, as along withhigher food prices, many people residing these areas suffer social and economic disadvantage. The availability ofcompetitively priced fresh fruits and vegetables is clearlyan issue in remote communities in WA.Many of the foods that cost disproportionately more ingeographically isolated areas are the very foods that arepromoted in dietary guidelines for health; fresh fruit,fresh vegetables and dairy foods. While food security isaccess for all to sufficient amounts of good quality food,based on healthy eating habits, (without adversely affecting the future food system); food sovereignty respects theright to maintain and develop local capacity to producestaple foods, respecting productive and cultural diversity.46 Food sovereignty plans could be developed as partof food security strategies to foster local production ofculturally relevant and healthy food, provision or sharingstrategies, and promotional activities to assist in developing local food economies.Transport logistics and supply chain efficienciesTransport and freight costs have been identified as majorcontributors to the cost of food in remote communities.16Factors impacting remote transport logistics include distance, delivery mode (road or barge), temperature extremes, road conditions and access issues.43 The disproportionate food costs highlight the need to review supplychain efficiencies and identify actions to reduce the costsin remote communities. The elevated cost is found acrossall foods; however, focus should be on fresh perishablefoods where quality may be affected by transport. Thesefindings support the call for government to provide subsidies for rural and remote area transport of fresh foods to
710CM Pollard, T Landrigan, P Ellies, D Kerr, M Lester and S Goodchildreshape the food supply to encourage equitable access tohealthier foods in rural and remote communities.47Policy responsePolicy to improve the affordability and quality of foodrequires cross sector collaboration. Monitoring food priceand quality is essential to develop effective interventionsto improve food suppl
compromise the quality or quantity of their diet because of a lack of money or access to food.5 Australians relying on the lowest income have to pay the greatest percentage of their income towards food.6 10 Food insecurity and diet-sensitive chronic disease Food security can be defined as existing "when all people,