Transcription
FACTORSAFFECTINGHEALTH
FACTORS AFFECTING HEALTHFactors affecting health, the social and economic conditions in which people are born, grow, live, work, and age, arecalled the social determinants of health. Since the mid 1980s, the understanding that these determinants of health arecritical to the health and well-being of populations has grown and the determinants of health are now almost universally accepted by health systems across the world. (Wilkinson & Marmot, 2003). The Public Health Agency of Canadaidentified 12 key determinants of health in 2010 (Public Health Agency of Canada, 2010): Income and social statusSocial support networksEducation and literacyEmployment / working conditionsSocial environmentsPhysical environmentsPersonal health practices and coping skillsHealthy child developmentBiology and genetic endowmentHealth servicesGenderCultureFor the purposes of this report, five factors affecting health are discussed: HousingPovertySafetySense of belongingTransportationData reported in this section are from a wide variety of sources - organizational utilization data, national census, enforcement agency occurrence data and national and local survey data.Factors Affecting Health91
KEY FINDINGS 92Between 2009 and 2010, about 100 women and their families used emergency housing available throughHaldimand and Norfolk Women’s Services (Figure 54).The number of applications for social housing in Haldimand and Norfolk remained fairly stable between 2008and 2010 (Figure 55).Among the types of applicants for social housing in Haldimand and Norfolk counties combined, the number ofsingle individuals applying for social housing increased from 151 in 2008 to 167 in 2010 (Figure 55).Between 2008 and 2010 between 115 and 120 applicants were housed each year.Fewer private households in Haldimand County (5.5%) and Norfolk County (5.9%) reported incomes below thelow income cut-offs (LICOs) using after tax income than in Ontario (11.1%) in 2006 (Figure 56).Considered by urban area, there was a wide range in low income households from 3.4% in Caledonia to13.0% in Cayuga (Figure 57 and Figure 58).The Haldimand-Norfolk Health and Social Services Department Ontario Works caseload increased 44.0%between 2006 and 2010 (reported for the months January to October annually) (Figure 59).The overall number of primary offences reported to the OPP in Haldimand County (Figure 61) decreased byalmost 10% (9.6%) between 2006 and 2010.The overall number of primary offences reported to the OPP in Norfolk County (Figure 63) fluctuated between2006 and 2010 before ultimately increasing slightly from 20,827 to 20,867 in the five years.Considered by types of offences, the most significant decreases were violent offences in Haldimand County(Figure 63) which decreased 26.8% between 2006 and 2010, and property offences in Norfolk County (Figure64) which decreased 13.2% for the same time period.The number of domestic offences reported to the OPP in Haldimand County (Figure 62) increased 20.0%between 2006 and 2010 and the number reported in Norfolk County increased by almost 60% (59.5%).The proportion of residents 12 years and older in Haldimand and Norfolk counties combined who reportedhaving a strong sense of belonging increased between 2005 (63.2% CI 4.7) and 2008 (75.2% CI 5.7) andin 2008 was higher than that reported in Ontario (65.1% CI 1.1) (Figure 66).The vast majority of respondents (92%) to the Haldimand-Norfolk Rural Transportation Initiative (H&N RTI) survey believed that a public transportation system is needed in Haldimand and Norfolk counties (Haldimand-Norfolk Health and Social Services Department, 2009).According to the H&N RTI survey, individuals who were students, retired, unemployed and other had thegreatest difficulty travelling whenever they needed / wanted to (Figure 68).More than half of all respondents in all types of employment and education who responded to the H&N RTIsurvey reported a willingness to use public transportation if it was made available to them (Figure 70).Factors Affecting Health
FOR MORE INFORMATION Child Nutrition Network of Haldimand-Norfolk ld-nutrition-networkGovernment of Ontario (2010). Breaking the Cycle: Ontario’s Poverty Reduction Strategy. Available at eakingthecycle/Poverty Report EN.pdfHaldimand-Norfolk Health and Social Services Department (2009). Public Transportation Systems inHaldimand County and Norfolk County Feasibility StudyHaldimand-Norfolk Health and Social Services Department, Social Housing Division www.haldimand-norfolk.org//index.php?option com content&task section&id 6&Itemid 28Haldimand and Norfolk Rural Transportation Initiative (2008), Spinning Your Wheels Update. Available at www.cashn.on.ca/Spinning%20Your%20Wheels%20Update final jan08.pdfOntario Public Health Association (1997). Public Health Approach to Violence Prevention. Available at http://ywcacanada.ca/data/research docs/00000049.pdfSalvation Army Family and Community Services (Dunnville)Statistics Canada (2006). Measuring Violence Against Women, Statistical Trends. Available at 001-eng.pdfUnited Way of Haldimand and Norfolk www.unitedwayhn.on.ca/Factors Affecting Health93
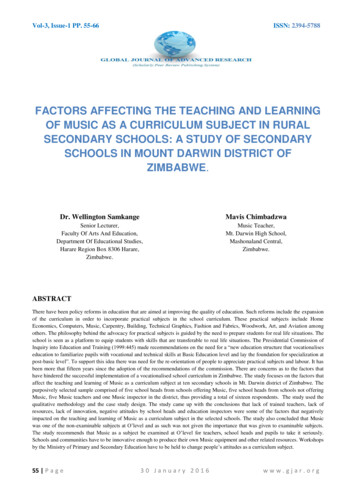
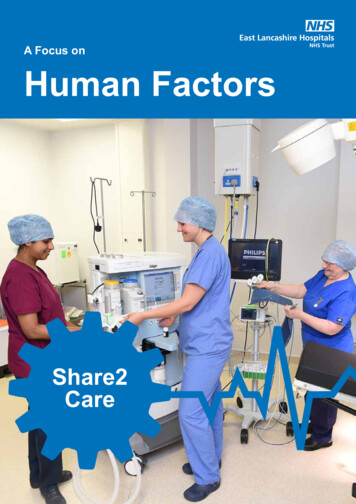
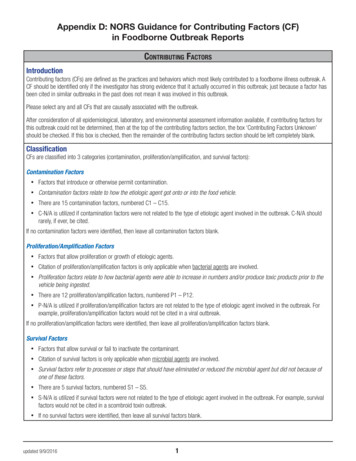
HOUSINGAccording to Humans Resources and Skills Development Canada, “A safe and comfortable place to live isfundamental to our sense of wellbeing. When housing is inadequate or unavailable, individual as well as communitywellbeing may suffer (Human Resources and Skills Development Canada, 2011).” As the largest component of ahousehold budget, housing is also recognized as an important factor in the financial security of Canadians (HumanResources and Skills Development Canada, 2011). Numerous studies show that the lack of quality housing andhomelessness are “clear threats to the health of Canadians (Mikkonen & Raphael, 2010).”Between 2009 and 2010, about 100 women and their families used emergency housing available through HaldimandNorfolk Women s Services (Figure 54). Illustrated in Figure 55, the number of applications for social housing remainedfairly stable between 2008and 2010. Among the typesof applicants, the number ofsingle individuals applyingfor social housing increasedfrom 151 in 2008 to 167 in2010. For the years 2008– 2010, between 115 and120 applicants were housedeach year. Utilization of theseservices reflects a number offactors, including demand andavailable agency resourcesand should not be consideredas a reflection of need.There are a number of groupsand organizations working toaddress affordable housingin the community includingHaldimand-Norfolk HousingHaldimand-Norfolk SocialHousing, Salvation ArmyFamily and Community Services (Dunnville office) and Haldimand and Norfolk Women’s Services. The HaldimandNorfolk Health Unit recently prepared a report for Norfolk County’s Health and Social Services Committee outlining keypoverty issues for residents in Haldimand County and Norfolk County, including affordable housing.ANALYSIS 94There are several agencies providing housing support in Haldimand County and Norfolk County includingHaldimand-Norfolk Social Housing, Salvation Army Family and Community Services (Dunnville office) andHaldimand and Norfolk Women’s Services.Haldimand and Norfolk Women’s Services provides emergency and transitional shelter for women and theirfamilies who are victims of domestic violence. Utilization data presented in Figure 54 shows that between 2009and 2010, slightly more than 100 women and their families used emergency shelter, and use of transitionalhousing increased from 116 in 2009 to 148 in 2010.Factors Affecting Health
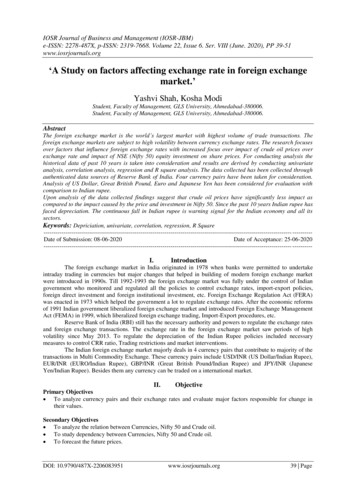
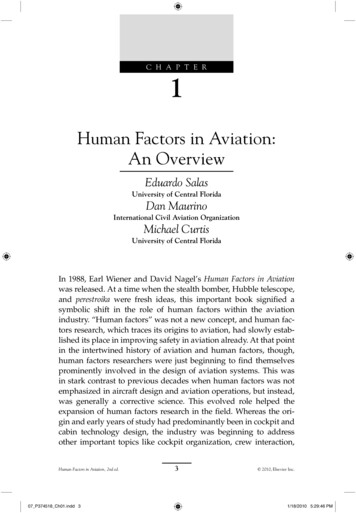
Figure 54: Supportive and Transitional Housing, Women and Families, by Type, Haldimand and Norfolk Counties,2009-2010Data Source: Haldimand-Norfolk Women’s Services, Annual Reports 2009 and 2010. Social housing had 826 housing units in Haldimand and Norfolk counties combined for the years 2008-2010(Haldimand-Norfolk Health and Social Services Housing Division, 2011).Between 115 and 120 applicants were housed each year for 2008-2010 (Haldimand-Norfolk Health andSocial Services Housing Division, 2011).The typical waiting list duration was between one and three years, depending on the housing location(Haldimand-Norfolk Health and Social Services Housing Division, 2011).Demand for Haldimand-Norfolk Social Housing remained fairly stable between 2008 and 2010. Figure 55illustrates that Haldimand-Norfolk Social Housing received 279 applications for supportive housing in 2008and 286 in each of 2009 and 2010.The number of families and single individuals under 65 who apply for social housing increased from 89 familiesand 151 single individuals under 65 to 92 families and 167 single individuals under 65 in 2010 (Figure 55).Factors Affecting Health95
Figure 55: Social Housing Applicants by Type, Haldimand County and Norfolk County, 2008-2010Data Source: Haldimand-Norfolk Social Housing, March 201196Factors Affecting Health
POVERTYPoverty has been recognized as a critical factor in the social determinants of health. Mikkonen and Raphael note intheir 2010 monograph on the social determinants of health in Canada that, “Level of income shapes overall livingconditions, affects psychological functioning, and influences health-related behaviours such as quality of diet, extent ofphysical activity, tobacco use, and excessive alcohol use (Mikkonen & Raphael, 2010).”To underscore this point, Mikkonen and Raphael cited a 30-year Canadian study that examined mortality byneighbourhood income in urban Canada. The study, published in 2007, found that men who lived in the wealthiest20% of neighbourhoods in Canada lived on average more than four years longer than men who lived in the poorest20% of neighbourhoods. Death rates in the least deprived neighbourhoods were 28% lower than death rates in themost deprived neighbourhoods. (Mikkonen & Raphael, 2010) Food insecurity, a component of poverty, is reported tobe an excellent predictor for Canadians reporting poor or fair health. Individuals who reported living in a “food insecurehousehold” were more likely to experience poor functional health, multiple chronic diseases and major depression ordistress (Vozoris & Tarasuk, 2003). In 2010, the Ontario provincial government introduced a new strategy to addresspoverty in Ontario called “Breaking the Cycle” (Government of Ontario, 2010).One measure developed and used by Statistics Canada to convey the income level at which a family may be in“straitened circumstances” is called “low income cut-offs” (LICOs). It is considered a low income cut-off becauseunder that level, a family must spend a greater portion of its income on the basics (food, clothing and shelter) thandoes the average family of similar size. The LICOs vary by family size and by size of community (Statistics Canada,2011). Illustrated in Figure 56, fewer private households in Haldimand County (5.5%) and Norfolk County (5.9%)reported incomes below the low income cut-offs (LICOs) using after tax income than in Ontario (11.1%) in 2006.Considered by urban areas, Figure 57 and Figure 58 show that Cayuga (13.0%), Simcoe (8.8%), Dunnville (8.7%)and Delhi (8.1%) had a higher percentage of private households reporting incomes lower than the LICOs and thatWaterford (4.1%) and Caledonia (3.4%) had the lowest proportion of the same in 2006. The Haldimand-Norfolk Healthand Social Services Department Ontario Works caseload reported in Figure 59 showed a dramatic increase (44.0%) inthe number of cases between 2006 and 2010 (reported for the months January to October annually). Between 1998and 2010 the number of Student Nutrition Programs in Haldimand and Norfolk grew four-fold (Figure 60).Updated data for 2010 is needed to understand how the recent economic situation in Ontario and nationallyhas impacted on residents in Haldimand and Norfolk. Further investigation of the low income levels in specificcommunities, and by lone parent families, will help to understand the nature of low income in the Haldimand andNorfolk communities and target efforts to address areas of greatest priority.Numerous community groups are working to address the issue of poverty in the Haldimand and Norfolk communitiesincluding the Children’s Aid Society of Haldimand and Norfolk, Haldimand-Norfolk Community Action Plan forChildren, Haldimand-Norfolk Health and Social Services Department, Haldimand and Norfolk Women’s Services,Ontario Provincial Police (Haldimand and Norfolk detachments), the Salvation Army Family and Community Services(Dunnville office), the United Way of Haldimand and Norfolk and numerous churches, service clubs, community groupsand individuals. The Haldimand-Norfolk Health Unit prepared a report for Norfolk County s Health and Social ServicesCommittee in January 2011 outlining key poverty issues for residents in the counties, including affordable housing.The report summarized recent initiatives to address issues around poverty in Haldimand and Norfolk, including: Forming a Community Stability Forum which included a large group of service providers, local politicians andvolunteers interested in addressing how to best assist the community during the recession. The Forum developed two initiatives to build dialogue between service providers and those with low incomes (Living on a Budget and Do the Math).Accessed funding through the Norfolk District Business Development Corporation for funds to continue tobuild community awareness through the Community Stability Forum.The ongoing work of the Healthy Communities Initiative to improve access to priority health promotionprograms and services in Ontario.Factors Affecting Health97
ANALYSIS One in ten private households (11.6%) in Haldimand and Norfolk counties combined were lone parent familiesin 2006. In Ontario, 15.8% of families are lone-parent families. More than three-quarters of lone parent familiesin Haldimand and Norfolk counties combined were led by females (76.4%) (Haldimand-Norfolk Health Unit,2011).In 2007, 5.7% of households in Haldimand and Norfolk counties combined were classified as “food insecure”compared to Ontario at 7.1% (Haldimand-Norfolk Health Unit, 2009).Considered by both before and after tax income, the proportion of private households in Haldimand Countyand Norfolk County who lived below the low income cut-offs was lower than in Ontario (Haldimand-NorfolkHealth Unit, 2011).Using before tax income, the percentage of private households in Haldimand and Norfolk counties combinedwho reported incomes below the low income cut-offs decreased slightly between 2001 and 2006, from 9.0%to 8.7%. In Ontario the percentage of private households who reported incomes below the low income cutoffs increased slightly for the same time period, from 14.4% to 14.7% (Haldimand-Norfolk Health Unit, 2011).Considered by after tax income in 2006 and illustrated in Figure 56, only 5.5% of private households inHaldimand County lived below the low income cut-off compared to 5.9% in Norfolk County and 11.1% inOntario.Figure 56: Low-Income Cut-Offs After Tax Income, Private Households 15 Years and Older, Haldimand County,Norfolk County and Ontario, 2006Data Source: Census, Community Profiles, by Health Region, 2006. Data Notes: Private household refers to a person or a group of persons (otherthan foreign residents) who occupy the same dwelling and do not have a usual place of residence elsewhere in Canada. 98Considered by Haldimand County urban areas and after tax income for all residents 15 years and older in2006, Figure 57 shows that Cayuga had the highest percentage (13.0%) of private households living below thelow income cut-offs and Caledonia had the lowest (3.4%) in the County.Factors Affecting Health
Figure 57: Low-Income Cut-Offs After Tax Income, Private Households 15 Years and Older, Haldimand Countyand Urban Areas, 2006Data Sources: Census, Community Profiles, by Health Region, 2006.Data Notes: Private household refers to a person or a group of persons (otherthan foreign residents) who occupy the same dwelling and do not have a usual place of residence elsewhere in Canada. Considered by Norfolk County urban areas and after tax income for all residents 15 years and older in 2006,Figure 58 shows that Simcoe had the highest percentage (8.8%) of private households living below the lowincome cut-offs followed closely by Delhi (8.1%). Waterford has the lowest percentage of residents 15 yearsand older (4.1%) who were living below LICOs in the County.Figure 58: Low-Income Cut-Offs, After Tax Income, Private Households 15 Years and Older, Norfolk County andUrban Areas, 2006Data Sources: Census, Community Profiles, by Health Region, 2006. Data Notes: Private household refers to a person or a group of persons (otherthan foreign residents) who occupy the same dwelling and do not have a usual place of residence elsewhere in Canada. When considered by private households of persons 17 and under and using before tax income (data usingafter tax income was not available), the proportion of private households of persons 17 and under whoreported incomes below LICOs increased slightly from 2001 to 2006 in Haldimand and Norfolk countiescombined, from 10.6% to 10.8%, and in Ontario from 17.0% to 18.0%.Factors Affecting Health99
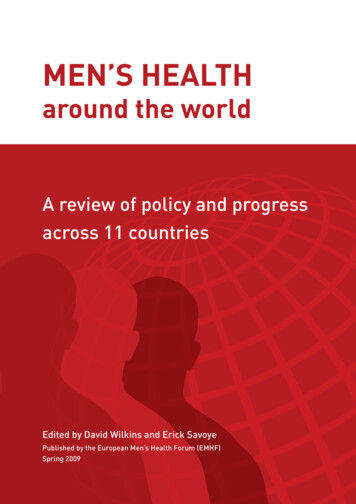
Figure 59: Ontario Works Caseload, Haldimand and Norfolk Counties Combined, 2006-2010*Data Source: Haldimand-Norfolk Health and Social Services, Ontario Works Caseload, 2010. *Data is shown for January-October annually. Dataexcludes data for November and December caseload. Figure 59 shows that the number of individuals on the Ontario Works caseload increased 44.0% between2006 and 2010, from 9,720 to 14,000.The cost of a nutritious food basket estimates the cost it would take to feed a family of four (male and femaleadults aged 31-50 years, one boy aged 14-18 and one girl aged four to eight years) with nutritious foods. InHaldimand County and Norfolk County combined, the estimated cost increased 2.2% between 2009 and2010, from 163.80 in 2009 to 167.53 (Haldimand-Norfolk Health Unit, 2011).Student Nutrition Programs are provided in schools offering breakfast or snacks for all children. StudentNutrition Programs, such as breakfast and snack programs are offered in schools and after-school programs.The programs intent is to support healthy growth and development by providing healthy food to all children.Figure 60 illustrates the growth in this program since 1998 when just seven programs served 280 children andyouth. By 2010 there was an almost five-fold increase in the number of programs since 1998 with 40programs were providing nutritious breakfast and snacks to 7000 children and youth ( Haldimand-NorfolkHealth Unit, 2006).Figure 60: Student Nutrition Programs, Haldimand and Norfolk Counties Combined, 1998, 2005, 2007, 2008,2010Data Source: Health and Social Services, 2010100 Factors Affecting Health
SAFETYCommunity perceptions of safety are important. A community’s perception of safety contributes to a sense of wellbeing, allows individuals freedom of movement, and reduces unintentional injuries. There are other elements of safetythat impact on health. A Canadian research study shows a strong relationship between the commission of crimes andthe use of alcohol and drugs (Pernanen K, 2002) (Toronto Drug Strategy Initiative, 2005).The Haldimand-Norfolk Healthy Communities initiative identified safety as an important indicator of the community’shealth. The Haldimand-Norfolk Healthy Communities initiative is not alone in considering safety as an importantcomponent of health. In 1999, the Ontario Public Health Association built on evidence from the National Forum onHealth (1997) to recognize violence as a social determinant of health and a public health issue (Ontario Public HealthAssociation, 1999). Speaking specifically of family violence, the Forum found that family violence had a negativeimpact on equity, socio-economics, mental, physical and spiritual well-being. In passing a resolution to formallyrecognize violence as a public health issue in 1999, the Ontario Public Health Association wrote, “Violence is a majorcontributor to premature death and disability in Ontario. It is a force that damages the physical, mental and spiritualhealth of individuals. It also threatens basic institutions in Ontario such as the family and the community (Ontario PublicHealth Association, 1999).”In this section, safety was considered by five variables provided by the Ontario Provincial Police (OPP), HaldimandDetachment and Norfolk Detachment: Primary offences are all offences reported in a jurisdiction. A primary offence may also be logged as adomestic, violent, or property offence.Domestic offences are those offences that occur within a domestic relationship.Violent offences are those offences that involve physical harm to another individual.Property offences are offences in which property was involved, but no individuals are injured.Motor vehicle collisions (MVCs) are motor vehicle collisions that are reported to the police.Another critical aspect in the concept of safety is unintentional injuries. Unintentional injuries have been discussedextensively in Health Status, Unintentional Injuries (page 59).Offences reported are actual occurrences, not a rate using a standardized population. Because of the different totalpopulation in Haldimand County and Norfolk County, this data should not be used to compare the experiences of thetwo counties, and it is not possible to compare against rates for the same categories of offences in Ontario.The OPP reported offences for four categories between 2006 and 2010: the overall offence category of “primaryoffences” (Figure 61) and then the sub-categories of domestic offences (Figure 62), violent offences (Figure 63) andproperty offences (Figure 64). The number of motor vehicle collisions for 2006-2010 is reported in Figure 65.Overall, the number of primary offences shown in Figure 61 decreased in Haldimand County by almost 10% (9.6%)between 2006 and 2010, while in Norfolk County they fluctuated but ultimately increased slightly from 20,827 to20,867 in the five years. Likewise, the number of violent offences (Figure 63) and property offences (Figure 64)reported in each county fluctuated or declined between 2006 and 2010. The most significant decreases were amongviolent offences in Haldimand County which decreased 26.8% between 2006 and 2010, and property offences inNorfolk County which decreased 13.2% for the same time period. Likewise, the number of reported motor vehiclecollisions decreased in each county. Figure 65 illustrates that in Haldimand County, the number of reported MVCsdecreased by almost 20% (19.3%) and in Norfolk County the total number reported decreased by 5.2%, between2006 and 2010.Factors Affecting Health 101
Among all the types of offences reported, only the number of domestic offences reported to the OPP increased inboth Haldimand County and Norfolk County between 2006 and 2010. Shown in Figure 62, the number of domesticoffences reported in Haldimand County increased by an alarming 20.0% between 2006 and 2010. For the same timeperiod the number of domestic offences reported in Norfolk County increased dramatically by almost 60% (59.5%).However, there are three challenges with this data. Changes to laws, and policies about how charges are laid, mayhave had tremendous impact on the number of offences reported. Second, all of the data in this section showsthe number of offences or MVCs reported to the local OPP detachments, not actual incidents. There is evidencethat some crimes are under-reported and thus not accurately reflected in statistics that reflect only reported crimes(Statistics Canada, 2010). Finally, without standardized rates, it is difficult to determine whether the reported offencesand MVCs in Haldimand County and Norfolk County are either above, or below, those experienced by Ontarioas a whole, or even how each County fares in comparison to each other. Creating standardized rates will help tounderstand the significance of these reported incidences, and identify areas for targeted action.The Ontario Provincial Police, Children’s Aid Society of Haldimand and Norfolk, CrimeStoppers of Haldimand, Norfolkand Tillsonburg, Haldimand and Norfolk Women’s Services, St. Leonard’s Society, school boards, municipalities,business associations and neighbourhood groups are important stakeholders in addressing safety. However, agenciesand organizations who are primarily interested in health issues rarely address safety outside of the area of unintentionalinjuries. Action by all parties will be important to take action on creating a safer Haldimand and Norfolk.ANALYSIS The Ontario Provincial Police’s Community Satisfaction Survey conducted in 2009 reported that 95.4% ofOntarians felt "safe" or "very safe" in their community (Rigby, 2011).The OPP reported offences for four categories between 2006 and 2010: the overall offence category of“primary offences” (Figure 61) and then the sub-categories of domestic offences (Figure 62), violent offences(Figure 63) and property offences (Figure 64). The number of motor vehicle collisions for 2006-2010 is reportedin Figure 65.Considered by the overall category of primary offences, the frequency of primary offences declined steadilyin Haldimand County, from 14,486 reported primary offences in 2006 to 13,096 in 2010, an overall decreaseof 9.6%.In Norfolk County, the number of primary offences declined from 20,827 in 2006 to 20,375 in 2009 beforerising again to 20,867 in 2010.102 Factors Affecting Health
Figure 61: Primary Offences Reported, Haldimand County and Norfolk County, 2006-2010Data Source: Ontario Provincial Police, Haldimand Detachment and Norfolk Detachment, February 2011 Figure 62 shows that the number of domestic offences reported to police in both Haldimand County andNorfolk County increased between 2006 and 2010. In Haldimand County, the number of domestic offencesincreased from 175 in 2006 to 210 in 2010, an increase of 20.0%. The number of domestic offences in NorfolkCounty increased dramatically from 299 in 2006 to 477 in 2010, an increase of 59.5%.Figure 62: Domestic Offences Reported, Haldimand County and Norfolk County, 2006-2010Data Source: Ontario Provincial Police, Haldimand Detachment and Norfolk Detachment, February 2011 The number of violent offences, shown in Figure 63, decreased in both Haldimand County and Norfolk Countybetween 2006 and 2010. In 2006, 556 violent offences were reported in Haldimand County, and 407 in 2010,a decrease since 2006 of 26.8%.Figure 63 shows that violent offences in Norfolk County fluctuated between 2006 and 2009 before ultimatelydeclining in 2010. In Norfolk County, 745 violent offences were reported in 2006. This number declined in2007 (681) before increasing in 2008 (746) and 2009 (787), before declining to 693 in 2010, an overalldecrease of 7.0% in the time period.Factors Affecting Health 103
Figure 63: Violent Offences Reported, Haldimand County and Norfolk County, 2006-2010Data Source: Ontario Provincial Police, Haldimand Detachment and Norfolk Detachment, February 2011 The number of property offences reported in Haldimand County (Figure 64) fluctuated between 2006 (1550)and 2009 (1717), but ultimately remained unchanged at 1550 in 2010.In Norfolk County the number of property offences reported to the OPP (Figure 64) declined more-or-lesssteadily from 2640 in 2006, to 2372 in 2007, increased to 2458 in 2008 before declining to 2379 in 2009 and2291 in 2010, an overall decrease of 13.2% between 2006 and 2010.Figure 64: Property Offences Reported, Haldimand County and Norfolk County, 2006-2010Data Source: Ontario Provincial Police, Haldimand Detachment and Norfolk Detachment, February 2011 Motor vehicle collisions (MVCs) reported to the OPP in Haldimand County and Norfolk County between 2006and 2010 are shown in Figure 65. In both Haldimand County and Norfolk County, MVCs fluctuated butultimately declined during the time period.In Haldimand County there were 864 MVCs were reported in 2006, the number increased in 2007 (996) and2008 (910) before decreasing in 2009 (853) and 2010 (697), an overall decrease of 19.3%.MVCs in Norfolk County followed a similar pattern. In 2006, 1140 motor vehicle collisions were reported toOPP in Norfolk County. The total number of MVCs increased to 1212 in 2007 before decreasing to 1134 in2008 and 1073 in 2009 before increasing slightly to 1081 in 2010, an overall decrease of 5.2% in the timeperiod.104 Factors Affecting Health
Figure 65: Motor Vehicle Collisions Reported, Haldimand County and Norfolk County, 2006-2010Data Source: Ontario Provincial Police, Haldimand Detachment and Norfolk Detachment, February 2011Factors Affecting Health 105
SENSE OF BELONGINGA sense of belonging is an important aspect of an individual’s sense of well-being. According to Health Canada:A feeling of belonging to a country, region, and local community can influence people's sense ofidentity and the extent to which they participate in society. Generally, a strong sense of belongingis positively associated with better self-reported physical and mental health. A strong sense ofbelonging also contributes to individual and community wellbeing (Human Resources and SkillsDevelopment Canada, 2011).Moreover, Mikkonen and Raphael (2010) noted that being socially excluded, or having a poor sense of belonging, hadadverse social and health effects. They reported that socially excluded Canadians were more likely to be unemployedand earn lower wages and have less access to health and social services and education (Mikkonen & Raphael, 2010).Human Resources and Skills Development Canada has determined that an individual’s sense of belongin
critical to the health and well-being of populations has grown and the determinants of health are now almost univer-sally accepted by health systems across the world. (Wilkinson & Marmot, 2003). The Public Health Agency of Canada identified 12 key determinants of health in 2010 (Public Health

![05[2] Strategy competitors, competitive rivalry .](/img/2/052-strategy-competitors-competitive-rivalry-competitive-behavior-and-competitive-dynamics.jpg)