Transcription
Education Tech Research Dev (2021) 9998-zRESEARCH ARTICLEPredict or describe? How learning analytics dashboarddesign influences motivation and statistics anxietyin an online statistics courseNatercia Valle1 · Pavlo Antonenko1 · Denis Valle1 · Max Sommer1 ·Anne Corinne Huggins‑Manley1 · Kara Dawson1 · Dongho Kim2 · Benjamin Baiser1Accepted: 13 May 2021 / Published online: 26 May 2021 Association for Educational Communications and Technology 2021AbstractBased on the achievement goal theory, this experimental study explored the influence ofpredictive and descriptive learning analytics dashboards on graduate students’ motivationand statistics anxiety in an online graduate-level statistics course. Participants were randomly assigned into one of three groups: (a) predictive dashboard, (b) descriptive dashboard, or (c) control (i.e., no dashboard). Measures of motivation and statistical anxietywere collected in the beginning and the end of the semester via the Motivated Strategies forLearning Questionnaire and Statistical Anxiety Rating Scale. Individual semi-structuredinterviews were used to understand learners’ perceptions of the course and whether the useof the dashboards influenced the meaning of their learning experiences. Results indicatethat, compared to the control group, the predictive dashboard significantly reduced learners’ interpretation anxiety and had an effect on intrinsic goal orientation that depended onlearners’ lower or higher initial levels of intrinsic goal orientation. In comparison to thecontrol group, both predictive and descriptive dashboards reduced worth of anxiety (negative attitudes towards statistics) for learners who started the course with higher levels ofworth anxiety. Thematic analysis revealed that learners who adopted a more performanceavoidance goal orientation approach demonstrated higher levels of anxiety regardless ofthe dashboard used.Keywords Learning analytics dashboards · Achievement goal theory · Motivation ·Statistics anxiety · Online learning* Natercia Vallenaterciavalle@gmail.com1University of Florida, Gainesville, FL, USA2Sungkyunkwan University, Seoul, South Korea13Vol.:(0123456789)
1406N. Valle et al.IntroductionA large number of undergraduate and graduate programs include statistics courses as partof their core curriculum. Unfortunately, statistics is perceived as a difficult subject by manylearners (DeVaney, 2016; Hanna et al., 2008) and, as a result, many learners develop negative feelings towards statistics courses, statistics content, and even statistics instructors. Notsurprisingly, statistics anxiety has been explored in numerous studies as part of a broaderconceptualization that involves math anxiety, self-efficacy, motivation, and goal orientation (Hsu et al., 2009; Onwuegbuzie, 2004; Zeidner, 1991). Importantly, statistics anxietymay be compounded in online learning environments due to lack of immediate feedbackfrom instructors and the requirements for great levels of metacognitive skills as well asproficiency in technology, especially when statistical software is used (Hsu et al., 2009;Zimmerman, 2008). This is a critical issue because online learning continues to grow andhas dramatically expanded as a function of the public health crisis created by the COVID19 virus. If most academic leaders (66%) already considered online learning as an essentialpart of their long-term strategies (Allen & Seaman, 2014), this focus is likely to becomeeven more prominent now that many educational institutions have developed their ownstructures to offer online instruction.This study investigates how to better support learners’ affective and cognitive outcomesin online learning environments by using an important affordance of online contexts: learning analytics. More specifically, we designed and tested two learning analytics dashboards– predictive self-referenced vs. descriptive norm-referenced (Biesinger & Crippen, 2010;Koenka & Anderman, 2019) – to explore how different design and pedagogical featuresinfluence learners’ motivation, statistics anxiety, and learning performance in an introductory online statistics course. In this study, learning analytics dashboards are presented asvisual displays of customized feedback on learning performance and information about thecourse timeline (Park & Jo, 2015; Tan et al., 2017). Despite the increasing interest in thepotential of learning analytics to support learners’ reflection, behavioral changes, motivation, and learning performance (Gašević et al., 2015; Park & Jo, 2019), empirical studies investigating the influence of learning analytics dashboards on learners’ cognitive andaffective outcomes are still limited (Bodily & Verbert, 2017; Jivet et al., 2018), particularlyin authentic settings such as online statistics courses and that are based on an experimentaldesign. This study represents a step to fill this void.Theoretical backgroundStatistics anxietyStatistics anxiety can be described as the anxiety learners experience when dealing withstatistics “in any form and at any level” (Onwuegbuzie, 2004). Statistics anxiety is reflectedby the mental disorganization, worry, and tension that learners feel when they have to workwith statistics content or problems (Zeidner, 1990). Statistics anxiety usually develops fromsituational, dispositional, or environmental antecedents (Onwuegbuzie & Wilson, 2003).Statistics anxiety is a multidimensional construct that differentiates between test- andcontent-related anxiety (Cruise et al., 1985; Onwuegbuzie, 1997; Zeidner, 1991). For13
Predict or describe? How learning analytics dashboard design 1407example, Cruise et al. (1985) described six components of statistics anxiety: (a) worth ofstatistics (perceived usefulness of statistics, negative attitude towards statistics); (b) interpretation anxiety (anxiety when interpreting statistical results); (c) test and class anxiety(anxiety experienced when taking a statistics test or attending a statistics class); (d) computational self-concept (anxiety related to mathematical calculations); (e) fear of askingfor help (anxiety experienced when help seeking is considered); and (f) fear of statisticsinstructors (negative attitudes toward statistics teachers). A similar typology of statisticsanxiety was also proposed by Onwuegbuzie (1997).There is overwhelming evidence that motivation influences learners’ statistics anxiety,learning experience, and performance in statistics courses (Lavasani et al., 2014; Onwuegbuzie & Seaman, 1995; Onwuegbuzie & Wilson, 2003). For example, when learners areanxious about underperforming in an exam, this negative emotion can impact their ability to employ appropriate metacognitive strategies. On the other hand, when learners areintrinsically motivated to learn the content, they are more likely to develop positive emotions and employ appropriate learning strategies (Linnenbrink-Garcia et al., 2016). Despitethe interactions between motivation and anxiety, there is a lack of research on how theoriesof motivation can be used to develop learning analytics tools, such as learning analyticsdashboards, to support learners’ motivation (Bodily & Verbert, 2017; Lonn et al., 2015)and learning performance in anxiety-inducive courses such as statistics. This practical andtheoretical gap guided the design and implementation of the present study.MotivationAchievement goal theoryAchievement goal theory was used in the conceptualization of this study because it recognizes the influence of learners’ goal orientations on cognitive and affective outcomes(Ames, 1992; Elliott & Dweck, 1988). From a traditional perspective of achievement goaltheory, learners can adopt two types of goal orientations: performance or mastery goals. Amastery goal orientation focuses on individual progress and learning, while a performancegoal orientation focuses on relative ability and comparison with other learners (Ames,1992; Pintrich, 2000b).Elliot and colleagues expanded the dichotomic conceptualization of mastery versusperformance goal orientations by including two valences (i.e., approach and avoidance) tothe traditional mastery and performance goal orientations (Elliot & Harackiewicz, 1996;Elliot & McGregor, 1999; Elliott & Dweck, 1988). Based on this newer 2 2 model ofgoal orientation, learners with performance-approach goals want to demonstrate ability andcompetency in comparison to others – normative goal theory (Harackiewicz et al., 2002)whereas learners with performance-avoidance goals do not want to be perceived as incompetent. Similarly, learners with mastery-approach goals focus on the mastery of the contentwhile those with mastery-avoidance goals worry about not learning the content (Pintrich,2000b). In addition to this 2 2 goal orientation model, another model involves self-basedapproach goals (e.g., Personal-Best goals, 3 2 model: task goals, self-goals and othergoals), which focus on learners’ prior performance and experiences (Elliot et al., 2011).13
1408N. Valle et al.It is worth noting that self-based goals align with mastery goals, in which performance isbased on the individual’s own learning progress in relation to prior performance.Finally, more contemporary conceptualizations of goal orientation combine mastery andperformance goals within learners (Barron & Harackiewicz, 2001; Darnon et al., 2010). Forexample, students may have an intrinsic interest in statistics (i.e., mastery goal orientation) andstill pay close attention to their grades on quizzes and exams (i.e., performance goal orientation) as a way of monitoring their learning throughout the course and adjusting their metacognitive strategies as needed. This approach is referred to as the multiple goal perspective in contrast to the traditional normative goal theory, which proposes that mastery and performancegoal orientations are mutually exclusive (Harackiewicz et al., 2002). The learning analyticsdashboards used in this study subscribe to the multiple goal perspective, which combines performance and mastery goal orientation elements.Learning analytics dashboardsAdvances in technology to record and store unprecedented amounts of learners’ data enableenhanced evaluation of pedagogical practices through the use of learning analytics approaches.Learning analytics involves the “measurement, collection, analysis and reporting of data aboutlearners and their contexts, for purposes of understanding and optimizing learning and theenvironments in which it occurs” (Siemens & Gasevic, 2012, p. 1). As an application of learning analytics, dashboards are helpful data visualization scaffolds that are being increasinglyadopted in online and post-secondary education contexts (Schwendimann et al., 2017; Siemens & Gasevic, 2012).Dashboards help to convey complex quantitative information to the user (instructor, student, course designer, etc.) in a visual form and with digestible, actionable items. For example,instead of providing numeric data on individual assignments, many dashboards summarizethese data visually to emphasize overall trends for each module. It is important, however, thatresearchers and instructors recognize that they bring their own perspectives, epistemologicalstands, as well as biases as they design, develop, and evaluate dashboards (Knight & Shum,2017).It is worth noting that there is a lack of standardization regarding the definitions and terminologies used to describe learning analytics dashboards, which reflects the interdisciplinaryand incipient nature of the field (Bodily & Verbert, 2017; Schwendimann et al., 2017). Someof the most common terms used for these applications include ‘learning dashboards’, ‘educational dashboard’, ‘dashboard for learning analytics’, ‘data dashboard’, ‘web dashboard’, and‘learning analytics dashboards’(Schwendimann et al., 2017).Despite the increasing use of learning analytics dashboards, the body of literature aroundthese applications is relatively small; the field is seen as an incipient area of research under theumbrella of learning analytics (Bodily & Verbert, 2017). The need for more evidence-basedresearch is critical as educators design, implement, and test learning analytics dashboards andtheir influence on students’ motivation, interest, self-regulation, awareness, self-efficacy, andlearning outcomes (Bodily & Verbert, 2017; Jivet et al., 2018; Valle et al., in press). However,most dashboard studies are not framed using theories of motivation, self-efficacy, regulation,and other relevant concepts and so their contributions to the development of theories of howdashboards should be designed and used are limited (Jivet et al., 2018).13
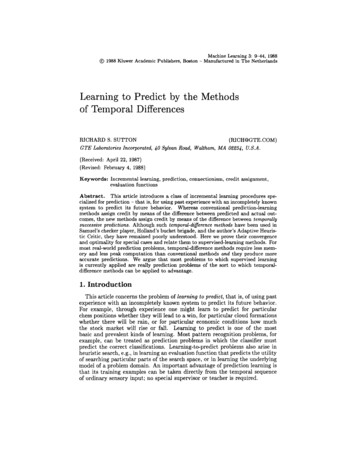
1409Predict or describe? How learning analytics dashboard design Conceptual frameworkTo investigate the potential of dashboard applications as technology-enhanced pedagogical tools to support learners’ cognitive and affective outcomes (Zimmerman, 2008), weadopted a conceptual framework that highlights a multiple goal orientation perspective,where mastery and performance goal orientations elements were used in the design ofour descriptive and predictive learning analytics dashboards (Harackiewicz et al., 2002).Mastery goal orientation is reflected in the emphasis on the content to be learned,specifically the names of topics shown in the graph’s x-axes, which are used in boththe predictive and descriptive dashboards. Performance goal orientation is reflected inthe design of the performance feedback presented to learners, which is either normreferenced in the descriptive dashboard or self-referenced in the predictive dashboard.Norm-referenced feedback compares an individual student’s performance to the performance of the class, whereas self-referenced feedback compares a student performanceon a task relative to this same student’s prior performance (Biesinger & Crippen, 2010;Koenka & Anderman, 2019).Our study’s conceptual framework (Fig. 1) reflects the current gaps in the literatureregarding the cognitive and affective influence of descriptive vs. predictive dashboardson learners (Corrin & de Barba, 2014; Gašević et al., 2015) and informs our researchquestions:To what extent does the use of a predictive or descriptive learning analytics dashboard in an online statistics course influence learners’:––––RQ1 – motivation?RQ2 – statistics anxiety?RQ3 – performance outcomes?RQ4 – How do learners perceive their learning experience, motivation, and statisticsanxiety while using predictive or descriptive learning analytics dashboards?Multiple Goal Orientation s’?MotivationStatistics tionElementsFig. 1 Graphical depiction of the conceptual framework employed by this study13
1410N. Valle et al.Materials and methodsResearch designThis study used quantitative and qualitative data (Creswell et al., 2003; Johnson & Onwuegbuzie, 2004) to provide a more comprehensive account of the use of predictive and descriptivedashboards and their influence on learners’ statistics anxiety, motivation, and learning performance outcomes in an online statistics course. The study was implemented in two semesterswith two different cohorts of participants who were randomly assigned to three groups (control, descriptive, and predictive) and the outcomes for each group were compared. Followingthe IRB approved protocol, we collected the following quantitative information: number ofdashboard views, prior content knowledge scores, prior experience with programming languages, quiz results, final grades, and pre and post results (beginning and end of the semester,respectively) from the Motivation Strategies for Learning Questionnaire scale – MSLQ (Pintrich et al., 1991, 1993) and from the Statistical Anxiety Rating Scale – STARS (Cruise et al.,1985). Qualitative data included open-ended surveys questions at the end of the semester and10 semi-structured individual interviews (Seidman, 2006). While semi-structured individualinterviews were used to collect qualitative data only in one semester, open-ended survey itemswere used in both semesters.ContextThe study was implemented in an introductory online statistics graduate course at a large public university in the southeastern United States during Fall 2018 and Spring 2019. The courseuses Canvas as the learning management system and is organized into 14 modules coveringdifferent statistical concepts. The course is offered twice a year and features video lectures,tutorials, required and optional readings, discussion forums, weekly data and conceptual quizzes, and a final exam. Two instructors, co-authors in this study, facilitate the course and onlinelearning interactions.ParticipantsA convenience sample of 179, representing 69% of all the students (179/261) who wereinvited to participate in the study, completed the study (control 69, descriptive 56, and predictive 54). The majority of participants were female (59.22%,) and Caucasian (55.87%),with a mean age of 28.16 (standard deviation 5.80). The majority of students were pursuinga master’s degree (63.13%), and a large set of the participants had no programming experience (55.87%). When asked about reasons for taking the course, most participants (74.86%)selected the option “Will help improve my academic skills”. A 12-question pre-test assessedstudents’ prior knowledge of statistical concepts such as t-tests and p-values. Participant meanperformance on the pre-test, based on the proportion of correct responses, did not suggestany systematic differences between groups: control 64.73%, descriptive 65.77%, andpredictive 65.74%.13
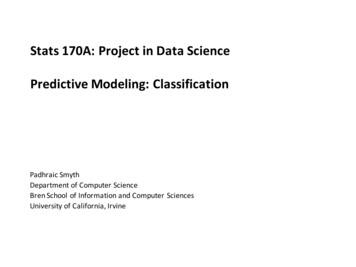
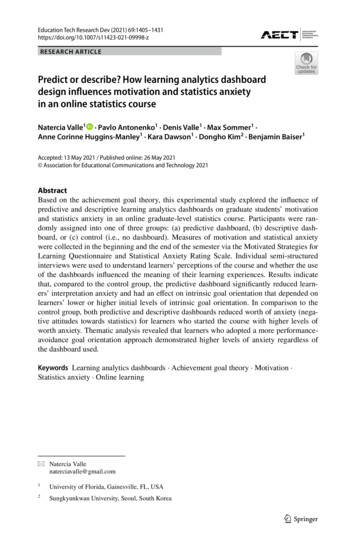
Predict or describe? How learning analytics dashboard design 1411Design and developmentThe predictive and descriptive learning analytics dashboards used as the intervention inthis study were developed using R software (version R 3.5.2 – 2004–2016) and Shiny ,a web development framework that enables the visual display of results from R. The designof the dashboards was based on the multiple goal orientation perspective (Harackiewiczet al., 2002), where elements from the performance approach (e.g., focus on predicted lettergrades) and the mastery goal approach (e.g., focus on the content or skills to be learned)orientations are combined to support learners’ motivation. Importantly, the use of visualfeedback based on learners’ performance in the course was included in the design of thedashboards because it supports learners’ formative assessment and self-regulated learning(Fabiano et al., 2018; Nicol & Macfarlane‐Dick, 2006). Thus, the design of the dashboardswere based on the premise that monitoring of performance is related to metacognitive processes, self-regulated learning, and motivation profiles (Baars & Wijnia, 2018). For example, learners may use the information about their performance to regulate how much timeand effort they should spend studying the course material.Predictive dashboard design and developmentIn the predictive dashboard, performance goal orientation elements were represented bythe predicted probability of learners’ receiving letter grades A, B, C, or D/E at the endof course (Fig. 2). The letter grades were color-coded to facilitate their identification inthe dashboard. Letter grade predictions were updated weekly as the semester progressedaccording to learner performance on weekly quizzes, using a Naïve Bayes model, a popularmachine learning method presented in Appendix A. The mastery goal elements were represented by the focus on the content to be covered in each module (e.g., summary statistics,ANOVA) and on the “learning progression” of individual learners (Fig. 2). For example,the green line in Fig. 2. shows that, based on the quizzes results up to module 5, the probability of this particular individual receiving a letter grade A at the end of the course is 78%whereas the probability a B grade is 21%. This dashboard represented a self-referencedFig. 2 Predictive learning analytics dashboard13
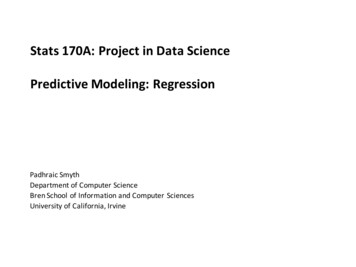
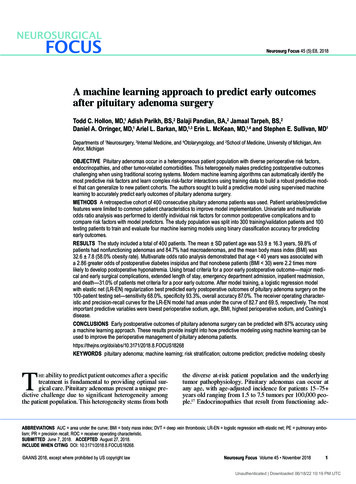
1412N. Valle et al.design approach, where the predictions were pertinent to individual learners only, without class comparison elements such as predictions about other students in the class. Basedon the goal orientation literature, a self-referenced dashboard can reduce competition andanxiety among learners as the focus is on the individual learner and his or her own progressin the course (Elliot & McGregor, 1999; Lavasani et al., 2014). To inform students aboutthe inherent limitations of predictive models, the following disclaimer was included in thedashboard display “These probabilities are based on data from previous semesters of students with similar performance and, therefore, are not 100% accurate”.Descriptive dashboard design and developmentThe descriptive dashboard was conceptualized to represent a more traditional learninganalytics dashboard design. More specifically, descriptive data were used to display students’ learning performance per module relative to the average performance of the class.For example, the solid black line in Fig. 3. shows that a student received 67% of points inmodule 5, while the class average was about 90% for the same module. Average grade andgrades distribution are often used as result-related indicators in learning analytics dashboards (Schwendimann et al., 2017). Similar to the predictive dashboard, the descriptivedashboard also displays mastery goal orientation elements (e.g., content covered in themodules, shown in the x-axis) and the representation of “learning progress” conveyed bythe solid black line.Control groupLearners in the control group only had access to the standard Canvas dashboard, whichpresented descriptive data (e.g., mean scores) and a boxplot with the student’s score perassignment (Fig. 4).All dashboards were updated weekly based on weekly quizzes and participants from allgroups, including the control group, received weekly reminders about these updates. Participants in the Descriptive and Predictive groups could access their dashboard wheneverthey wanted through a link to the web application.Fig. 3 Descriptive learning analytics dashboard13
Predict or describe? How learning analytics dashboard design 1413Fig. 4 Default dashboard available through Canvas Data sources and instrumentsQuantitative measuresIn addition to total quiz scores and final exam scores, we collected pre and post resultsfrom the Motivation Strategies for Learning Questionnaire motivation scale – MSLQ (Pintrich et al., 1991, 1993) and from the Statistical Anxiety Rating Scale – STARS (Cruiseet al., 1985; Hanna et al., 2008).The MSLQ instrument was selected because it is based on the social-cognitive modelof motivation, which is the framework underlying the achievement goal theory (Pintrich,2000a, 2000b). Furthermore, MSLQ addresses affective variables that are relevant to thepresent study, including mastery and performance goal orientations as illustrated by thefollowing items: “The most satisfying thing for me in this course is trying to understandthe content as thoroughly as possible” and “Getting a good grade in this class is the mostsatisfying thing for me right now”, respectively. The MSLQ instrument has been used inmany empirical studies, which offers further evidence of the scales’ construct validity(Schutz et al., 1998; Vahedi et al., 2012).The MSLQ instrument has two scales: a cognitive strategies scale, used to measuremetacognitive learning strategies; and a motivational scale, used to measure motivationalorientations (Pintrich et al., 1993). For this study, we used only the motivational scale,which has 31 items representing six factors and 3 areas of the motivation construct: (a)value, (b) expectancy, and (c) affective components. The value component subscale measures learners’ goals and value beliefs and consists of three subconstructs: (a) intrinsic goalorientation, (b) extrinsic goal orientation, and (c) task value. The expectancy componentsubscale reflects learners’ expectancy beliefs for completing the task and corresponds totwo subconstructs: self-efficacy and control beliefs for learning. Finally, the affective component subscale addresses test anxiety (Pintrich et al., 1993) and does not have any subconstruct. The instrument was presented using a 7-point Likert-style scale, where 1 and 7 represented “Not at all true of me” and “Very true of me,” respectively. For each participant,final scores for each factor were computed by summing the items representing that factorand taking an average. Thus, final scores for each factor range from 1 to 7. Cronbach’salpha results for the MSLQ instrument ranged from 0.65 to 0.94 for the pre-surveys andfrom 0.67 to 0.95 for post-surveys. There were only small differences regarding Cronbach’salpha values from pre- to post-surveys within subconstructs. All Cronbach’s alpha valueswere above 0.70, except for the external motivation subconstruct (pre 𝛼 0.65; post 𝛼 0.67) as shown in Appendix B.The STARS instrument has been widely used to measure statistics anxiety (Hanna et al.,2008; Onwuegbuzie & Wilson, 2003). Furthermore, recent confirmatory factor analysisstudies have discussed the importance of testing STARS accross different contexts (e.g.,13
1414N. Valle et al.face–to–face vs. online) and cultures, and have provided further evidence of the instrument’s construct validity and internal consistency reliability supporting the original sixfactor structure of the instrument (DeVaney, 2016; Papousek et al., 2012). More specifically, the instrument has 51 items, representing 6 factors: (a) worth of statistics, (b)interpretation anxiety, (c) test and class anxiety, (d) computational self-concept, (e) fearof asking for help, and (f) fear of statistics teachers. We used the STARS version adaptedby Hanna et al. (2008) and the instrument was presented using a 5-point Likert-style scale.The first 23 items focused on situations that may trigger anxiety on learners and were presented on a scale from 1 (No anxiety) to 5 (Great deal of anxiety). The remaining 28 itemsfocused on learners’ perceptions of statistics and statistics instructors and were also presented on a scale from 1 (Strongly disagree) to 5 (Strongly agree). Final scores for eachfactor were computed by summing the items within each factor and taking an average.Cronbach’s alpha results for the STARS instrument ranged from 0.77 to 0.93 for the presurvey and from 0.89 to 0.94 for the post-survey (Appendix B).Qualitative measuresThe qualitative data sources included open-ended survey questions and 10 individual semistructured interviews, which were used to understand the meanings participants made fromtheir experience related to using the dashboards in the course (Larkin & Thompson, 2012).The selection of participants for the interviews was based on a convenience samplefrom those students who had already completed the pre-survey on their motivation andstatistics anxiety. We used a purposeful sampling strategy to ensure representation of allgroups (control, predictive or descriptive dashboards) and different genders (Palinkas et al.,2015). Seven females and three males agreed to participate in the interviews. The interviews lasted between 12 min and 33 min (mean 18.5 min) and were conducted by twoof the authors. Although most of the interviews were face-to-face, there were a few onlineinterviews (n 3). It is worth noting that each interviewer conducted interviews with atleast one participant from each group. This was a deliberate decision to account for the roleof the researcher as an instrument (Creswell & Poth, 2018). Following the IRB approvedprotocol, pseudonyms were used in the transcripts to protect the privacy of the participants.The interview protocol included questions such as: “How often do you use [x dashboard]in this course? What has been your experience using it in this course? Did you find anyadvantage or disadvantage in using this resource?Data analysisQuantitative data analysisThe data were organized and analyzed using R programming language (Version R 3.5.2).Only participants who completed pre- and post-surveys and used the dashboards at leastonce (descriptive and predictive groups) were included in the analysis. Using a Wilcoxonrank sum test, we found no statistically significant differences (W 1409.50, p 0.538)between the predictive (Mdn 3.50) and descriptive groups (Mdn 3.00) in relation to thenumber of times learners checked the dashboards. The number of times the dashboard wasused by individual learners was not included in our models because that would increase thenumber of parameters being estimated, making the estimation of the individual parametersand interpretation of our model results more challenging.13
Predict or describe? How learning analytics dashboard design 1415Model for learning performance. To evaluate if learning performance was influencedby the treatment, we relied on a Tobit regression model. We relied on this model because astudent obtaining the maximum score of 100 only tells us that the true score/performanceof the student was at least 100 but could have been higher if the measurement instrumentwas not limited to a 0–100 scale. By acknowledging that both total quiz and final examscores are bounded between 0 and 100, this model avoids the bias in parameter estimatesthat can be is introduced due to ceiling effects when using a regular ANOVA/regressionmodel (Wang et al., 2008).Let yi and zi be the observed score and the partially latent score, respectively, of learneri. The Tobit regression model assumes that yi zi if 0 yi 100. However, this modelassumes that zi 100 (i.e., true performance is higher than 100) if yi 100 and that zi 0(i.e., true performance is lower than 0) if yi 0, essentially treating the observed scoresas c
Predict or describe o learning analytics dashboard design 1409 Conceptual framework To investigate the potential of dashboard applications as technology-enhanced pedagog-ical tools to support learners' cognitive and aective outcomes (Zimmerman, 2008), we adopted a conceptual framework that highlights a multiple goal orientation perspective,