Transcription
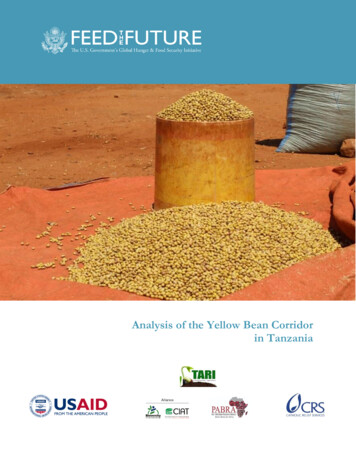
Analysis of the Yellow Bean Corridorin Tanzania
Activity Title:Feed the Future Global Supporting Seed Systems for DevelopmentactivityActivity start date and end date:Aug 24, 2018 – Aug 23, 2023Cooperative agreement number:7200AA18LE00004Document title:Analysis of the Yellow Bean Corridor in TanzaniaPublication date:September 1, 20211Citation:Birachi, E. A, et al. 2020. Analysis of the Yellow Bean Corridor inTanzania. A Feed the Future Global Supporting Seed Systems forDevelopment activity (S34D) report.Authors:Birachi, E. A, Sperling, L., Kadege, E., Mdachi, M., Upendo, T.,Radegunda, K., Mutua, M., Mbiu, J., Raya, N., Ndunguru, A., William,M., Kabungo, C., Mcharo, D., Shida, N., Kilango, M., Magelanga, A.,Maganga, R., Kalemera, S., Katungi, E., Mukankusi, C., Malle, S. Dey,B., Templer, N., Rubyogo, J. C., Onyango, P., and Buruchara, R.Sponsoring USAID office:LOC Unit, Federal Center Plaza (SA-44)/M/CFO/CMPTechnical office:USAID/RFS/CAAOR name:Daniel BaileyActivity Goal:Improved functioning of the high-impact integrated seed systemsLanguage of document:EnglishSubmitted on behalf of:Catholic Relief ServicesSubmitted by:Nikaj van Wees, Chief of Party S34D activityCatholic Relief Services228 West Lexington Street, Baltimore, MD 21201Nikaj.vanwees@crs.org2
Acknowledgements: The Analysis of the Yellow Bean Corridor in Tanzania is a component of the Feed theFuture Global Supporting Seed Systems for Development (S34D) Activity implemented by the Catholic ReliefServices (CRS) and its consortium of partners. The study was designed, planned, implemented and reported by ateam of researchers at Tanzania Agricultural Research Institute (TARI), the Alliance of Bioversity Internationaland CIAT (Alliance) – Pan Africa Bean Research Alliance (PABRA) and CRS. We gratefully acknowledge thecontribution of the Government of Tanzania through TARI, particularly its National Bean Research Programmeat Maruku, Selian and Uyole research centers. We express great gratitude to our donors, especially USAID, forsupporting the study operations through the S34D activity and other PABRA donors namely the Swiss Agencyfor Development and Cooperation (SDC), Global Affairs Canada (GAC) and Bill and Melinda Gates Foundationwho greatly contributed to the Alliance-PABRA and TARI partnership.Special thanks to TARI and Alliance managements who supported and facilitated the study. Finally, yetimportantly, we are grateful to bean traders for their participation and immense support that made the study asuccess.Cover page photo credit: Noel Templer, Alliance-PABRADISCLAIMERThis report was made possible by the generous support from the American people through the U.S. Government'sFeed the Future Initiative and the United States Agency for International Development through CooperativeAgreement 7200AA18LE00004. The contents are the responsibility of Catholic Relief Services and do notnecessarily reflect the views of USAID or the United States Government.Feed the Future Consortium Partners in the Feed the Future Global Supporting Seed Systems forDevelopment activity:3
Table of ContentsList of Acronyms .6List of Tables .7List of Figures.8EXECUTIVE SUMMARY .91.2.3.INTRODUCTION. 111.1.Importance of Common beans in Tanzania . 111.2.The Bean Corridors . 11STUDY METHODOLOGY . 122.1.Yellow Bean Corridor Study Design . 122.2.Yellow Bean Varieties Surveyed . 132.3.Locations of the Corridor Hubs . 142.4.Types of Bean Trading Businesses . 15YELLOW BEAN GRAIN FINDINGS . 163.1.Yellow bean trade volume. 163.2.Main Buyers . 163.3.Yellow Bean Prices . 173.4.Yellow Bean Sales . 183.4.1.Regional Export Markets for Yellow Beans. 203.4.2.Peak Sale Months. 213.4.3.Grain Quality: Issues and Preferences . 213.4.4.Consumer’s preferred traits . 223.4.5.Gender Preferences . 223.5.3.5.1.Production Locations/Hubs . 233.5.2.Sale/Destination Locations (Distribution and Consumption Hubs) . 243.6.4.5.Yellow Bean Flows in the Tanzania Corridors . 23Challenges and Opportunities in Yellow Bean Trade . 25YELLOW BEAN ‘POTENTIAL SEED’ ANALYSIS. 274.1.Sampling Potential Seed Traders. 274.2.Major Findings . 284.3.Possible areas for Immediate Research and Development Actions . 37DNA ANALYSIS OF TRADERS’ YELLOW BEAN SAMPLES . 385.1.Introduction . 385.2.Materials and Methods. 384
5.3.Data Analysis . 405.4.Results and Discussions . 405.5.Conclusion . 436.RECOMMENDATIONS . 447.REFERENCES . 475
List of oAMTNARSOFDAPABRAPCAPCoAQCQDSSDCSNPS34DTARIThe AllianceTOSCITZSAgriculture Sector Development Plan of TanzaniaAccelerated Varietal Improvement and Seed Delivery of Legumes and Cereals in AfricaBureau for Humanitarian AssistanceBill and Melinda Gates FoundationBureau of Resilience and Food SecurityCatholic Relief ServicesDiscriminatory Analysis of Principal ComponentsDeoxyribonucleic acidGlobal Affairs CanadaImproving Bean Production & Marketing in AfricaMinimum Allele FrequencyMinistry of AgricultureMetric TonneNational Agricultural Research SystemsOffice of Foreign Disaster AssistancePan-Africa Bean Research AlliancePrincipal Component AnalysisPrincipal Coordinates AnalysisQuality ControlQuality Declared SeedSwiss Agency for Development and CooperationSingle Nucleotide PolymorphismSupporting Seed Systems for DevelopmentTanzania Agricultural Research InstituteThe Alliance of Bioversity International and CIATTanzania Official Seed Certification InstituteTanzanian Shilling6
List of TablesTable 1: Distribution of sampled yellow bean traders by age and sex. . 13Table 2: Distribution among yellow bean varieties based on DNA identification . 14Table 3: Distribution of yellow bean traders and transactions in the hubs (by region) . 15Table 4: Type of bean trade businesses . 15Table 5: Estimated volumes (MT) of yellow bean sold between July 2018 - July 2019 for major yellow bean varieties. 16Table 6: Average bean prices by different buyer types and by variety in TZS/kg (1USD TZS 2295.7) . 17Table 7: Yellow bean sale price (TZS/kg) per variety by sex of trader. 17Table 8: The price (TZS/kg) of common bean varieties across the regional hubs. 18Table 9: Mean and median value of beans traded (USD) per variety per trader, July 2018 – July 2019. 18Table 10: Value of bean sales for the period July 2018- July 2019, USD per trader, by sex of trader. . 19Table 11: Proportion of the yellow beans exported outside Tanzania. 20Table 12: Volume and value of yellow beans exported (Mean MT, USD per variety observation). . 20Table 13: Volume (MT) of yellow beans exported per variety. . 21Table 14: Yellow bean consumer trait preferences. . 22Table 15: Gender preference for yellow bean varieties as indicated by traders. . 23Table 16: Grain sources by location of trader. . 23Table 17: Yellow grain sale/destination locations by location of trader. . 25Table 18: Challenges and opportunities by sex. . 26Table 19: Age of potential seed large traders (percentage) (N 23). . 27Table 20: Age of potential seed retailers (percentage) (N 41). . 27Table 21: Distribution of yellow bean large potential seed traders and transactions by zone. . 27Table 22: Distribution of yellow bean potential seed retailers and transactions by zone. . 28Table 23: Potential seed traders’ sale of modern varieties. 30Table 24: Large potential seed trader — seed and grain business proportions (percentage volumes). . 30Table 25: Potential seed retailer —— seed and grain business proportions (percentage volumes). . 30Table 26: Potential seed traders’ sources of grain and seed. . 32Table 27: Large potential seed traders (N 23) management practices – relating to potential seed. 34Table 28: Potential seed retailers (N 41) management practices — relating to potential seed. 35Table 29: Yellow bean seed purchase patterns by farmers at retailer outlets (N 41) . 36Table 30: Yellow bean reference lines used in study. . 39Table 31: Proportion of yellow bean trader samples according to the reference varieties . 427
List of FiguresFigure 1: Yellow bean Survey locations in Tanzania . 13Figure 2: Snapshot of different variants of yellow bean . 14Figure 3: Proportion of sales volumes to various buyer types . 16Figure 4: Traded volumes across the hubs. . 19Figure 5: Peak selling months for yellow bean grain. 21Figure 6: Proportion of observations of yellow bean varieties sold as pure (non-mixed) or mixed with othervarieties . 22Figure 7: Bean market indicating bean prices of various varieties, Tandika Market, Dar es Salaam. 24Figure 8: Tanzania yellow bean corridor: linking production to consumption hubs for yellow beans. 25Figure 9: Overview of trader (all sample types) seed and grain flows. . 33Figure 10: Zones of sourcing and selling of potential seed (larger and retailer potential seed traders combined). 34Figure 11: Similarity matrix derived heatmap of fifteen yellow bean reference lines . 418
EXECUTIVE SUMMARYCommon bean (Phaseolus vulgaris) plays a key role in the livelihoods of smallholder farmers in Tanzania as a foodand nutrition security crop and a source of income for producers. It is the leading leguminous crop, accountingfor 78% of cultivated legumes, while over 75% of rural households in Tanzania depend on beans for dailysubsistence. Per capita bean consumption is estimated at 19.3 kg per person per year. With its estimated 1.2 millionMT produced per year (2018), Tanzania is the top bean producer in Africa and seventh globally. More than aquarter of Tanzania’s beans are exported to neighboring countries and beyond.One of the most traded bean types is the yellow and its variants. However, there is limited information on itsproduction and trade with potential implications on seed systems and other possible investments. Using the beancorridor framework of the Pan-Africa Bean Research Alliance (PABRA), the Alliance of Bioversity Internationaland International Centre for Tropical Agriculture (the Alliance) in collaboration with Tanzania AgriculturalResearch Institute (TARI) and Catholic Relief Services (CRS), conducted a survey of the yellow bean value chainin Tanzania from July-August 2019 under the Feed the Future Global Supporting Seed Systems Developmentactivity (S34D). CRS leads a consortium implementing S34D, a five-year Leader with Associates (LWA)Cooperative Agreement award, funded by the Feed the Future Initiative through the Bureau of Resilience andFood Security (RFS) and by USAID through the Bureau for Humanitarian Assistance (BHA).The objective of the survey was to characterize and explore trade of yellow bean grain and potential seed. Thesurvey collected data and grain samples from 298 grain traders (including wholesalers, exporters, aggregators, andretailers) and 64 potential seed traders (large and retail traders) from 12 regions across four administrative zonesin Tanzania (Figure 1). The grain samples collected were for DNA analyses. Results show existence of anestablished yellow bean corridor across Tanzania and the region at large (Burundi, DRC, Kenya, Rwanda, Uganda,Zambia) and demonstrated a huge market pull in the Eastern and Southern Africa regions. There are also strongperceptions on the organoleptic quality of various yellow bean grains and varieties that are traced to their sources.Yellow bean varieties are diverse and vary across the production hubs in the country, and this diversity is highestin the West (Kigoma) of the country. Moreover, the differentiated prices of these various grain qualities linked tovarieties and sources further reflected differentiated products and responsive market demand. The Dar es Salaamand other markets preferred a yellow bean variety that is relatively large and round (referred to as ‘Gololi,’ meaninground in shape). This is one of the released varieties that is known as Selian 13. Yellow beans from the NorthernZone and Tanga region are considered superior quality while those from Kagera are considered as low qualitybeans by market standards in Dar es Salaam. For that reason, no trader preferred selling mixed beans; rather, singlevarieties were mostly preferred as they fetched higher prices.Sustaining supply of high-quality planting material is critical for the success of the yellow bean corridor. The seedsupply system for the yellow bean corridor is largely informal, managed by grain traders, and is quite vibrant. Thesetraders also double as seed suppliers and use numerous seed management techniques to improve the seed supplyin the corridor.DNA analysis/fingerprinting of the sub-sample of the traded yellow bean varieties show that traders were engagedin various yellow bean varieties that include landraces and improved varieties. A key result from the DNA analysisshows that about 50% of the traded varieties had been officially released in Tanzania (Selian 13, Uyole 16, and Uyole98). The rest were either derived from neighboring countries or could not be clustered. In addition, the mosttraded varieties were also of the released types. Despite the diversity in yellow beans, there are clear preferencesfor particular varieties by traders and consumers.According to traders, the peak selling periods (September to December) coincide with planting periods for beanswhen prices are also highest. The increased demand stems from use of the grains as planting materials. More than50% of the traders reported being actively involved in selling grain used by farmers for planting. Women dominatethe retail trade in the yellow bean, while men dominate export and aggregation businesses. Women sold closer tohome within the district and mainly sourced grain close to their localities, while men tended to source and sell indistant regions or regional markets.9
Additionally, discoloration of some of the beans when stored for longer periods posed a significant challenge totraders because beans which retained original color were preferred. Other key constraints are related to marketorganization and trade levies when moving grain internally from one district to another. Traceability in the yellowbean corridor is necessary, especially for potential seed supply but also for closer linkages between aggregators andgrain producers — most — m traders expressed interest for support in this area as part of yellow bean corridorstrengthening in Tanzania. Digital payment solutions via the system of aggregators is one such possibility tosupport the development of the value chains. Discussions have been initiated with some of the aggregators inKagera and Kigoma regions to support the closer linkages. Even though the market pull for yellow varieties isstrong, traders indicated inadequate supply to meet their demands.Released varieties need to be disseminated through an efficient public-private partnerships based on the beanbusiness platforms which bring together actors in value chain to reflect on and address constraints affecting thevalue chain. In addition, enablers of the policy environment, management and business training and support totraders, and enhancing the quality of the seeds in the current informal seed system in the wider yellow bean corridorare also areas that can substantially improve yellow bean supply in Tanzania.10
1. INTRODUCTION1.1. Importance of Common beans in TanzaniaThe common bean (Phaseolus vulgaris L.) is an important legume produced and consumed worldwide for its ediblegrains and pods. Bean is a staple food in in Tanzania whose per capita consumption is about 19.3kg per personper year. Tanzania ranks 1st and 7th in Africa and globally, in common bean production respectively,.1 Commonbeans provide dietary protein for over 200 million people in Africa, especially women and children living in ruralareas and poorer urban communities. Beans and bean-based products are vital to livelihoods, delivering a range ofbenefits. These include inclusive economic growth through equitable wealth creation, women’s empowerment,employment along the value chain (especially for youth), nutritional2 benefits (especially for women ofreproductive age and children) and health benefits. Further, beans contribute to sustainable agricultural systems,industrialization (i.e., to develop value added products like canning) and balance of payment through exportearnings (i.e., expanding products for export markets). Common beans from Tanzania are for both domesticconsumption and export to several neighbouring countries and beyond, particularly Burundi, DRC, Kenya, MalawiRwanda, South Africa, Uganda and Zambia. Within Tanzania, 1.2 million hectares of beans are cultivated annually.The production is mainly by small-scale farmers of less than 2 hectares. Beans account for about 80% of totalpulses produced in Tanzania. The production zones include Southern Highland Zone (Iringa, Mbeya, Rukwa, andRuvuma regions), Western Zone (Kigoma region), Lake Zone (Kagera region) and Northern Zone (Arusha,Kilimanjaro, Manyara and Tanga regions).1.2. The Bean CorridorsPABRA developed the commodity corridors3 concept to intensify bean production, distribution and marketingand consumption activities (PABRA 2017). The corridor model aims to unclog production bottlenecks includingaccess to quality seed of consumer demanded varieties and ultimately to satisfy the consumer demand. This modeldefines three hubs4 in the bean value chain—production, distribution and consumption.PABRA has defined nine bean corridors across Africa, based on major driving bean types. One of the bean typesis the yellow bean that drives the yellow bean corridor, which is the focus of this study. Other bean corridors areillustrated in PABRA, 2017. The current study focuses on the trade flows of yellow bean varieties in Eastern Africa,with empirical evidence from Tanzania in order to identify opportunities to improve the ‘yellow bean flow’ andthe corresponding influence on the seed sector.Although largely grown for subsistence, approximately 40% of production is marketed. Common beans contribute about 62% of allTanzanian legume exports (the most exported Tanzania legume).2 Mineral elements are critical to the women and children in this category (e.g. iron and zinc).3 The corridors are based on PABRA’s assessment of the bean trade in Africa, which has revealed major flows of the crop between areasof production and consumption, connected by distribution networks.4 Production hubs comprise the major bean production areas within the corridor, characterized by marketable volumes of produce.Consumption hubs comprise major market outlets and or processing units. They include open markets, supermarkets, bean processorsthat source from the relevant production hubs all linked to large pools of consumers in and out of a country. Distribution hubs connectproduction and consumption hubs. They comprise of product distribution centers, aggregation centers, warehouses and storage points,commodity exchanges and transportation.111
2. STUDY METHODOLOGYThe purpose of the study is to use survey data from Tanzania to:a. Characterize the yellow bean corridor;b. Understand the distinct markets and flows of yellow bean grain and seed;c. Show position of released varieties in the market;d. Assess demand for yellow beans, and;e. Guide public and private investments in the yellow and other bean corridors.The study provides data and evidence on movements and flows of yellow bean grain and its connection with flowof ‘potential seed’ in Tanzania and the region at large. The study findings increase the understanding of theinterface between bean grain trade and dissemination of potential seed. The study also sheds light on how toenhance quality in the informal seed sector as well as variety access in remote areas. Overall, the study establishesthe contribution of informal seed systems to the yellow bean corridor in the country.2.1.Yellow Bean Corridor Study DesignUnder the PABRA framework, the Alliance in partnership with the Tanzania Agricultural Research Institute(TARI) conducted the yellow bean study which was supported by various PABRA projects mainly the Feed theFuture S34D activity. Other contributing PABRA projects included Swiss Agency for Development andCooperation (SDC) supported project, Improving Bean Production and Marketing in Africa (IBPMA) supportedby the Global Affairs Canada (GAC), and Accelerated Varietal Improvement and Seed Delivery of Legumes andCereals in Africa (AVISA) supported by the Bill and Melinda Gates Foundation (BMGF).The major production hubs surveyed were Northern Zone (Arusha, Kilimanjaro and Manyara), Lake Zone(Kagera), Western Zone (Kigoma), and the Southern Highlands (Iringa, Mbeya, Njombe, Sumbawanga andSongwe). The major markets or consumption hubs evaluated included Arusha, Dar es Salaam and Shinyanga. Thedistribution hubs were mainly Kagera (Uganda border), Arusha/Kilimanjaro regions to Kenya and Tunduma enroute to DRC and Zambia. In the Northern zone, the hubs combine production, distribution and consumption.Traders involved in both grain and potential seed (collectors, wholesalers and retailers) were interviewed in thesurvey conducted between July and August 2019. Identification of traders was by a listing of the traders in thedistricts of the target regions. The lists were acquired from market authorities in the survey locations (Figure 1).The report thus draws insights from a data set of 298 traders distributed according to age and sex. Women tradersrepresented 41% of the sample, and about two-thirds of the traders were less than 45 years old (Table 1).12
Figure 1: Yellow bean Survey locations in TanzaniaTable 1: Distribution of sampled yellow bean traders by age and sex.AgeMale %(n 175)13.14Total %(n 298)11.74Cumulative %15 to 29Female %(n 123)9.7630 to 4545.5350.8648.6660.446 to 6542.2834.8637.9298.32 662.441.141.68100Overall41591002.2.11.74Yellow Bean Varieties SurveyedThe number of yellow bean variety observations5 from the 298 traders were 444 (Table 2). 349 of 444 sampleswere collected for DNA analysis. The release status is also shown. The number of yellow bean varieties traded pertrader ranged from one to four.Selian 13 was the most traded yellow bean variety and comprised of 35% of varietal observations. Uyole 16 (11%)followed this among released varieties. Other varieties that had at least 10% of the trade include Njano Gololi (10%).The rest were not clustered, or their release status was unknown.5Each observation represents a separate variety, and thus a single trader could have multiple observations.13
Table 2: Distribution among yellow bean varieties based on DNA iden
MT produced per year (2018), Tanzania is the top bean producer in Africa and seventh globally. More than a quarter of Tanzania's beans are exported to neighboring countries and beyond. One of the most traded bean types is the yellow and its variants. However, there is limited information on its