Transcription
Stats 170A: Project in Data SciencePredictive Modeling: ClassificationPadhraic SmythDepartment of Computer ScienceBren School of Information and Computer SciencesUniversity of California, Irvine
Reading, Homework, Lectures Reference reading:Chapters 1 to 4 in Geron’s text, Hands-On Machine Learning with ScikitLearn and TensorFlow– See chapter 3 for today’s lecture on classification Homework 6– Based on Chapter 2 in Geron– Due by 2pm Wednesday next week (Monday is a holiday) Next Lectures– Today: prediction with classification– Wednesday next week: text analysis and classification– 1 more homework (#7) and then project modePadhraic Smyth, UC Irvine: Stats 170AB, Winter 2018: 2
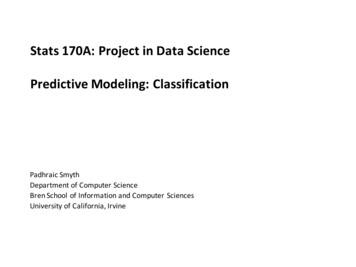
Jupyter Notebook for Chapter 3 on ClassificationOnline at 3 classification.ipynbPadhraic Smyth, UC Irvine: Stats 170AB, Winter 2018: 3
Predictive Modeling Two basic types of predictive models– Regression: predict a real-valued variable Y given input vector X E.g., predict what a customer will spend with a merchant in the next 12 months– Classification: predict a categorical variable Y give input vector X E.g., predict if a credit card transaction is fraudulent or not Both problems can be addressed by statistical models or machine learningalgorithms Both problems share common mathematical/statistical foundationsPadhraic Smyth, UC Irvine: Stats 170AB, Winter 2018: 4
Learning a Classification ModelTrainingDataPatient IDZipcodeAge182619269742356 .Test 43510350Learning algorithm learns a function that takes valueson the left to predict the value (diagnosis) on the rightPadhraic Smyth, UC Irvine: Stats 170AB, Winter 2018: 5
Making Predictions with a Classification ModelTrainingDataTestDataPatient IDZipcodeAge182619269742356 .Test 4351035012837926974070?72623926973244?We can then use the model to make predictionswhen target values are unknownPadhraic Smyth, UC Irvine: Stats 170AB, Winter 2018: 6
Examples of Classification Problems7ProblemFeatures xClass yUsed by?Useful tohavep(y x)?Spam emailPresence/absenceof words in emailSpam or notGoogle, Yahoo,Microsoft, entity ofwordIBM, Microsoft,Google, etcyesLoanApprovalIndividuals’income, job, age,etcWill default ornotBanks, financialcompaniesyesCancerscreeningImage features atcell levelCancerous ornot?MedicalcompaniesyesPersonalizedgenomicsGene expressiondataCancer or notBioinformaticsstartupsyesPadhraic Smyth, UC Irvine: Stats 170AB, Winter 2018: 7
Examples of Classifiers8– Nearest-neighbor: simple baseline– Logistic regression: simple but useful, widely used in business– Neural network: non-linear extension of logistic regression– Support vector machines: complex, not used much in business– Decision trees: useful general purpose method– Many more .Padhraic Smyth, UC Irvine: Stats 170AB, Winter 2018: 8
Each dot is a 2-dimensional pointrepresenting one person [ AGE, MONTHLY INCOME]1400012000MONTHLY Padhraic Smyth, UC Irvine: Stats 170AB, Winter 2018: 9
Blue dots good loansRed dots bad loans14000Goodboundary?12000MONTHLY 405060708090AGEPadhraic Smyth, UC Irvine: Stats 170AB, Winter 2018: 10
1400012000MONTHLY INCOME100008000A much more complexboundary – but perhapsoverfitting to noise?60004000200000102030405060708090AGEPadhraic Smyth, UC Irvine: Stats 170AB, Winter 2018: 11
Classification with the Logistic ModelPadhraic Smyth, UC Irvine: Stats 170AB, Winter 2018: 12
Getting Class Probabilities .Estimates of class probabilities P(c x ) are very useful in practicee.g., for ranking documents to show to a human userPadhraic Smyth, UC Irvine: Stats 170AB, Winter 2018: 13
Getting Class Probabilities .Estimates of class probabilities P(c x ) are very useful in practicee.g., for ranking documents to show to a human userAssume for simplicity we have a 2-class binary classification problemSay we tried to get a probability of a class with a linear model:P(c x ) f( x ) w 0 w1 x1 w 2 x2 . w T xTThere is a problem:f( x ) could be negative, could be 1, etc.Padhraic Smyth, UC Irvine: Stats 170AB, Winter 2018: 14
A Better ApproachP(c x ) f( x ) g (w 0 w1 x1 w 2 x2 . w T xT )where g(z) 1 / [ 1 e-z ]As z - positive infinity, g(z) - 1, P(class) - 1As z - negative infinity, g(z) - 0, P(class) - 0This is the logistic regression modelIn effect: a linear (weighted sum) model where the sum is transformed to liebetween 0 and 1 and we can interpret f( x ) directly as a probability between 0 and 1Padhraic Smyth, UC Irvine: Stats 170AB, Winter 2018: 15
What does the Logistic Function look like?Shape of the Logistic Functiong(z) 110.80.60.40.2g(z) 00-100-50050100z weighted sum Σj wj xjAs z - positive infinity, g(z) - 1, P(class) - 1As z - negative infinity, g(z) - 0, P(class) - 0Padhraic Smyth, UC Irvine: Stats 170AB, Winter 2018: 16
Comparing Linear and Logistic ModelsFrom http://scikit-learn.org/stable/auto examples/linear model/plot plot-logistic-pyPadhraic Smyth, UC Irvine: Stats 170AB, Winter 2018: 17
Notation for Classification LearningThe ith feature vectorThe class label for the ith example.ci takes value 0 or 1 for binary classificationPadhraic Smyth, UC Irvine: Stats 170AB, Winter 2018: 18
Notation for Classification LearningThe ith feature vectorThe classification model’s predictionfor the ith feature vectorThe class label for the ith example.ci takes value 0 or 1 for binary classificationSome fixed value of the weight vector wPadhraic Smyth, UC Irvine: Stats 170AB, Winter 2018: 19
Learning: Minimizing a Loss FunctionTrueValuePredictionPadhraic Smyth, UC Irvine: Stats 170AB, Winter 2018: 20
Learning: Minimizing a Loss FunctionTrueValueNote that we view the lossfunction L(w) as a function ofthe unknown weights wPredictionGoal of learning is to minimize this sum over allN training examples, i.e., learn the weights wthat make the f’s as close to the c’s as possible.We typically use optimization or searchalgorithms to find the w vector that minimizesL(w)Padhraic Smyth, UC Irvine: Stats 170AB, Winter 2018: 21
The Squared Error Loss FunctionTrueValuePredictionBest suited for problems when f can lie anywhere on the real linePadhraic Smyth, UC Irvine: Stats 170AB, Winter 2018: 22
The Log Loss FunctionUsed when f represents a probability P(c x) and is between 0 and 1(Often used to train logistic regression and neural network classifiers)Examples withclass label 1Examples withclass label 0Padhraic Smyth, UC Irvine: Stats 170AB, Winter 2018: 23
The Log Loss FunctionUsed when f represents a probability P(c x) and is between 0 and 1(Often used to train logistic regression and neural network classifiers)Examples withclass label 1Drive f - 1 onthese examples,and log 1/f - 0Examples withclass label 0Drive f - 0 onthese examples,and 1/(1 - f) - 0Padhraic Smyth, UC Irvine: Stats 170AB, Winter 2018: 24
Weight RegularizationWith so many weights it is easy to overfit - regularization is often usefulLog-loss (as defined earlier)Additional term to penalize large weights .encourages weights to stay at 0 unless data suggests otherwiseλ typically determined via cross-validation(Can also use absolute value of w ‘s , called Lasso regularization)Padhraic Smyth, UC Irvine: Stats 170AB, Winter 2018: 25
Gradient Descent AlgorithmSimple algorithm that uses the gradient to search for the minimum of L (w) Start at some random w location Compute the gradient Δ(w) Move in the direction -Δ(w)(typically take small steps) Recompute the gradient, iterate . Repeat until there is no improvementTheoretical properties?If step sizes are small enough,guaranteed to find a (local) minimumSimple example of gradient descentfor p 2 dimensionsPadhraic Smyth, UC Irvine: Stats 170AB, Winter 2018: 26
Optimizing L(w) with a single weight wL(w)wEasy to find the minimum(convex problem with asingle global minimum)Padhraic Smyth, UC Irvine: Stats 170AB, Winter 2018: 27
Optimizing L(w) with a single weight wL(w)wEasy to find the minimum(convex problem with asingle global minimum)Example: logistic modelL(w)wHarder to find the minimum(non-convex problem withlocal minima)Example: neural networkPadhraic Smyth, UC Irvine: Stats 170AB, Winter 2018: 28
Training a Logistic Model with Gradient Descent The logistic model combined with the log-loss function is a convex problem– So it can be solved relatively easily with gradient descent Parameters of the optimization algorithm:– Step size or “learning rate”: how far to step in weight space at each iteration Theory recommends that the step size should decrease as iterations increase Note that if the learning rate is too large, the optimization may diverge– Convergence criterion Change in log-loss function or magnitude of gradient vector is less than some epsilonPadhraic Smyth, UC Irvine: Stats 170AB, Winter 2018: 29
Stochastic Gradient Descent(Example in 2-dimensional Parameter Space)Stochastic gradient stepsGradient stepsEmpirically works very well on large data sets: some theoretical support(See Adam algorithm, by Kingma and Ba, ICLR, 2015)Padhraic Smyth, UC Irvine: Stats 170AB, Winter 2018: 30
Example of Stochastic Gradient OptimizationBinary Text Classification Problemd 47k word featuresN 781k documentsVarious forms of linear classifiersFrom Leon Bottou, Stochastic Gradient Learning, MLSS Summer School 2011, Purdue University,http://learning.stat.purdue.edu/mlss/ media/mlss/bottou.pdfPadhraic Smyth, UC Irvine: Stats 170AB, Winter 2018: 31
Summary: Training a Logistic Regression Model The model: The loss function: Training algorithms:– Gradient descent: fast and reliable, need to choose learning rate– Stochastic gradient descent: Often used in practice for problems with many documents and many featuresPadhraic Smyth, UC Irvine: Stats 170AB, Winter 2018: 32
Logistic Classifiers: the “Workhorse” of Machine LearningThe logistic model is very widely used in machine learning§ Document classification such as spam email§ Predicting what advertisements to show Web users§ Automatic ranking of search engine results§ Credit scoring§ Fraud detection§ And many more .§ Google, Yahoo!, Microsoft, eBay, Amazon, Yelp, Linkedin, Facebook, Experian, etcWhy so popular?– Often does very well on high-dimensional problems– Time and space complexity is linear in d and N (with gradient methods)– Convex optimization (no local minima problems)– Relatively interpretable– Probabilistic outputs useful for many tasks, e.g., rankingPadhraic Smyth, UC Irvine: Stats 170AB, Winter 2018: 33
More Complex Classification Models:Neural Networks and Decision TreesPadhraic Smyth, UC Irvine: Stats 170AB, Winter 2018: 34
Example: A Logistic Model as a Simple Neural Networkx1x2f(x)x3 1The machine learning algorithm will learn a weightfor each arrow in the diagramThis a simple model: one weight per inputPadhraic Smyth, UC Irvine: Stats 170AB, Winter 2018: 35
A Simple Neural NetworkHere the model learns 3 different functions and then combines the outputs ofthe 3 to make a predictionx1x2f(x)x3Output 1InputsHiddenLayerThis is more complex and has more parameters than the simple modelPadhraic Smyth, UC Irvine: Stats 170AB, Winter 2018: 36
A Simple Neural NetworkHere the model learns 3 different functions and then combines the outputs ofthe 3 to make a predictionx1x2f(x)x3Output 1InputsHiddenLayerThis is more complex and has more parameters than the simple modelPadhraic Smyth, UC Irvine: Stats 170AB, Winter 2018: 37
A Simple Neural NetworkHere the model learns 3 different functions and then combines the outputs ofthe 3 to make a predictionx1x2f(x)x3Output 1InputsHiddenLayerThis is more complex and has more parameters than the simple modelPadhraic Smyth, UC Irvine: Stats 170AB, Winter 2018: 38
Deep Learning: Models with More Hidden LayersWe can build on this idea to create “deep models” with many hidden layersx1x2f(x)x3Output 1InputsHiddenLayer 1HiddenLayer 2Very flexible and complex functionsPadhraic Smyth, UC Irvine: Stats 170AB, Winter 2018: 39
Figure from Lee et al., ICML 2009Padhraic Smyth, UC Irvine: Stats 170AB, Winter 2018: 40
Example of a Network for Image RecognitionMathematically this is just a function (a complicated one)Figure from http://parse.ele.tue.nl/Padhraic Smyth, UC Irvine: Stats 170AB, Winter 2018: 41
Russakovsky et al, ImageNet Large ScaleVisual Recognition Challenge, 2015Padhraic Smyth, UC Irvine: Stats 170AB, Winter 2018: 42
Training Neural Networks Learning algorithm: stochastic gradient descent on the loss function Many “hyperparameters” to select––––Number of layersSize of each hidden layerType of non-linearity and more Strengths– More powerful than simpler models like logistic regression– Works very well on “low-level” features like pixels Weaknesses– May need very large labeled data sets (millions)– Search over hyperparameters may be expensive (human and computer time)– Models are not easy to interpretPadhraic Smyth, UC Irvine: Stats 170AB, Winter 2018: 43
Example: Decision Trees and CellPhone “Churn” PredictionHistorical data set of 20,000 customers.The target variable is whether the customer stayed with the company or left (“churned”)Example and figures from Provost and Fawcett, Data Science for Business, 2013Padhraic Smyth, UC Irvine: Stats 170AB, Winter 2018: 44
Example: Cellular Phone Churn-Prediction ProblemClassification tree learned fromthe training data set of 20k examples73% accuracy on the training setExample and figures from Provost and Fawcett, Data Science for Business, 2013Padhraic Smyth, UC Irvine: Stats 170AB, Winter 2018: 45
Example: Cellular Phone Churn-Prediction ProblemClassification tree learned fromthe training data set of 20k examples73% accuracy on the training setQuestions:1. How likely are we to get 73% accuracyon another (new) set of customers?2. Is 73% as good as we can do?Example and figures from Provost and Fawcett, Data Science for Business, 2013Padhraic Smyth, UC Irvine: Stats 170AB, Winter 2018: 46
DataProbability Contours/Decision Boundaries of Different igure from scikit-learn tutorial materialPadhraic Smyth, UC Irvine: Stats 170AB, Winter 2018: 47
Padhraic Smyth, UC Irvine: Stats 170AB, Winter 2018: 48
From: https://keras.io/Padhraic Smyth, UC Irvine: Stats 170AB, Winter 2018: 49
Picking the Best Model from a Set of ModelsPadhraic Smyth, UC Irvine: Stats 170AB, Winter 2018: 50
Complexity versus Goodness of FityTraining dataxPadhraic Smyth, UC Irvine: Stats 170AB, Winter 2018: 51
Complexity versus Goodness of FityTraining dataxyHere the red circles representtraining data and the blue curvesare models fitted to the dataToo simple?xPadhraic Smyth, UC Irvine: Stats 170AB, Winter 2018: 52
Complexity versus Goodness of FityTraining dataxyyHere the red circles representtraining data and the blue curvesare models fitted to the dataToo simple?xToo complex ?xPadhraic Smyth, UC Irvine: Stats 170AB, Winter 2018: 53
Complexity versus Goodness of FityTraining datayxyToo complex ?xHere the red circles representtraining data and the blue curvesare models fitted to the dataToo simple?xyAbout right ?xPadhraic Smyth, UC Irvine: Stats 170AB, Winter 2018: 54
Example from Geron Text, Chapter 4Different Polynomial ModelsPadhraic Smyth, UC Irvine: Stats 170AB, Winter 2018: 55
Complexity and GeneralizationLoss Functione.g., meansquared errorEtest(θ)Etrain(θ)Model Complexity(e.g., number of parameters)Optimal modelcomplexityPadhraic Smyth, UC Irvine: Stats 170AB, Winter 2018: 56
Complexity and GeneralizationLoss Functione.g., meansquared errorEtest(θ)Amount l ComplexityPadhraic Smyth, UC Irvine: Stats 170AB, Winter 2018: 57
Complexity and GeneralizationLoss Functione.g., meansquared errorEtest(θ)Etrain(θ)High biasLow varianceOptimal modelcomplexityLow biasHigh variancePadhraic Smyth, UC Irvine: Stats 170AB, Winter 2018: 58
Training and Test Data Classification accuracy on our training data will tend to be optimistic– Classifier can “memorize” the training data Test set performance– A more accurate estimate of accuracy can be gotten by reserving some ofour data as an independent/unseen/holdout test data set– Train the model on the training data– Evaluate the model’s true accuracy on the data it did not see (the test set) Cross-validation– We can repeat the process of splitting our data into train-test sets multipletimes to get an even more robust estimate of accuracy– V-fold cross-validation V train-test splits of the data, train V models and evaluate on V test sets Our final accuracy estimate is the average over the V test “folds”Padhraic Smyth, UC Irvine: Stats 170AB, Winter 2018: 59
Example of 5-foldCross-ValidationRepeatedly partition datarandomly into disjoint trainingand validation setsMore robust than using a singlepartition of the dataTrainingData 1ValidationData 1TrainingData 2ValidationData 2TrainingData 3ValidationData 3TrainingData 4ValidationData 4TrainingData 5ValidationData 5Evaluate the performance ofeach model by taking theaverage performance acrossthe validation setsPadhraic Smyth, UC Irvine: Stats 170AB, Winter 2018: 60
Example: Cellular Phone Churn-Prediction ProblemClassification tree learned fromthe training data set of 20k examples73% accuracy on the training setQuestion:How likely are we to get 73% accuracyon another (new) set of customers?Example and figures from Provost and Fawcett, Data Science for Business, 2013Padhraic Smyth, UC Irvine: Stats 170AB, Winter 2018: 61
Example: Cellular Phone ChurnPrediction Problem10-fold cross-validationaccuracies for logistic regression(top) and decision trees (bottom)Solid lines indicate the meanaccuracy for each modelNote that the mean accuracy fortrees is lower than the 73% on thetraining dataFigure from Provost and Fawcett, Data Science for Business, 2013Padhraic Smyth, UC Irvine: Stats 170AB, Winter 2018: 62
Example: Cellular Phone Churn-Prediction ProblemLearning curves: accuracy as a functionof number of training examplesThe tree is a more flexible model thanlogistic regression, so for this data setat least it can learn a more accuratemodel than logistic regression givenmore dataExample and figures from Provost and Fawcett, Data Science for Business, 2013Padhraic Smyth, UC Irvine: Stats 170AB, Winter 2018: 63
“All models are wrong, but some are useful”Professor G. E. P. Box, 1987Padhraic Smyth, UC Irvine: Stats 170AB, Winter 2018: 64
Practical Advice Evaluate a model using test or validation data that was unseen tothe model when it was trained– This is the only true way to assess model performance– Otherwise complex models always “win” on the training data More complex models require more training data to be effective––––Logistic models: 100’s or 1000’s of training examplesNeural networks: tens of 1000’s or even millions of training examplesTrees are often useful when dealing with real and categorical variablesSo different models are useful in different contexts Its always a good idea to start with simpler models (e.g., logistic)and then compare with more complex “challenger” modelsPadhraic Smyth, UC Irvine: Stats 170AB, Winter 2018: 65
Success Indicators for Predictive Modeling Do you have enough labeled data to train a model?– How expensive will it be to obtain labeled data? What are the costs of making errors?– Predictive models are usually trained to maximize accuracy– But real-world environments may have significant asymmetric costs How fast does your environment change?– Predictive modeling presupposes that future data is like past data– How will you detect if the environment for the model has changed?– How will the models get updated/retrained? What are the hidden costs in operationalizing a predictive model?Padhraic Smyth, UC Irvine: Stats 170AB, Winter 2018: 66
Scullley et al, NIPS 2015 ConferencePadhraic Smyth, UC Irvine: Stats 170AB, Winter 2018: 67
Classification Examples from the Real WorldPadhraic Smyth, UC Irvine: Stats 170AB, Winter 2018: 68
EXAMPLE: RECOMMENDING FRIENDS ON FACEBOOKL. Backstrom, invited keynote talk at ESWC 2011 ConferenceOnline video and slides at http://videolectures.net/eswc2011 backstrom facebook/L. Backstrom and J. LeskovecSupervised Random Walks: Predicting and Recommending Links in Social NetworksACM Conference on Web Search and Data Mining (WSDM), 2011Padhraic Smyth, UC Irvine: Stats 170AB, Winter 2018: 69
Learning to Suggest Friends on FacebookProblem: automatically suggest friendsRestrict to “friends of friends”– Still leaves 40,000 possibilities on averagePadhraic Smyth, UC Irvine: Stats 170AB, Winter 2018: 70
Learning to Suggest FriendsSolution: learn a prediction modelTarget: user clicks or not on the recommendationInput Features: mutual friends, age, geography, etcModels: combination of logistic regression and decision treesSignificant engineering:feature computation in real-time, plus real-time feedbackPadhraic Smyth, UC Irvine: Stats 170AB, Winter 2018: 71
Learning to Suggest FriendsSignificant improvement in clickthrough rate (y-axis) whensystem went livePadhraic Smyth, UC Irvine: Stats 170AB, Winter 2018: 72
?Each ? represents an “ad slot”In a fraction of a second, algorithmspredict which ads you are mostlikely to click on (from 1000’s of ads)?Padhraic Smyth, UC Irvine: Stats 170AB, Winter 2018: 73
The ads that are most likely tolead to a click are selected usingclassification models such aslogistic regression .and then displayed to youPadhraic Smyth, UC Irvine: Stats 170AB, Winter 2018: 74
Applications in Financial ForecastingDeep Learning for Mortgage Risk, Sirignano, Sadwhani, Giesecke, ArXiv 2016Problem:Predicting whether a mortgage will remain current, be paid off, or defaultData:120 million mortgages between 1995 and 2014 (70% of all US mortgages)3.5 billion borrower-month observationsPrediction Models:Deep neural networks (up to 5 hidden layers)Logistic regressionPadhraic Smyth, UC Irvine: Stats 170AB, Winter 2018: 75
Padhraic Smyth, UC Irvine: Stats 170AB, Winter 2018: 76
Applications in AstronomyFrom Kim and Brunner, Star-galaxy classification using deep neural networks, ArXiv 2016Problem:Predicting whether an astronomical image is a star or galaxyData:Approximately 50,000 images for training, 15,000 for testTwo different telescope data setsManually labeledPrediction Models:Convolutional neural networks on raw pixel data, 11 layers of weightsExisting random forest classifier for this problem using predefined featuresPadhraic Smyth, UC Irvine: Stats 170AB, Winter 2018: 77
From Kim and Brunner, Star-galaxy classification using deep neural networks, ArXiv 2016Data Set 1: CFHTLenSData Set 2: SDSSPadhraic Smyth, UC Irvine: Stats 170AB, Winter 2018: 78
A Deep Neural Network for Image RecognitionFrom Nguyen, Yosinski, Clune, CVPR 2015Padhraic Smyth, UC Irvine: Stats 170AB, Winter 2018: 79
A Deep Neural Network for Image RecognitionFrom Nguyen, Yosinski, Clune, CVPR 2015Images used for TrainingNew ImagesPadhraic Smyth, UC Irvine: Stats 170AB, Winter 2018: 80
A Deep Neural Network for Image RecognitionFrom Nguyen, Yosinski, Clune, CVPR 2015Padhraic Smyth, UC Irvine: Stats 170AB, Winter 2018: 81
A Deep Neural Network for Image RecognitionFrom Nguyen, Yosinski, Clune, CVPR 2015Padhraic Smyth, UC Irvine: Stats 170AB, Winter 2018: 82
Reading, Homework, Lectures Reference reading:Chapters 1 to 4 in Geron’s text, Hands-On Machine Learning with ScikitLearn and TensorFlow– See chapter 3 for today’s lecture on classification Homework 6– Based on Chapter 2 in Geron– Due by 2pm Wednesday next week (Monday is a holiday) Next Lectures– Today: prediction with classification– Wednesday next week: text analysis and classification– 1 more homework (#7) and then project modePadhraic Smyth, UC Irvine: Stats 170AB, Winter 2018: 83
BACKUP SLIDES:ADDITIONAL EVALUATION METHODSPadhraic Smyth, UC Irvine: Stats 170AB, Winter 2018: 84
Evaluation Methods in General When we build a predictive model how can we evaluate the model? As mentioned before, the standard approach is to keep a holdout ortest data set (that we haven’t used in any aspect of model trainingor model selection) and evaluate our error or objective function onthat, e.g.,– Squared error or classification error But this is often only part of the story .its important to look at otheraspects of performance, particularly if we want to further improveour model In the next few slides we will discuss different aspects of evaluatingor “diagnosing” model performance– These techniques can be very useful in practical applicationsPadhraic Smyth, UC Irvine: Stats 170AB, Winter 2018: 85
Classification: Confusion MatricesCount the pairs of (predicted, actual) class labels in test data setPatterns in the off-diagonal cells can be informativeTrue Class LabelsModel’sPredictionsClass 1Class 2Class 3Class 140012040Class 2298050Class 351010Padhraic Smyth, UC Irvine: Stats 170AB, Winter 2018: 86
Binary Classification: Ranking Metrics In many applications we have a set of test items and want to rank them Often rank by P(C 1 x) , where C 1 indicates the class of interest– And where P(C 1 x) is produced by our prediction model, e.g., by logisticregression Examples:––––Ranking loan applicants by likelihood of repaying the loanRanking Web users by likelihood of clicking on an adRanking patients by likelihood that they need surgeryAnd so on. In practice we could select top K-ranked items, e.g., to award a loan to– There are algorithms that “learn to rank” directlyPadhraic Smyth, UC Irvine: Stats 170AB, Winter 2018: 87
Binary Classification: Ranking Metrics To evaluate using a ranking metric we do the following– take a test set with N data vectors x– compute a score for each item , say P(C 1 x), using our prediction model– sort the N items from largest to smallest score This gives us 2 lists, each of length N– A list of predictions, with decreasing score values– A corresponding list of “ground truth” values, 0’s and 1’s for binary classlabels A variety of evaluation metrics can be computed based on these 2 g characteristicsLift curvesAnd so on.Padhraic Smyth, UC Irvine: Stats 170AB, Winter 2018: 88
Ranking TerminologyPositiveTrue LabelsPositiveNegativeTPTrue positiveFPFalse positiveFNFalse negativeTNTrue negativeModel’sPredictionsNegativePrecision TP/ (TP FP) ratio of correct positives predicted to total positive predictedRecall TP / (TP FN) ratio of correct positives predicted to actual number of positivesTypically will get high precision for low recall, and low precision at high recallPadhraic Smyth, UC Irvine: Stats 170AB, Winter 2018: 89
Simple Example of Precision and Recall Test set with 10 items, binary labels, 5 from each class (TP FN 5)Scores fromthe ModelTrue 0.030Padhraic Smyth, UC Irvine: Stats 170AB, Winter 2018: 90
Simple Example of Precision and Recall Test set with 10 items, binary labels, 5 from each class (TP FN 5)ThresholdScores fromthe ModelTrue 0.030TP 2, FP 0Precision TP/(TP FP) 100%Recall TP/(TP FN) 2/5 40%Padhraic Smyth, UC Irvine: Stats 170AB, Winter 2018: 91
Simple Example of Precision and Recall Test set with 10 items, binary labels, 5 from each class (TP FN 5)ThresholdScores fromthe ModelTrue 0.030TP 3, FP 2Precision TP/(TP FP) 60%Recall TP/(TP FN) 3/5 60%Padhraic Smyth, UC Irvine: Stats 170AB, Winter 2018: 92
Simple Example of Precision and Recall Test set with 10 items, binary labels, 5 from each class (TP FN 5)ThresholdScores fromthe ModelTrue 0.030TP 5, FP 8Precision TP/(TP FP) 62%Recall TP/(TP FN) 5/5 100%Padhraic Smyth, UC Irvine: Stats 170AB, Winter 2018: 93
How are Precision and Recall used? Precision @ K is often used as a metric, where K is the top K itemsor the top K% of the sorted prediction list– E.g., useful for evaluating search engine results Precision-recall curves can be plotted for varying thresholds– Can be useful in classifying text documentsPadhraic Smyth, UC Irvine: Stats 170AB, Winter 2018: 94
True LabelsROC PlotsPositivePositiveNegativeTPTrue positiveFPFalse positiveFNFalse negativeTNTrue negativeModel’sPredictionsNegativeTPR True Positive Rate TP / (TP FN) ratio of correct positives predicted to actual number of positives(same as recall, sensitivity, hit rate)FPR False Positive Rate FP / (FP TN) ratio of incorrect negatives predicted to actual number of negatives(same as false alarm rate)Receiver Operating Characteristic: plots TPR versus FPR as threshold variesAs we decrease our threshold, both the TPR and FPR will increase, both ending at [1, 1]Padhraic Smyth, UC Irvine: Stats 170AB, Winter 2018: 95
ROC for Binary Classification Test set with 10 items, binary labels, 5 from each class (TP FN 5)ThresholdScores fromthe ModelTrue 0.030TPR TP/(TP FN) 2/5 0.4FPR FP /(FP TN) 0/5 0.0Padhraic Smyth, UC Irvine: Stats 170AB, Winter 2018: 96
ROC for Binary Classification Test set with 10 items, binary labels, 5 from each class (TP FN 5
Predictive Modeling Two basic types of predictive models - Regression: predict a real-valued variable Y given input vector X E.g., predict what a customer will spend with a merchant in the next 12 months - Classification: predict a categorical variable Y give input vector X E.g., predict if a credit card transaction is .