Transcription
White Paper –Understanding Project S-CurvesEver increasing pressure on businesses to deliver projectson time and to budget means that accurate monitoring ofprogress, resources and costs are even more importantthan ever before.Creating a schedule of activities and a critical path usingProject Management software tells us when our project willfinish. Adding progress and actuals and then reschedulingthe remaining work will give us a revised completion date.However, it can be very difficult to visualise how the projectis performing and as importantly, how likely to performfrom a Gantt chart, particularly when the schedulecontains hundreds or thousands of activities.Andrew Willard. DirectorWillmer LimitedCreating S-Curves from the project data can give us much more information about ourproject depending on the shape of the curves. Often a client or sponsor will ask for anS-Curve as part of the regular progress report, it is recommended that they are usedalongside traditional project management software to improve project performanceand monitoring.Creating S-Curves can seem a daunting task, especially as they are not a standardfeature of most project management software applications. Project Tracker providesa one click method of importing data from Primavera P6, Microsoft Project or AstaPowerproject. Willmer Limitedwww.willmer.co.ukWhite Paper Understanding Project S CurvesJune 2016
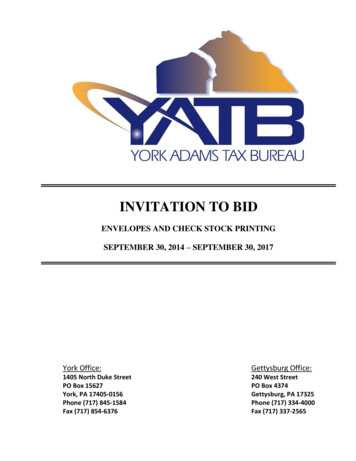
Understanding the different types of curveAn S-Curve report can be made up of a number of different curves.Actual LineThis line displays the actualprogress to date and dependanton the measure used, will showduration, cost or resource unitscompleted. The actual curve isalways drawn to the report ordata date.From the example we can seethe project is currently 23%complete.Target LineThe target line always runs from the report date to the end of the project and reflectsthe current position of the remaining activities should they be completed as scheduled. Willmer Limitedwww.willmer.co.ukWhite Paper Understanding Project S CurvesJune 2016
Early and Late Target LinesTwo additional target lines are useful that display the scheduled position of activities,both in their earliest finish and latest finish date position. Again, these are drawn fromthe report date and will meet the normal target line.Baseline LineThis line plots the position of the activities contained in the baseline. An on-scheduleplan will mean the baseline curve finishes at the same point as the target line. Willmer Limitedwww.willmer.co.ukWhite Paper Understanding Project S CurvesJune 2016
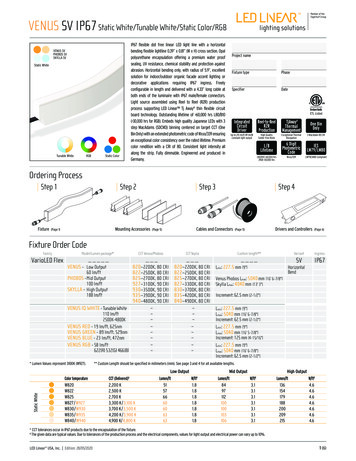
What can an S-Curve tell you about your project?Projects generally start slowly and then accelerate in the middle before slowing downagain at the end. This produces a curve which resembles an S, flatter at the start andthen rising quickly before flattening out at the end.The curve below highlights that the majority of the work in the project is front loadedand indicates the need for increased resources at the start. Scheduling more activitiestowards the start of the project than can be reasonably accomplished in the timeavailable, will result in less activities planned in the far term. Front loaded schedulesusually result in front loaded budgets, assuming the resources are aligned with theactivities.This results in good performance results, which are favourable for a period of time andthen deteriorate with time until the true performance becomes evident later in theproject. Willmer Limitedwww.willmer.co.ukWhite Paper Understanding Project S CurvesJune 2016
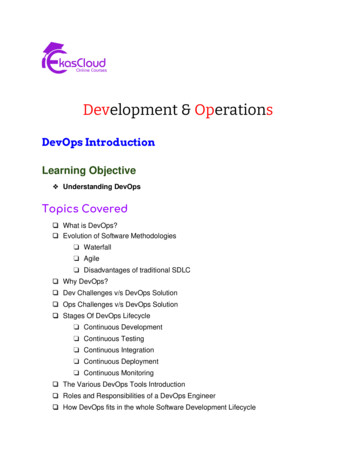
The curve shown below indicates a back loaded schedule. This may have implicationsfor an on target successful completion of the project as the bulk of the work happensat the end and any delays may be difficult to make up given the lack of time tocompletion.Assessing project performance based on the S CurveAs the project is progressed we begin to see trends and future predictions as to thelikely finish date.The following examples show the types of S Curve that might be seen in the lifetimeof the project.The report below shows that the project is behind schedule as the actual and targetlines lie below the baseline curve. The fact that the target line extends beyond thebaseline shows the project will finish late. Willmer Limitedwww.willmer.co.ukWhite Paper Understanding Project S CurvesJune 2016
The project in this instance is ahead of programme at the data date as the red actualline is above the baseline and is forecast to continue.The curve below shows the addition of a late curve, with the remaining activities intheir latest finish positions (orange). Although the project is behind schedule as theactual line is below the baseline we can see that the green target line runs betweenthe envelope of the baseline and the late line which can indicate that although progressis not on target it may be within acceptable limits. Willmer Limitedwww.willmer.co.ukWhite Paper Understanding Project S CurvesJune 2016
Drill down to look at the detailS Curves can be also used to determine the performance of specific resources orsections of the programme and their impact on the overall progress.In the example below the project is behind programme.By analysing the performance of one element or resource in the programme we cansee that it started well above expectations and is now generally on schedule. Willmer Limitedwww.willmer.co.ukWhite Paper Understanding Project S CurvesJune 2016
However, looking at another section or resource we can see performance issignificantly behind and is impacting the schedule.This detailed analysis allows us to understand better which parts of the programmeare performing well or poorly, which in turn allows us to make more informed decisionsin managing the project.SummaryAn S-Curve allows the status of a project to be monitored graphically as it progresses,and displays an historical record of actuals to date. By analysing the S-Curves, projectmanagers can quickly identify project growth, slippage, and potential issues that mayimpact the successful outcome of the project should nothing be done.For more information on this white paper, Project Tracker or Willmer Limited, visitwww.willmer.co.uk Willmer Limitedwww.willmer.co.ukWhite Paper Understanding Project S CurvesJune 2016
The AuthorAndrew Willard has spent 20 years in project management and schedulingacross industries such as construction, oil and gas, engineering,manufacturing, pharmaceuticals and IT.Clients included Lockheed Martin (US), Unocal (US), Taylor Wimpey (UK),Mace (UK), Balfour Beatty (UK), Hansen Yuncken (Aus), Abigroup (Aus) andChristchurch Rebuild (NZ).He has used this experience to identify a need for project reporting anddeveloped Project Tracker.Project TrackerProject Tracker is a Windows based application that imports projectinformation from Primavera P6, Microsoft Project and Asta Powerproject*to create S-Curves which are used to analyze the progress of the project.Most project management software does not provide in built S-Curve capability;therefore users must export data to spreadsheet software such as MicrosoftExcel to plot the curves.This method requires a number of steps and a certain level of knowledgeincluding how to add resources or costs to the plan, how to create time phasedexports from the PM tool, how to open the data in the spreadsheet and how tocreate graphs from the data. Project Tracker eliminates all of these steps.Aside from the number of steps required to export data from PM software to aspreadsheet; this method can be acceptable as a reporting medium but theproblem with this method is that the analytical possibilities are not available asthe data is now disconnected from the actual plan.Therefore rather than just importing the data required to plot a curve, ProjectTracker imports the activity data and is able to optionally plot a Gantt Chartunder the S-Curve allowing the Project Manager to assess which activities maybe causing issues and what action can be taken.One of the key benefits of Project Tracker is that it will create an S-Curve usingthe durations of activities. To produce S-Curves using the spreadsheet methodit has been necessary to add resources and/or costs to all the activities in aproject.Project Tracker will of course plot resource and cost curves but the ability touse duration data is unique. Willmer Limitedwww.willmer.co.ukWhite Paper Understanding Project S CurvesJune 2016
Willmer LimitedWillmer Limited is a UK based company that offers planning and trainingservices for any company involved in projects. The founders have many years’experience of implementing, training and delivering planning and schedulingservices to the construction, rail and engineering industries. Additionally wehave worked with Finance, IT and Pharmaceutical companies. The foundersboth worked at senior level for one of the leading project management softwarecompanies in professional services. Willmer Limitedwww.willmer.co.ukWhite Paper Understanding Project S CurvesJune 2016
information from Primavera P6, Microsoft Project and Asta Powerproject* to create S-Curves which are used to analyze the progress of the project. Most project management software does not provide in built S-Curve capability; therefore users must export data to spreadsheet software such as Microsoft Excel to plot the curves.