Transcription
AdvancedDashboards:Taking It to theNext LevelJenna ShimekTechnical Program Manager
LegalCertain information set forth in this presentation may be “forward-looking information.” Exceptfor statements of historical fact, information contained herein may constitute forward-lookingstatements. Forward-looking statements are not guarantees of future performance and unduereliance should not be placed on them. Such forward-looking statements necessarily involveknown and unknown risks and uncertainties, many of which are and will be described inSmartsheet’s filings with the US Securities and Exchange Commission, and these risks anduncertainties may cause actual performance and financial results in future periods to differmaterially from any projections of future performance or results expressed or implied by suchforward-looking statements. Although forward-looking statements contained herein are basedupon what Smartsheet management believes are reasonable assumptions, there can be noassurance that forward-looking statements will prove to be accurate, as actual results andfuture events could differ materially from those anticipated in such statements. Smartsheetundertakes no obligation to update forward-looking statements except as required by law.Smartsheet is a registered trademark of Smartsheet Inc. The names and logos of actualcompanies and products used in this presentation are the trademarks of their respectiveowners and no endorsement or affiliation is implied by their use.
Assumptions1.2.3.4.5.You’ve built dashboards alreadyBasic dashboard widget proficiencyAble to use cross-sheet formulasAudience in mind for your dashboardKnow the key metrics you want to display
GoalsShow you how to 1.Leverage the right “Smartsheet tool” to calculate key metrics2.Create the underlying metric data to report and chart on3.Apply design techniques to improve information visibility
Leverage the Right“Smartsheet Tool” toCalculate Key Metrics
Right “Smartsheet Tool” for Key MetricsTo easily display key metrics on your dashboard via metric widgets,reports and charts, can calculate key metrics in two places:1.Sheet Summary (feature)2.“Metric Sheet” (sheet you build)
Sheet Summary
Sheet SummaryGreat place to organize and calculate keymetrics because it is quick and easy to do,and enables you to aggregate the same metricacross multiple sheets.Can do: Build a sheet summary reportChart from a sheet summary reportSurface summary metrics on a dashboardNew! - Sheet summary metric widgetTough to: Build charts containing multiple variables oneach axis
Sheet SummaryRecommend using sheet summary as your tool ofchoice if you are adding data to your dashboardthat lives across multiple sheets.This type of data might be business metrics thatare standard across every program, department orproject you manage.
Metric SheetA “metric sheet” is a sheet you build, leveragingcross-sheet formulas to calculate detailed keymetrics based on information in another sheet(your source sheet).Can Do: Build complex calculationsTailor metrics specific to your teamCapture trendsProvide data source for complex chartingProvide data source for complex reporting
Metric SheetRecommend building a metric sheet if you wantto build complex reports or charts of keymetrics for your dashboard, and the data livesin one source sheet.This type of data might be team or project data,and be different from team to team or projectto project.
The Right “Smartsheet Tool” for Key MetricsLeverage Sheet SummaryBuild a Metric Sheet
Create Underlying Data
Underlying Data - Sheet SummaryLive How To
Sheet summary sessionThursday @ 9:45 AMMadyson Morris & Robin Sherwood
Underlying Data - Metric Sheet
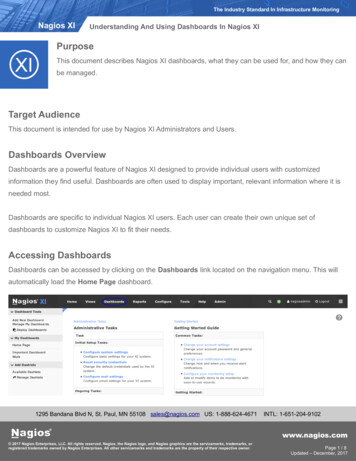
Chart OptionsLineTRENDS &COMPARISONSPieSide BarCOMPOSITION &DISTRIBUTIONStacked BarTRENDS &COMPOSITIONDonut
Pick Chart TypeDISTRIBUTION, COMPARISON, or COMPOSITIONTREND
Pick Chart TypeDISTRIBUTION, COMPARISON, or COMPOSITIONTREND
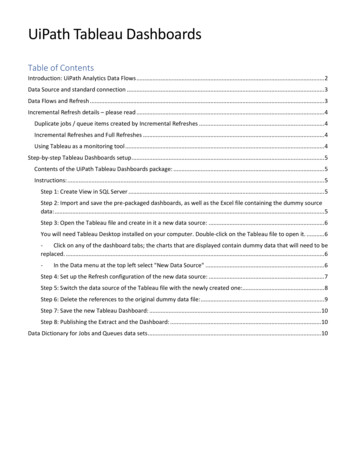
Metric Sheet Types“Trend” metrics sheet“General” metrics sheetRow and columns may have any type of criteriaSheet must have at least one date column!Example:Example:PrimaryPriority 1Priority 2Priority 3PrimaryStart DatePriority 1Priority 2 .Team A COUNTIF(.)1316Week 19/29/19 COUNTIF(.)20Team B4310Week 210/6/19310Team C025Week 310/1325
Live How To
Example Mock Dashboards
Charting pro tipsSheet design Name your columns how you want them to be displayed in the chartInclude “separator columns” to make the data easy to look atLeverage row “levels” for conditional formattingFor “trending” metric sheets - enable dependenciesFor “trending” metric sheets - remove Holidays from dependency exclusionsWriting formulas Leverage @row in formulasLeverage in formulasReference text from a cell in the sheet; do not type the “criteria” you want into the formulaCharting Chart from a report whenever possibleChart using “all columns” from report whenever possible - does not change formatting if data changesUse column with repeating single value to display a straight line on a line chartMatch chart formatting to sheet formatting on dashboard
Taking Formulas to the Next LevelThursday @ 11:00 AMCornelius Oconnor
Apply DesignTechniques to ImproveInformation Visibility
Dashboard Viewer FilterTailor information on reports and charts to thedashboard viewer.Can do: Show only viewer specific informationNew! - Dashboard viewer reports on dashboardsNew! - Dashboard viewer charts on dashboards Create one dashboard for multiple individuals Restrict viewers to only see what they haveaccess to
Dashboard formattingPick your dashboard formatting1.2.White or grey backgroundDecide on text formattingNew! Widget cut/copy and paste functionalityTitle-Keyboard shortcuts enabledHEADER ONE-Shadow of widget paste location-Dynamically move widgets when pasting-Paste across dashboards & browser tabs-Maintains source dataHeader TwoInformational Text3.4.Keep your widget format and settings the same!Update widget header background colorBe consistent!New! Ability to left, center, right align widget titles
Dashboard formattingSuggestions: White dashboard background White widget title background **Pro Tips:1.Choose text formatting color be from thesame color paletteCenter align widget titles2.Use underscores to create sections Text Format: Title text: large size, dark color, bold Headers: medium size, lighter color Informational text: small, easy to readblack or grey font3.Add title widget background color and haveno text to create section line Customize dashboard auto-refresh Make sections in your dashboard
Data formatting1.Pick data you want to accentuate. Make it popwith colors that are different from yourdashboard scheme.2.In charts, use the same color with varied gradientor different colors to help the audience relateinformation on the dashboard. Eg: match chartformatting to metric or report formatting3.Use source sheet cell formatting in metric widget4.Be mindful of people with color blindness.Use symbols instead of circles in a metric widget.Setup the symbol to automatically change witha formula.
Live How To
Q&AQ&A
Take a 3-minutesurvey!
dashboard scheme. 2. In charts, use the same color with varied gradient or different colors to help the audience relate information on the dashboard. Eg: match chart formatting to metric or report formatting 3. Use source sheet cell formatting in metric widget 4. Be mindful of people with color blindness. Use symbols instead of circles in a .