Transcription
visualizing quantitative informationmartin krzywinski
outlinebest practices of graphical data designdata-to-ink ratiocartjunkcircosthe visual display of quantitative informationedward r tufte, 2001, 2nd ed
graphical displays essentialsshow the datainduce viewer to think about substance rather than methodologyencourage eye to compare different pieces of dataavoid distorting what the data representspresent many numbers in a small spacemake large data sets coherentreveal data at several levels of detail – broad overview and fine structurethe visual display of quantitative informationedward r tufte, 2001, 2nd ed
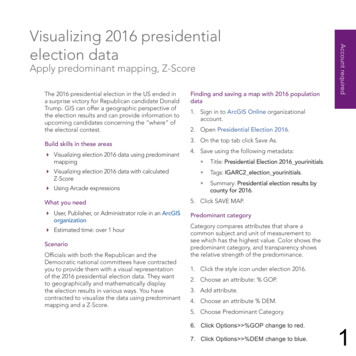
graphics reveal data and patternseach of these sets are described by the same linear modelanscombe’s quarteteach of the values below is thesame for each setnumber of pointsaverage xaverage yregression linestandard error of slopesum of squaresqresidual sum of squarescorrelation coefficientr2the visual display of quantitative informationedward r tufte, 2001, 2nd ed
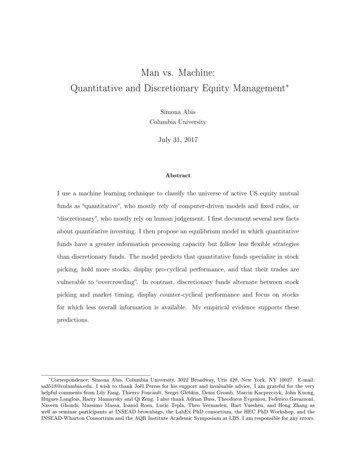
graphics organize complex informationsome data sets are naturally better represented visuallyeach of these data maps portrays 21,000 numbersalthough very dense,dense the images draw attention to hot spotsdeath rate from various cancersfemalesmalesthe visual display of quantitative informationedward r tufte, 2001, 2nd ed
graphics organize dense informationlocations and boundaries,communes inof 330,000France240,000 numbersthe visual display of quantitative informationedward r tufte, 2001, 2nd ed
graphics organize dense information1,024 x 2,222 sky divisions10 grey tonespixel grey value denotesnumber of galaxies incorresponding sky regiondensity of datacommensurate with aphotograph, butquantitativethe visual display of quantitative informationedward r tufte, 2001, 2nd ed
graphics simplify complex informationTGVthe visual display of quantitative informationedward r tufte, 2001, 2nd ed
when the image is the datathe visual medium is idealf depictingford i ti multivariatelti i tdataarguably univariate andbivariate data should betabularized, withinreasonthis example shows a plotfor a case where datacannot be easilyparametrizedthe visual display of quantitative informationedward r tufte, 2001, 2nd ed
parametrization of multivariate datathe 2D plane can depicthi h dihigh-dimensioni datad tchernoff faces are dataencodings designed foreasy identification ofoutliersparameters are mappedd tohead shape, eye distance,nose and lip sizesmoothly varying datacorresponds to smoothlyvarying chernoffpopulationlthe visual display of quantitative informationedward r tufte, 2001, 2nd ed
data-to-inkdatato ink ratioproportion of graphic’s ink devoted to the non-redundant display of datai finformationti1.0 – proportion of a graphic that can be erased without loss of datainformationdata-to-ink ratio should always be maximized, within reasonthe visual display of quantitative informationedward r tufte, 2001, 2nd ed
data-to-inkdatato ink ratiohighthe visual display of quantitative informationedward r tufte, 2001, 2nd edshockingly low
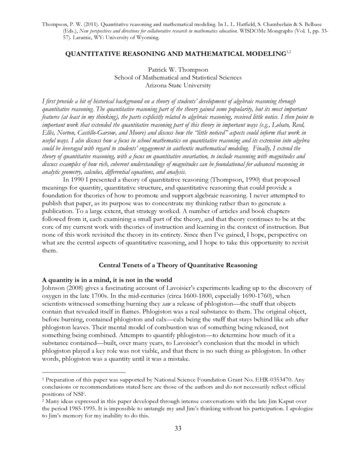
data-to-inkdatato ink ratiooriginaldeleted componentsmodified to increasedata-to-ink ratiothe visual display of quantitative informationedward r tufte, 2001, 2nd ed
shrink your graphicsdense data can be depicted within asmallll area withoutith t lossloff clarityl itas long as data-to-ink ratio is highgood graphics areinformativedensemultivariatestrive to give your viewerthe greatest number of ideasin the shortest timewithith the least inkin the smallest spacethe visual display of quantitative informationedward r tufte, 2001, 2nd ed
cartjunkexcessive use of grids and patterns cause perceived vibrationsavoid hatched patterns to limit moireavoid excessive use of decorative formsthe visual display of quantitative informationedward r tufte, 2001, 2nd ed
the shimmering statisticnatural eye tremorandd densedfillpatterns produce ashimmering effectthis is annoying andtiringthe visual display of quantitative informationedward r tufte, 2001, 2nd ed
circosthere are manyy genomegbrowsers andvisualizers already available – do we reallyneed another one?communicating data visually critical forlarge data setsyp of data that obfuscatethere certain typescommon diagram formatsstandard 2D plots (2 perpendicular axes) are inadequate
scalar mappingsscalar valued mappings are common and easily handlediinputt genomici positioniti iis a scalarl iinputtwhen the output is real-valued (GC content, conservation, etc) use a histogram, line plot, scatter plotgenome position on x-axisfunction value on y-axisf :g y
genome-to-genomegenometo genome mappingsoutput scalar is often a genome position (G2G)range may beb theth same genome, or a differentdifft genomeG2G is also common, but less easily handledf : g g′genomepositiongenomeposition
drawing G2G mappings
drawing G2G mappingsGenome Res. 2003 Jan;13(1):37-45
drawing G2G mappingsGenome Res. 2003 Jan;13(1):37-45
drawing G2G mappingsGenome Res. 2005 May;15(5):629-40
drawing G2G mappingssc7sc15IIIchr04sIchr09ch
drawing G2G mappingsGenome Res. 2003 Jan;13(1):37-45
drawing G2G omics
drawing G2G /chr7paper/chr7data/030113/segmental/index.php
drawing G2G mappings
dealing with G2G mappingsreduce information content in figuresplot/colourmapl t/ ltargettt chromosome,hnott positionitif : g g ′ c′
dealing with G2G mappingsGenome Res. 2004 Apr;14(4):685-92
reduce samplingGenome Res. 2005 Jan;15(1):98-110
rearrange axes
partition data
recompose axis layout – circos
circoswritten in PerlApache-styleconfiguration fileplain text data inputpPNG output
G2G in circosdisplay characteristicsoff mostt elementslt arecustomizabledata-drivendatadrivenformatting rulessupport for datalayers
2D data in circos
2D data in circosboxscatterline
2D data in circostilestileshistogramheatmapschr2
non-linearnonlinear scalingglobal scaling – scaleoff eachh idideogramcan be adjustede g chr 1 drawn at 8xe.g.local scaling – anyregion can be locallyexpandedd d orcontractede.g.eg 100-150 Mb onchr1 expanded 5x
non-linearnonlinear scaling
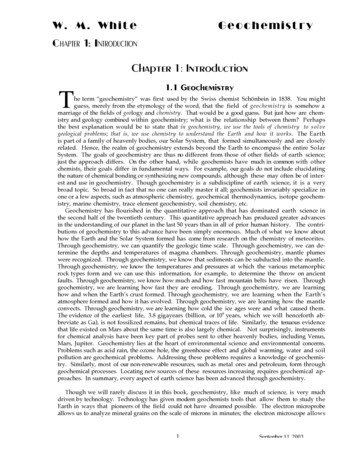
circos in comparative genomicsmouse chr3mouse chr1human chr1
circos in comparative genomicschlamydia D fingerprint mapvschlamydia D sequence
circos in comparative genomicschlamydia L fingerprint mapvschlamydia D sequence
blast of regions of chr14 vs chr22alignments drawn asribbonsibbsinglealignment
circos is flexible
scircos art
visualizing quantitative informationvisualizing quantitative information martin krzywinski. outoutlineline best practices of graphical data design data-to-ink ratio cartjunk . reveal data at several levels of detail - broad overview and fine structure the visual display of quantitative information edward r tufte, 2001, 2nd ed.