Transcription
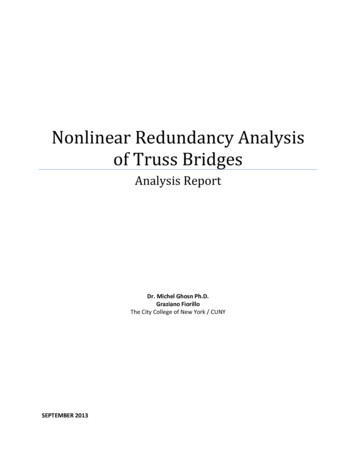
Nonlinear Redundancy Analysisof Truss BridgesAnalysis ReportDr. Michel Ghosn Ph.D.Graziano FiorilloThe City College of New York / CUNYSEPTEMBER 2013
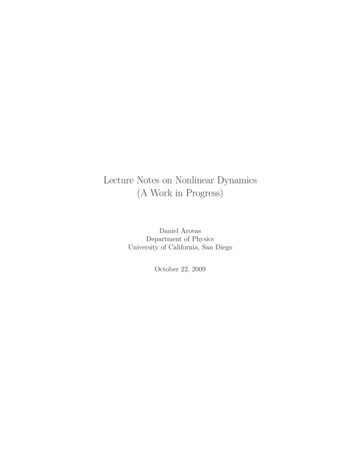
NON-LINEAR PUSH-DOWN ANALYSES OF TRUSS BRIDGESSEPTEMBER 2013AcknowledgmentsThis section describes the redundancy analysis of a truss bridge example. The example is an adaptation ofa model of the Åby bridge truss in Sweden. The authors are grateful to Dr. Lennart Elfgren, Professoremeritus of the Dept. of Civil, Environmental and Natural Resources Engineering, Luleå University ofTechnology, in Sweden, for providing the structural model and the plans of the bridge, Prof YongmingTu from Southeast University, SEU, in Nanjing China for developing the original structural model thatwas the basis of the modified model used in this Report, and to Prof. Joan Ramon Casas and Ms. MiriamSoriano from the Technical University of Catalonia in Barcelona Spain for facilitating the transfer of themodel and assisting in interpreting the model and the bridge plans.NON-LINEAR ANALYSIS OF TRUSS BRIDGEThis report describes the results of the redundancy analysis of a typical simply supported truss bridgesuperstructure and its ability to continue to carry vehicular loads beyond the elastic limit. The object ofthe analysis is to investigate the residual capacity of the structure above the design load and the ensuingnonlinear behavior.The analysis is performed with the commercial software ABAQUS. The 3D model is shown in Figure 1.Each member of the bridge is modeled with 2D shell elements. The materials used in this analysis aregrade 36 ksi steel for the truss members and the deck beams. The concrete deck is modeled using astrength f’c 4.0 ksi. The structural steel is assumed to be nonlinear, while the concrete is assumed toremain elastic as the deck’s contribution to the strength of the structural system is not taken intoconsideration.The commercial software ABAQUS is used for the structural analysis because of its flexibility and itscapability to account for material nonlinearity using advanced models. The analysis is performed for theload location that will give the most critical system response. For all the cases considered, that positioncoincided with the truck being placed near the middle of the span. This also assured that the samebaseline is used in the comparison of the maximum effect.In a first analysis, the originally intact bridge is loaded by the dead weight and two side-by-side HS-20trucks. The truck loads are incremented and a pushdown analysis is performed up to the complete failureof the structure. In a second set of analyses, eleven different damage scenarios are considered where ineach scenario a different truss member is removed from the structure.The analysis results show that the bridge behaves differently depending on the damage scenario, butoverall the truss bridge shows a post linear capacity for most cases.This document is divided into four sections. In the first section, the geometry of the bridge is described. Inthe second section, the results of the analysis are presented for the intact bridge. The third section showsthe results of the damaged bridge scenarios. In the final section, the results of the damaged bridgescenarios are compared to the result of the pushdown of the originally intact bridge.B.1-1
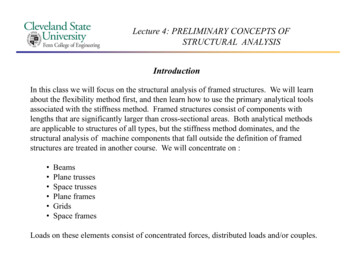
NON-LINEAR PUSH-DOWN ANALYSES OF TRUSS BRIDGESSEPTEMBER 2013Figure 1- Original ABAQUS Model of Sample Truss Bridge1. Bridge DescriptionA 3-D finite element model is used to analyze the behavior of the superstructure of the example trussbridge. The model is an adaptation of the Åby bridge truss in Sweden converted for vehicular type traffic.The bridge is 110 ft long and 24 ft wide. The geometric dimensions are shown in Figure 2. The truss’svertical members are spaced at 14 ft. Also, the main transverse beams are at 14’f from each other and theend beams are at 13 ft from the support. The truss is 14.5 ft high. The longitudinal deck stringers arespaced at 6.0 center to center. The concrete deck thickness is 6.5 in.The applied live load is assumed to consist of two AASHTO HS20 trucks with typical axle load of 8, 32,and 32 kip respectively. The two trucks are assumed to be side –by-side and the most eccentric wheelload set is applied at 2.0 ft from the edge of the truss. The second wheel load is spaced 6.0 ft from theother wheel. The second truck load is spaced at 4.0 ft from the first truck. The transverse load location isshown in the bottom right corner of Figure 2.a) - Bridge ProfileB.1-2
NON-LINEAR PUSH-DOWN ANALYSES OF TRUSS BRIDGESSEPTEMBER 2013b) – Bridge Bottom Viewc) – Bridge Cross Sectiond) HS-20 Live Load Configuratione) Typical Aby Bridge Connection DetailFigure 2- Bridge Geometry and Load Location PointsB.1-3
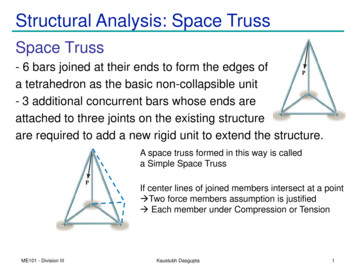
NON-LINEAR PUSH-DOWN ANALYSES OF TRUSS BRIDGESSEPTEMBER 2013The steel truss members and the deck’s cross beams and longitudinal beams are formed by assemblies ofsteel plates. The widths and thicknesses of the steel plates are listed in Table 1 for each member.Table 1 – Steel Plates DimensionsCross sectiontypeTruss ComponentVertical Flange (x2)Vertical WebDiagonal Flange (x2)Diagonal WebCompression Chord Flange (x 2)Compression Chord Web (x 2)Tension Chord Flange TopTension Chord Flange BottomTension Chord Web (x 2)DeckCross Beam Flange (x 2)Cross Beam WebLongitudinal Stringer Flange (x 2)Longitudinal Stringer WebI-beamI-beambox-beamU shapeWidth [in]12.015.012.015.012.012.612.010.010.0Thickness 120.430.350.430.35I-beamI-beamThe concrete deck strength is assumed to be 4.0 ksi. The stress strain curve for the steel is depicted in thegraph of Figure 3. The Young’s modulus is 29,000 ksi and the Poisson’s coefficient is 0.3.70Stress [ksi]605040302010000.050.10.150.2StrainFigure 3 – Stress-Strain Curve for Grade 50 SteelB.1-40.25
NON-LINEAR PUSH-DOWN ANALYSES OF TRUSS BRIDGESSEPTEMBER 2013As shown in Figure 3, in order to account for local failures that may not necessarily affect the globalresponse of the structure after local fracture, the steel’s stress-strain curve is assumed to drop to a verysmall value of stress while keeping its ability to sustain additional strain after rupture. This will provideABAQUS with the ability to represent the spread of plasticity after a local failure without encounteringnumerical instabilities.While the proposed model accounts for the nonlinear behavior of the steel truss and girders, it is assumedthat the bridge’s concrete slab remains in the linear elastic range throughout the loading process. Thisassumption is made to catch the nonlinear behavior of the trusses alone. The concrete’s Young modulusis assumed to be equal to 3,600 ksi and the concrete’s Poisson ratio is equal to 0.2. These valuescorrespond to a concrete strength f’c 4.0 ksi.The Von Mises model is suitable for most common steel static nonlinear analysis problems such asevaluating the ultimate load capacity of structural systems. The Von Mises plasticity model for structuralsteel is based on the Von Mises stress, VM, which is obtained from the stress tensor at every point of thebody as shown in Eq. 1: VM 1222( X Y ) 2 ( Y Z ) 2 ( X Z ) 2 6( XY XZ YZ)2 (1)Where X is the normal stress component in the X direction, Y is the normal stress component in the Ydirection, Z is the normal stress component in the Z direction, XY is the shear stress component in the Ydirection applied on the plane normal to the X axis, XZ is the shear stress component in the Z directionapplied on the plane normal to the X axis, and YZ is the shear stress component in the Z direction appliedon the plane normal to the Y axis.To perform the nonlinear static analysis, ABAQUS applies increments to either the load applied on thestructure (load control) or the displacement (displacement control). At every step, the program compares VM of every element to check where it falls on the stress-strain curve shown in Figure 3. The programthen adjusts the material’s stiffness and checks whether the value of VM is lower than the material’scapacity. The program then traces the load-displacement curve for the control node selected by the user.In the analyses performed in this document, the control node is selected to be the node of the truss atwhich the maximum vertical displacement is measured.B.1-5
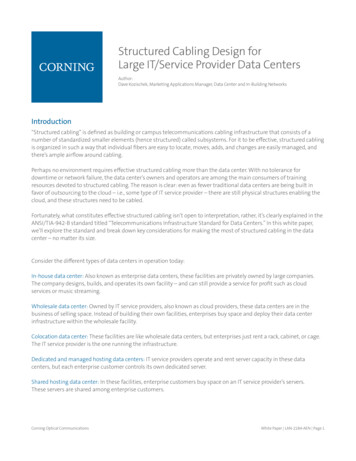
NON-LINEAR PUSH-DOWN ANALYSES OF TRUSS BRIDGESSEPTEMBER 20132. Analysis of the Intact Truss BridgeThe push down analysis is performed on the originally intact bridge labeled as Model 1. The bridge isassumed to fail either when the structure reaches collapse or the maximum displacement reaches a valueof span length/50 which is a very high value used to simply stop the analysis when a very large level ofplasticity takes place. In this example, the bridge length is 110 ft and the displacement limit is 2.2 ft or26.4 inches.The program first applies the dead load to the structure that consists of the weight of steel trusses, thegirders and the weight of the concrete deck; then it applies the live load due to the two side-by-side HS20trucks. The live load is then incremented until the failure of the structure. According to Ghosn and Moses(1998) the acceptable level of redundancy depends on the type of failure considered. For an intact bridge,two redundancy measures can be evaluated: The first is related to the ultimate capacity of the system andthe second is related to the functionality limit states. For the ultimate limit state, the load factor LFu givesthe number HS-20 trucks required to cause collapse and redundancy is measured as the ratio between LFuand LF1, where LF1 is defined as the minimum value that causes the failure of the first member. LF1 isequal to (R – D)/LL , where R is the member capacity of the most critical component, D is the dead loadeffect and LL is the live load effect of two HS20 trucks. The load factor corresponding to LF1 for thisbridge is equal to 7.00 indicating that the first member fails when each of the two HS trucks are loadedeach up to a total weight equal to 72x7.00 504 kip or a total live load of 1008 kip. The value for LF1 iscalculated using the commercial software SAP2000 assuming linear elastic behavior of the truss as isdone using traditional structural design and evaluation methods. For the functionality limit state, theredundancy is measured as the ratio between the LFf which gives the number of HS-20 trucks needed tocause a maximum vertical displacement equal to span length/100 and LF1 as defined earlier.The result of the nonlinear analysis is depicted in the load deformation curve of Figure 4. The curveprovides the maximum live load normalized to the weight of two HS20 side-by-side trucks (LF) versusthe maximum vertical displacement. The behavior of the structure is globally linear until the point wherethe truss’s compression chord starts to buckle although some portions of the structure have already startedto yield, the yielding is still in its initial phase and thus the curve is almost linear until the onset ofbuckling. The buckling makes the structure deform without any significant additional increment in theapplied load as the maximum displacement varies between 2 and 6 inch. After the deflection reaches 6inch, the structure begins to unload but continues to deflect until collapse. The maximum load effect LFuobtained for this configuration is equal to 9.45 times the effect of the two HS20 side-by-side trucks. Thevalue of LF1 is about 7.00 times the effect of the HS-20 live load. Hence, the redundancy ratio for theultimate limit state is equal to 9.45/7.00 1.35 which is greater than the reference value of 1.30 asrecommended in the NCHRP report 406 for the ultimate limit state.When the maximum displacement reaches L/100 or 13.2 inches the maximum live load factor is about 9.0and the redundancy ratio is equal to 9.00/7.00 1.28, which is greater than the reference value of 1.10recommended in NCHRP 406 for the functionality limit.Figures 5 and 6 show the effect of the buckling on the structure and the area of the bridge where thematerial yields. It is noted that the bridge is able to redistribute the load to regions far away from the areaB.1-6
NON-LINEAR PUSH-DOWN ANALYSES OF TRUSS BRIDGESSEPTEMBER 2013where the buckling is concentrated. This is possible when the connections between the two paralleltrusses and the deck are sufficiently strong to allow for the redistribution of the load from the moreheavily loaded truss to the other truss. .According to the criteria defined in NCHRP report 406, the intact bridge structure analyzed in thisexample can be considered ent [in]Figure 4 – Model 1 – Intact Structure Displacement vs Normalized Vertical LoadB.1-7
NON-LINEAR PUSH-DOWN ANALYSES OF TRUSS BRIDGESSEPTEMBER 2013Figure 5 – Model 1 – Intact Structure Plastic RegionsFigure 6- Model 1 – Bottom View of Intact Structure Showing the Buckling FailureB.1-8
NON-LINEAR PUSH-DOWN ANALYSES OF TRUSS BRIDGESSEPTEMBER 20133. Analysis of Damaged BridgeIn this section, the bridge is analyzed assuming different damage scenarios. The damages are applied tothe truss that is close to the vehicle loads, which is the truss that failed during the analysis of theoriginally intact bridge. Damages in all four types of truss members are considered: 1) the compressionchords on the top of the truss; 2) the tension chords in the bottom part of the truss; 3) vertical membersand; 4) to the diagonals. In all cases, the damage is simulated by removing an entire member and thepushdown analysis is performed on the modified models. This would simulate the fracture of tensionmembers due fatigue or the failure of any member due to an impact. It is noted that the analysis isperformed to estimate the post-damage capacity of the system under static loading. The analysis does notconsider the dynamic behavior during impact or during the release of the fracture energy. The purpose ofthe analysis is to verify that a damaged bridges will still be able to carry a sufficient level of traffic untilthe damage is noticed, the proper authorities alerted and appropriate decisions on repair or closure aretaken.Model 2: Damage of Compression ChordsWhen the damage is applied at the compression chord, three cases have been considered, one for eachcompression member from the support through the middle span as shown in Figure 7. In the first case, thecompression member is removed in the part of the truss closest to the support (CM01). Subsequently, inthe two other cases CM02 and CM03, a different compressive chord member is removed one at a time.B.1-9
NON-LINEAR PUSH-DOWN ANALYSES OF TRUSS BRIDGESSEPTEMBER 2013CM01CM02CM03Figure 7- Model 2 – Damaged Structure of Compression Chords (CM01, CM02 and CM03)B.1-10
NON-LINEAR PUSH-DOWN ANALYSES OF TRUSS BRIDGESSEPTEMBER 2013The results of the analysis of the cases of compression chord member damage show that when onemember of the compression chord is removed, the overall stiffness of the truss is drastically compromisedand the stiffness is reduced compared to the stiffness of the intact bridge. However, despite the lowerstiffness, this particular bridge configuration is able to carry significant live load after damage. In fact, thebridge is able to reach a capacity of two times the effect of two side-by-side HS20 trucks before reachingthe functionality limit state as shown in Figure 8. This is possible because the connections between thetruss members of this bridge can carry a substantial level of moment and do not behave as pins. A typicalconnection for this bridge is shown in Figure 2. Because of the connection type, the bridge is able toredistribute the load to other elements of the structure through moments. Figure 9 is provided to helpvisualizes this aspect of the load redistribution process which shows how plasticity spreads to themembers close to and far away from the damaged portion of the chord. The span/100 displacement ofthe damaged bridge is reached at a load increment of 2.80 trucks for cases CM01 and CM02 and 1.50 forCM03. The ratio of these loads compared to LF1 are 2.80/7.00 0.40 for CM01 and CM02 and 1.50/7.00 0.21for case Displacement [in]Figure 8- Model 2 – Damaged Structure Displacement vs Normalized Vertical Load (CM01-CM03)B.1-11
NON-LINEAR PUSH-DOWN ANALYSES OF TRUSS BRIDGESSEPTEMBER 2013Figure 9- Model 2 – Top Chord Damaged Structure Moment Effect of the ConnectionAt the damaged limit state NCHRP 406 requires that the redundancy of the damaged bridge be equal orgreater than 0.50. The normalized vertical load factor LF obtained for the damaged top chord scenariosare 2.09 for case CM03, 3.57 for CM02 and 4.68 for CM01 as shown by the load deflection curves ofFigure 8. The damage redundancy ratio varies from 2.09/7.00 0.30 through 4.68/7.00 0.66.According to NCHRP 406, the bridge is non-redundant if it is subjected to a damage of the type of CM03which removes the middle top compression chord, while a bridge subjected to the damages of typesCM01 and CM02 can be considered redundant.For damage scenarios related o the compression chord the final failure of the bridge happens by rupture ofthe tension members in the vicinity of the damage as shown in Figure 10.B.1-12
NON-LINEAR PUSH-DOWN ANALYSES OF TRUSS BRIDGESFigure 10- Model 2 – Top Chord Damaged Structure Plastic FailureB.1-13SEPTEMBER 2013
NON-LINEAR PUSH-DOWN ANALYSES OF TRUSS BRIDGESSEPTEMBER 2013Model 3: Damage of the Tension ChordIn this damaged configuration, the tension chord close to the middle point of the bridge was removed(TM01). The damaged bridge configuration is shown in Figure 11. This type of damage can simulate thescenario of the member loss due to fatigue fracture.Figure 11- Model 3 – Damaged Structure of Tension Chord (TM01)The results of the pushdown analysis shows that the loss of a tension member in the lower chord does notaffect substantially the performance of the structure, as shown in the load versus deformation curve inFigure 12. This happens, because the deck can provide sufficient capacity to carry the load that wasoriginally in the missing member. Both the stiffness and ultimate capacity of the bridge system arecomparable to those of the intact bridge isplacement [in]Figure 12- Model 3 – Damaged Structure Displacement vs Normalized Vertical Load (TM01)B.1-14
NON-LINEAR PUSH-DOWN ANALYSES OF TRUSS BRIDGESSEPTEMBER 2013The redundancy ratio for the load that causes a deflection equal to span length/100 is equal to 8.60/7.00 1.23, while the redundancy ratio for the damage limit state is equal to 9.14/7.00 1.31 which is muchgreater than 0.50 which was proposed in NCHRP report 406. This effect as noticed earlier is theconsequence of the fact that the damage of the tension does not significantly affect the behavior of thetruss because the deck can replace the original contribution of the missing member.The failure of the truss as was observed in the intact configuration happens due to the buckling of thecompression chord as shown in Figure 13.Figure 13- Model 3 – Bottom View of Tension Member Damaged Structure Showing Buckling FailureModel 4: Damage of Vertical MembersFor this damage type, four different scenarios have been considered. One vertical member at a time isremoved for each of the four cases as shown in Figure 14. In the first case, the diagonal member isremoved in the part of the truss closest to the support (VM01). In the three following cases VM02, VM03and VM04 are removed one at a time. The loading is still kept at the middle of the bridge because thishappens to gives the lowest capacity for the system.The results of the analysis for this type of damage shows that when one vertical member is removed, theglobal stiffness of the truss is not compromised compared to that of the intact bridge while the maximumcapacity is slightly reduced as shown in the load displacement curves of Figure 15. The bridge finallyfails due to the buckling of the compression chord; this is depicted in the failure mode of Figure 16.B.1-15
NON-LINEAR PUSH-DOWN ANALYSES OF TRUSS BRIDGESSEPTEMBER 2013VM01VM02VM03VM04Figure 14- Model 4 – Damaged Structure of Vertical Members (VM01, VM02, VM03 and VM04)B.1-16
NON-LINEAR PUSH-DOWN ANALYSES OF TRUSS BRIDGESSEPTEMBER 2013When a vertical member near the support is damaged (VM01 and VM02), the behavior of the truss ispractically the same as that of the intact structure. This means that the two vertical elements for thespecific load condition do not contribute significantly to the distribution of the load. The redundancyratios at span length/100 and for the maximum load for the damage limit states are equal to theredundancy values of the intact bridge at the functionality and ultimate limit states with LF ratios areequal to 1.28 and 1.35 respectively.When the damaged element is closer to the load location (middle of the span), the effect of the damagebecomes more significant. The maximum capacity and the load at span/100 are reduced compared to theoriginally intact bridge. In fact, the VM03 and VM04 curves in Figure 15 show a reduction in thecapacity compared to that of the originally intact system, while cases VM01 and VM02 show similarresults as those of the originally intact systemThe redundancy at span length/100 ranges between 7.97/7.00 1.14 for the damage condition VM04 and9.00/7.00 1.29 for cases VM01 and VM02. The damage bridge redundancy ratio varies from 8.90/7.00 1.27 through 9.45/7.00 1.35. According to the NCHRP 406 the structure for all vertical member casescan be considered 015202530Displacement [in]Figure 15- Model 4 – Damaged Structure Displacement vs Normalized Vertical Load (VM01 – VM04)B.1-17
NON-LINEAR PUSH-DOWN ANALYSES OF TRUSS BRIDGESSEPTEMBER 2013Figure 16- Model 4 – Bottom View of Damaged Structure Showing Buckling FailureModel 5: Damage of Diagonal MembersFor this damage scenario, three cases have been considered. One diagonal member at time is removed foreach of the four cases as shown in Figure 17. In the first case the diagonal member of the truss closest tothe support is removed (DM01). Subsequently, in the two cases DM02, and DM03, a new diagonalmember is removed after restoring the previously eliminated member.The results of the analysis of this type of damage show that when the diagonal is removed at the support,the global stiffness is affected. In fact, for this case the truss effect is missing and the entire load istransferred through the connection at the bottom to the truss away from the load as shown in Figure 18.For the remaining cases, the stiffness is not compromised as much as in case DM01 although the stiffnessis lower than that of the intact scenario. For these cases, the effect of redistribution of the load to a widerportion of the structure allows the bridge to reach an ultimate capacity greater than that of the intactbridge. This is possible because the failure mechanism is not localized in one portion of the truss andplasticity distributes throughout the system and is not concentrated in the region close to the load as in theintact configuration that produces buckling of the compression chord before the load redistributes toregions away from the load. The damage and the failure for cases DM02 and DM03 are shown in Figure19 while the results of the analysis represented by the load versus displacement curves are shown inFigure 20.B.1-18
NON-LINEAR PUSH-DOWN ANALYSES OF TRUSS BRIDGESSEPTEMBER 2013DM01DM02DM03Figure 17- Model 5 – Damaged Structure of Diagonal Members (DM01, DM02, DM03 and DM04)B.1-19
NON-LINEAR PUSH-DOWN ANALYSES OF TRUSS BRIDGESSEPTEMBER 2013Figure 18- Model 5 – Damaged Structure Moment Effect of the Connection (DM01)Figure 19- Model 5 – Bottom View of Diagonal Damaged Structure Plastic - Buckling FailureB.1-20
NON-LINEAR PUSH-DOWN ANALYSES OF TRUSS BRIDGESSEPTEMBER cement [in]Figure 20- Model 5 – Damaged Structure Displacement vs Normalized Vertical Load (DM01 – DM03)The redundancy ratio for case DM01 is equal to 6.34/7.00 0.91 for the span length/100. The redundancyratio for the damaged limit state is equal to 8.60/7.00 1.23 that is much greater than the 0.50 criterionproposed in NCHRP 406.At the span length/100, the redundancy ratios for damage scenarios cases DM02 and DM03 are equal to9.46/7.00 1.35 and 9.78/7.00 1.40 respectively. The redundancy ratio for the damaged limit state isequal to 9.60/7.00 1.37 for case DM02 and 9.89/7.00 1.41 for case DM03. The bridge is considered tobe redundant for these two damage scenarios according to the NCHRP 406 criteria.4. Comparison of ResultsThe analysis of different daamage scenarios for the exmple truss analyzed in this Report showed that theredundancy ratio depends on the location where the damage develops. In fact, the ratio for different limitstates varies considerably. Table 2 summarises the results of the different damage scenarios.Table 2 shows that the laod at which the span length/100 dispalcment is reached varies from a minimumof 0.21 for case CM01 to a maximum of 1.40 for case DM03, while the maximum capacity ratio variesfrom a minimum of 0.30 for case CM01 to a maximum of 1.41 for case DM03.It is noted that local failure of each member of a damaged truss depends on the load location. However,our analysis cncenrtated on the global behavior and the laod was applied in the position that prodcued thecrictial damaged system capcity. If one wishes to study the local behavior of the truss members, thenB.1-21
NON-LINEAR PUSH-DOWN ANALYSES OF TRUSS BRIDGESSEPTEMBER 2013different laoding positions should be used for the different damage scenarios. That would be needed toidentify which members must be strengthened to improve the global behavior of the damaged systems.The good perforamnce of his system is related to the types of connections used in this truss and the abilityof the deck to redistrbute the load both of these factors can drastically affect the global behavior of thesystem.Table 2 – Redundancy Ratios for Aby Bridge (shaded cell shows low redundancy level)LFu/LF1Ultimate limitstate of originallyintact bridgeAnalysis 031.35-LFf/LF1Functionalitylimit state oforiginally intactbridge1.29B.1-22LFd/LF1Redundancy ratiofor damagedbridge .41LF100/LF1for damagedbridge .40
NON-LINEAR PUSH-DOWN ANALYSES OF TRUSS BRIDGESSEPTEMBER 2013CONCLUSIONSThe analysis of the system redundancy of truss bridges is a complex process that requires an exhaustiveinvestigation in order to characterize all possible damage scenarios and the response of the bridge to thesecases under different loading conditions.The analysis of the sample brige presented in this report shows that the redundancy is strongly dependentof the location of the damage. For example, the originally intact bridge provides sufficient levelsredundancy for both the functionality and ultimate limit states according to the criteria proposed inNCHRP report 406.For the damaged scenarios, the values of the redundancy ratios vary in function of the location of thedamage. As an example, the damaged case redundancy ratio varies from a minimum of 0.30 for caseCM03 which assumes that the compression top chord member near the middle of the bridge is damagedthrough a maximum of 1.41 for case DM03 which is assuems that a diagonal member near the middle ofthe span is damaged.The type of connections used between the truss members and the connections bewteen the trusses and thedeck affect drastically the global behavior of the truss system.B.1-23
The materials used in this analysis are grade 36 ksi steel for the truss members and the deck beams. The concrete deck is modeled using a strength f' c 4.0 ksi. The structural steel is assumed to be nonlinear, while the concrete is assumed to remain elastic as the deck's contribution to the strength of the structural system is not taken into