Transcription
Structural-ThermalOptical-Performance(STOP) AnalysisAugust 5, 2015GSFC· 2015Jeffery Bolognese/NASA/GSFC-Code 542Branch Head, Mechanical Systems Analysis and SimulationBranchSandra Irish/NASA/GSFC-Code 542Group Leader, Mechanical Systems Analysis GroupAugust 5, 2015TFAWS 2015 – August 3-7, 20151
Course DescriptionStructural-Thermal-Optical-Performance (STOP) AnalysisA STOP analysis is a multidiscipline analysis, consistingof Structural, Thermal, and Optical Performanceanalyses, that is performed for all space flightinstruments and satellites. This course will explain thedifferent parts of performing this analysis. The studentwill learn how to effectively interact with each disciplinein order to accurately obtain the system analysis results.August 5, 2015TFAWS 2015 – August 3-7, 20152
Outline of Presentation PurposeGeneral InformationAnalysis CycleLevels of Analysis FidelityData TransferModel ChecksThermal ModelingStructural ModelingOptical ModelingBest PracticesAdditional Things to ConsiderSummaryAugust 5, 2015TFAWS 2015 – August 3-7, 20153
Structural-Thermal-Optical-Performance (STOP) Analysis: Purpose STOP analysis estimates the thermally-inducedperformance degradation of an optical system– Possible objectives Create or verify system engineering budget allocation for giventhermal loading Stress/Deflection responses to address load capability of thestructure Final performance estimate for programs with incompleteground testing, such as JWST– Typical quantities predicted Mirror surface distortion Structure distortion and stress System wavefront and pointing error due to optics motions(rigid-body)– Cyclical in nature and applied at various phases during thedesign cycle with various levels of model maturity A complete and thorough analysis requires expertisein 3 disciplines Thermal design/analysis Structural design/analysis Optical design/analysis Team needs to work together!!!August 5, 2015TFAWS 2015 – August 3-7, 20154
STOP Analysis: General Information Basic Data Flow (see next chart)– * Thermal model creates temperature set(s)– * Temperatures are applied to structural model– Distortion or motion of key optics calculated in structural model– Distortions or motions applied to optical model– Optical figure of merit calculatedKey kickoff STOP team meeting agenda items (generally organized bymechanical lead):– Determine optics sensitive to motion– * Thermal environments in which data may be taken– * A common coordinate systems, origin, and units for all 3 models– * Data transfer methods between disciplines (see later chart)(* Refers to items concerning thermal team member.)August 5, 2015TFAWS 2015 – August 3-7, 20155
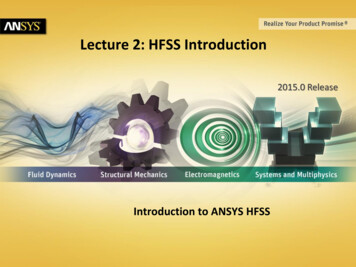
STOP Analysis Cycle (1/2)Preliminary DesignOrange Box—ThermalYellow Box—MechanicalBlue S/PrelimSTOP ctionsTherm.RequirementsFinal, on-orbitoptical distortionpredictionBasic trade studies anddesign iterations(materials, geometry, etc)Optical Analysisw/STOP Disp.Opt. Disp.STOP AnalysisFEMNoAre prelim.results l refinementsand updatesw/test resultsFinalDesignYesDoes designmeet opticalrequirements?NoDesign iterationsand refinement(structural,thermal)Design VerificationAugust 5, 2015TFAWS 2015 – August 3-7, 20156
STOP Analysis Cycle (2/2) Conceptual– STOCS (structural/thermal/optical shifts) analysis Assumes stress free mounting of components and uniform gradientsand bulk temps. Used sometimes in initial evaluation of a design Structural modeling may be relatively simplified at this stage Preliminary Design– Primary structure modeled with simplified secondary structure (andpossibly optics)– Captures load paths more accurately than STOCS and used tomore accurately predicts optics motion– Initially used with artificial load cases for sensitivity analysis, butmay be refined with more detailed thermal mapping– Material trade studies often performed Design Verification– Detailed model with all optics and mounts modeled.– On-orbit temperatures (and possibly test configurations) modeledwith optics motions mapped back to optical analysis for fullanalysis cycle.August 5, 2015TFAWS 2015 – August 3-7, 20157
Level of Analysis Fidelity Conceptual Design––– Preliminary Design––– PM Low-Fidelity Structural ModelDescription: Flat plate model to representPM and bar elements to representmountsPurpose: Simple sensitivity (bulk andgradients) and trade studiesPM Mid-Fidelity Structural ModelDescription: Solid model to represent PMand bar and spring elements to representmountsPurpose: Mapping with preliminarytemperatures and material trade studiesDesign Verification–––August 5, 2015PM High-Fidelity Structural ModelDescription: Detailed plate model thatrepresents all core and mirror segmentgeometry and detailed bar and solidelements to represent the mountsPurpose: Detailed temperatures mappedto predict final optical performanceTFAWS 2015 – August 3-7, 20158
STOP Analysis: Data Transfer Data transfer between disciplines is always challenging!Thermal-to-structural data flows:– Thermal calculates T using TMG, outputs text files with node ID, [X,Y, Z,] and T.Structures uses MATLAB to read and map this data to the nearest NASTRAN grids.Requires extensive manual mapping adjustment (being used for JWST)– Same model geometry used for both the structural model and thermal model. Mappingperformed internal to TMG! The difficulty is agreeing on a common model geometry,like blanketing (used for TPF).– Thermal engineer accepts a similar (but not identical) structural model and mappedtemperatures using Thermal Desktop (used for TIRS, ATLAS).Structural to Optical data flows:– Optics provides sensitivities in Matlab to structures. They are scaled by calculatedoptical motions to approximate performance. Checked with ray traces (being used forJWST)– Deformations provided in an Excel spreadsheet and applied by scripting in ZEMAXoptical analysis program (was used for IRMOS)– SIGFIT transformed NASTRAN punch file data into interferograms. These were addedto optical model by a MATLAB routine created by the Optics engineer. Output isoptical performance. (was used for TPF) Note, SIGFIT has recently been updated so it can take NASTRAN data and convert it directedto optical data without having to use a MATLAB routine!August 5, 2015TFAWS 2015 – August 3-7, 20159
STOP Analysis: Model Checks Thermal to Structural– Geometric comparison between Thermal and Structural Models– Temperature comparison between Thermal and Structural ModelsStructural to Optical– Optical results (WFE) comparison between Structural Model prediction andOptical Model to a known values– Final check with computed results between simplified optical representationand full optical analysis programAugust 5, 2015TFAWS 2015 – August 3-7, 201510
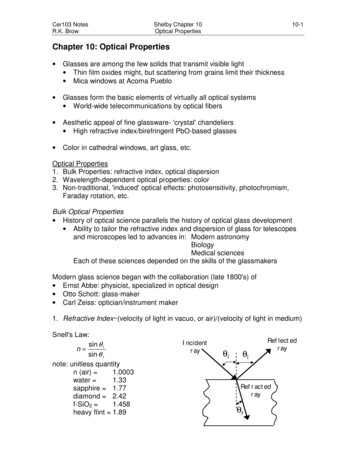
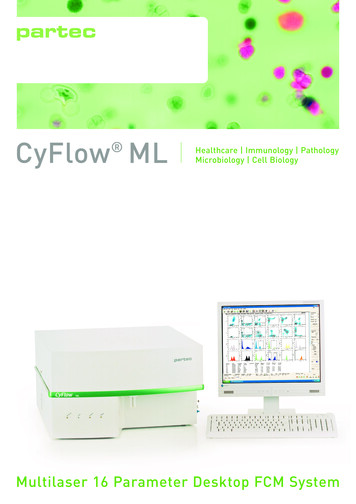
Comparison of Structural and Thermal Models of JWST BSFStructuralThermalAugust 5, 2015TFAWS 2015 – August 3-7, 201511
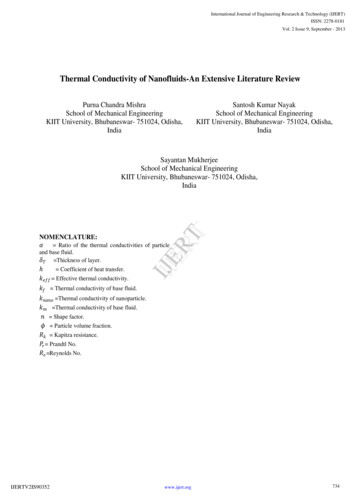
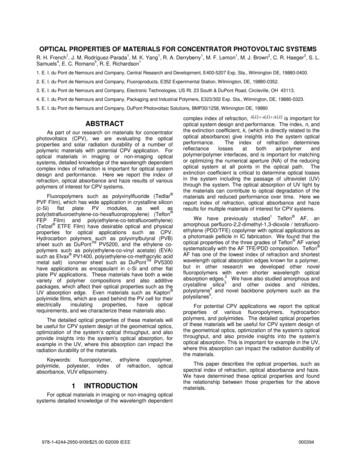
Comparison of Structural and Thermal Models for JWST BSFOverlaidStructural Model in OrangeThermal Model in YellowThe red membersline up poorly ornot at all with thestructural model.The red memberswere removed fromthe mapping script.August 5, 2015TFAWS 2015 – August 3-7, 201512
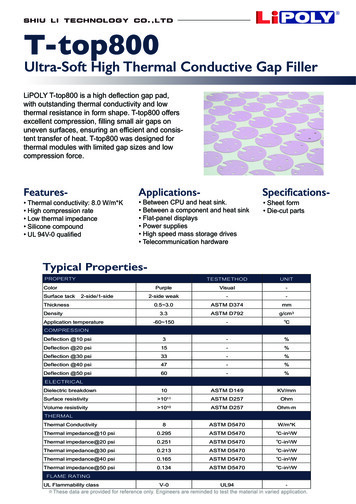
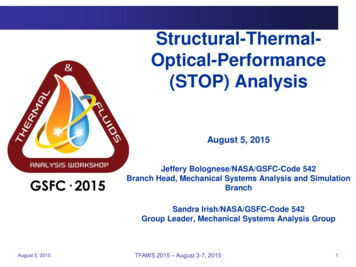
Temperature Comparison for Structural and Thermal Models ofJWST BSFStructuralThermalAugust 5, 2015TFAWS 2015 – August 3-7, 2015Temperature (K)13
STOP Analysis: Thermal Modeling Final result: provide thermal model nodal temperatures due to all critical events to structuralengineerThermal model– Thermal engineer can use any program to develop thermal model and calculatetemperatures, such as TMG, TSS and SINDA, FEMAP, PATRAN, Thermal Desktop,etc. JWST using TMG but most other projects using Thermal Desktop– Discussion with structural engineer as to the format of the temperatures Temperature mapping can be performed by Thermal Engineer or StructuralEngineer TMG or Thermal Desktop works well for mapping especially if corner nodemethod is used. Blanketing---how will that be handled?– Discussion with structural engineer as to the thermal cases to be analyzed (iterationsoften required after initial optical results) Hot Case Cold Case Worst gradientsData flow checks to be performed– Provide temperature case used for initial mapping– Compare temperatures from thermal analysis with structural model temperaturesMeet all modeling guidelines and analysis checksAugust 5, 2015TFAWS 2015 – August 3-7, 201514
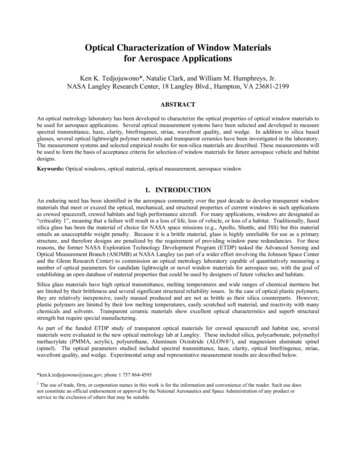
Temperature Distribution for TPF PM Only (delta temperatures from 190-225 dither)August 5, 2015TFAWS 2015 – August 3-7, 201515
STOP Analysis: Structural Modeling Final Result: Provide deformation or motion of opticalelements and other critical components to opticalengineer. Structural Model– Structural engineer can use any program to perform structuralanalysis NASTRAN dominates @ GSFC but any FEM code could be used Create and manipulate models with PATRAN, FEMAP, etc.– Establish format of the temperatures with thermal engineer– Establish format of the deformation with optical engineer– Can also develop initial optics results utilizing a LOM or MATLABscript provided by the optical engineer (this helps with manythermal load case iterations that are often needed) Data flow checks to be performed– Compare temperatures from thermal analysis with structuralmodel temperatures– Simple deformation cases used to check optical analysis anddata flow Meet all modeling guidelines and analysis checksAugust 5, 2015TFAWS 2015 – August 3-7, 201516
TPF PM High-Fidelity Structural Model: PM Parameters177196 grids285472 elementsPM material is ULE.Important Parameters in Model Outer dimensions Facesheet thickness Backsheet thickness Top of core thickness Core thickness Top of segment struts thickness Segment struts thickness Perimeter thickness Model WeightfacesheetperimeterAugust 5, 2015TFAWS 2015 – August 3-7, 201517
Thermal Distortion for TPF PM Only (delta temperatures from 190-225 dither)Max deflection 1.09E-11 mAugust 5, 2015TFAWS 2015 – August 3-7, 201518
Component Level Modeling STOP analysis models often are very detailedand time consuming to solve So, many instances, the assembly will be brokenup into components to perform structural/thermalmapping of that component The mapped components are then combined torun the assembly model. See the following example performed for theJWST ISIM Beam Image Analyzer.TFAWS 2015 – August 3-7, 201519
Component—TRI-Beam of JWST ISIM BIA (1/3)29.87 K24.64 KTFAWS 2015 – August 3-7, 201520(K)
Component-Translation Stages of JWST ISIM BIA (2/3)29.8734.85KK24.64 K21.27 KTFAWS 2015 – August 3-7, 201521(K)
Component-Sensor Head of JWST ISIM BIA (3/3)39.97 K22.55 KTFAWS 2015 – August 3-7, 201522(K)
Assembly of JWST ISIM BIA39.97 K22.55 KTFAWS 2015 – August 3-7, 201523(K)
STOP Analysis: Optical Modeling Final result: Key figure of merit compared with opticalrequirements. Will the system work? Optical Model– Optical engineer can use any program to model opticalperformance, such as Code V, ZEMAX, etc.– Discussions with structural engineer as to the format of thedeformation for optical analysis Data flow checks to be performed– Simple deformation cases used to check optical analysis anddata flow Meet all modeling guidelines and analysis checksAugust 5, 2015TFAWS 2015 – August 3-7, 201524
Optical Performance for TPF PM Only (delta temperatures from 190-225 dither)August 5, 2015TFAWS 2015 – August 3-7, 201525
Comparison of TPF PM Thermal Distortion for High & Mid-Fidelity Models: Optical Performance for TPF PM Only(delta temperatures from 190-225 dither)Results Using Mid-Fidelity PM ModelResults Using Hi-Fidelity PM ModelFactor of 2xDifferenceResidual OPD Map: Subtracting 15 ZernikesAugust 5, 2015TFAWS 2015 – August 3-7, 201526
ATLAS STOP FEM and Temperature MappingUndeformed StructureAugust 5, 2015TFAWS 2015 – August 3-7, 2015Temperature (C)27
ATLAS STOP FEM DisplacementsDeformed StructureAugust 5, 2015Deflection (in)TFAWS 2015 – August 3-7, 201528
Best Practices Early coordination among thermal, structural and optical engineersBEFORE modeling begins will streamline the process. Test and validate data transfer methods between engineeringdisciplines– How will temps be mapped to structural model?– Verify that structural displacements of optics are in the correctformat for optical analysis (coord system, units, etc).– Perform sample “dry runs” of data transfer before tackling actualmodel results Don’t wait until the full-up, detailed model is complete before testverifying model results– Component level testing can be very useful, since much of theoptical error can occur at that level rather than at the full, opticalbench level It’s important to make sure all three disciplines (structural, thermal, andoptical) are involved in the STOP analysis– Shortcuts in any one disciplines can reduce confidence in resultsand make identifying sources of results error that much harderAugust 5, 2015TFAWS 2015 – August 3-7, 201529
Additional Things to Consider When used most effectively, STOP analysis is aniterative process performed at multiple stages of thedesign process.– Initially should be considered part of the design process The greater the number of interfaces in the structure, thegreater the possibility of introducing error.– Can become increasing complicated if components andsubstructures are coming in from different sources to beintegrated with the full-up system model This is truly multi-disciplinary analysis process andneeds the contributions of all three disciplinesAugust 5, 2015TFAWS 2015 – August 3-7, 201530
Summary STOP analysis is an integrated, multidiscipline systemanalysis which predicts performance of an optical systemdue to variations in temperature STOP analysis requires involvement from thermal,structural and optical engineering design and analysis Communication between team members throughout theentire process is key in completing an accurate,comprehensive STOP analysis!August 5, 2015TFAWS 2015 – August 3-7, 201531
Structural-Thermal-Optical-Performance (STOP) Analysis A STOP analysis is a multidiscipline analysis, consisting of Structural, Thermal, and Optical Performance analyses, that is performed for all space flight instruments and satellites. This course will explain the different parts of performing this analysis. The student