Transcription
Introduction to Structural Estimationin Corporate FinanceLuke TaylorApril 2017
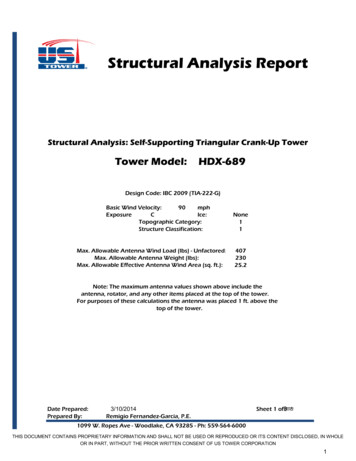
THE BIG PICTUREIVDescriptiveEmpiricalcorporatefinanceDiff in DiffReduced siondiscontinuityEtc.
PLAN What is structural estimation? Terminology An example Structural vs. reduced-form estimation Why do it? What structural estimation buys you How to motivate a structural estimation paper Advantages and disadvantages vs. reduced-form estimation Is structural estimation good for your career? How to do it How to generate research ideas How to do SMM Which estimator should you use? Identification Tricks of the trade / warnings How to referee a structural estimation paper Where to learn more
FIRST, SOME TERMINOLOGY It makes no sense to say “structural model” All economic models are “structural” Usually when people say “structural model,” they really mean“dynamic model” It makes a lot of sense to talk about “structural estimation” versus“reduced-form estimation”
STATISTICAL AND ECONOMIC MODELS A statistical model describes the relation between two or morerandom variables:Y X’b e An economic model starts with assumptions about Agents’ preferences Constraints Information environment Firms’ production functions Some notion of equilibrium, etc. Then it makes predictions about the relation between observable,often endogenous variables
WHAT IS STRUCTURAL ESTIMATION? Structural estimation is an attempt to estimate an economicmodel’s parameters and assess model fit. Parameters to estimate often include Preference parameters (e.g., risk aversion coefficient) Technology parameters (e.g. production function’s curvature) Other time-invariant institutional features(e.g. agents’ bargaining power, financing frictions) Structural estimation ascertains whether optimal decisions impliedby a model resemble actual decisions made by firms
EXAMPLE: “DYNAMIC DEBT RUNS.” from 2014 JFEEconomic model: Setting: Continuous time, 1 borrowing firm, continuum of lenders Production function:Asset value follows geometric Brownian motion Financing: Firm buys an asset by issuing equity & short-term debt Preferences: Risk-neutral lenders optimally choose whether to rollover debt or “run” Information: a lender’s decision depends on beliefs about otherlenders’ decisions (strategic complementarity) Equilibrium: debt is priced in competitive market
EXAMPLE: “DYNAMIC DEBT RUNS.”Parameters to estimate:1.2.3.4.5.6.7.8.Volatility for asset’s Brownian motionDrift““““*Average debt maturityAverage asset maturityPerceived weakness of firm’s backup credit guaranteeAsset’s liquidity recovery rate in defaultCap on yield spreadsInvestors’ discount rate* Drift is not identified. We assume a value, use alternate values inrobustness section.
EXAMPLE: “DYNAMIC DEBT RUNS.”Data: Panel data on firms issuing ABCP (short-term debt) in 2007 Variables: Weekly spreads (i.e. prices) on ABCP Indicator for whether firm is experiencing a run
EXAMPLE: “DYNAMIC DEBT RUNS.”Assessing model fit: How well does model fit Frequency and timing of “recoveries” from runs Average debt yields in event time leading up to runs Yield volatility and its relation to yield levels Probability of future run, given current yield level(forecasting regression)
WHAT KIND OF MODEL I LIKE TO USE The model has to be an economic rather than statistical model Should produce realistic magnitudes and distributions No two-state, “profits-are-either-high-or-low” models Structural estimation may or may not require a dynamic– asopposed to static– model Hennessy and Whited (2005, JF) Dynamic Albuquerque and Schroth (2010, JFE) Static But usually no two- or three-period models
CALIBRATION VS. STRUCTURAL ESTIMATIONCalibrationStructural estimation Take parameter values fromother papers Usually have more parametersthan moments model isn’tidentified, can’t put standarderrors on parameters Mainly a theoretical exercise Infer parameter values from thedata Get standard errors forparameters An empirical exerciseBoth: Can assess how well model fits the data– but no statistical tests withcalibration Can use model to ask counterfactual questions: What would happen if we shocked this variable? How would world look if we changed this parameter’s value?
STRUCTURAL VS. REDUCED-FORM ESTIMATIONQuestionsReduced-formStructural estimationWhat is the (causal)effect of X on Y? Why does X causes Y? What are the parameters’ magnitudes?[ “Parameters” economic primitives“Parameters” slopes, correlations ] How well does theory fit the data? How would the world look if one of theparameters (counterfactually) changed? What would happen if you(counterfactually) shocked the system
STRUCTURAL VS. REDUCED-FORM ESTIMATIONReduced-formToolsEstimators: OLS IV Diff-in-diff Regression discontinuitySoftware: StataStructuralSolving the model: Value function iteration ODE/PDE solvers SimulationEstimators: GMM Simulated method of moments (SMM) Maximum likelihood (ML) Simulated maximum likelihood (SML) [See Streb. and Whited (2012) for more]Software: Matlab, C , Julia, Fortran, etc.
STRUCTURAL VS. REDUCED-FORM (TERMINOLOGY) Economic models often imply a “reduced-form,” meaning a statistical modeldescribing the relation between observables generated by the model. Example from “Why are CEOs rarely fired?”One reduced-form prediction from the structural model:1(𝐶𝐶𝐶𝐶𝐶𝐶 ���𝑖 𝛽𝛽0𝜏𝜏 𝛽𝛽1𝜏𝜏 𝜋𝜋𝑖𝑖𝑖𝑖 𝛽𝛽2𝜏𝜏 𝜋𝜋𝑖𝑖𝑖𝑖 1 . . . 𝜀𝜀𝑖𝑖𝑖𝑖The regression slopes 𝛽𝛽 are nonlinear functions of the model’s structuralparameters.The true reduced-form may actually be nonlinear in 𝜋𝜋.
PLAN What is it? Why do it? What structural estimation buys you How to motivate a structural estimation paper Advantages and disadvantages vs. reduced-form Is structural estimation good for your career? How to do it How to referee a structural estimation paper Where to learn more
STRUCTURAL ESTIMATION BUYS YOU THREE THINGSFrom least to most interesting:1. Estimates of interesting economic primitives2. “Deep” tests of theory: Formal, joint tests of multiple predictions(e.g., test of overidentifying restrictions in GMM or SMM) Testing quantitative, not just directional predictions Seeing where models fail opens doors to future research(Example: Mehra and Prescott (1985), equity premium puzzle)3. Can answer interesting counterfactual questionsCaveat: Reduced-form papers can also ask counterfactual questions, by changing a regressor from its actualvalue to a counterfactual value. But it’s usually less convincing, because it’s harder to believe “all else equal.”Also, it’s impossible to shock primitives in reduced-form papers .
EXAMPLE: “WHY ARE CEOS RARELY FIRED?.” from 2010 JFFrom least to most interesting:1. Estimates of interesting economic primitives:I estimate a parameter that quantifies CEO entrenchment:Directors’ disutility from firing a CEO2. “Deep” tests of theory:Model does a good job fitting most moments but struggles to fit(1) changes in profitability in the year after CEOs fired, and(2) high rate at which CEOs are fired in their first 2 years in office3. Can answer interesting counterfactual questions:How much would firm value change if we eliminated CEOentrenchment?Set the entrenchment parameter to zero Firm value increases by 3%.
EXAMPLE: “DYNAMIC DEBT RUNS .”1. Estimates of interesting parameters:Not so interesting in this paper2. “Deep” tests of theory:Model does a good job fitting most moments but, in onesubsample, overpredicts runs when yields are high.3. Can answer interesting counterfactual questions:How does the probability of a run react to a (counterfactual) Equity injection:Reducing leverage by 1% lowers Pr{run} by 45% Improvement in asset liquidity Reduction in asset volatility Strengthening of backup credit guarantees Longer debt maturity or shorter asset maturity
MOTIVATING A STRUCTURAL PAPER Structural estimation imposes large costs on the reader Any structural paper must put great effort intoconvincing reader that it’s worth going structural Next slide: an example
EXAMPLE: “DYNAMIC DEBT RUNS.”Question: How sensitive are runs to their various potential mptionsReduced-form estimationStructural estimationRegress 1(run) on determinants ofruns(leverage, liquidity,volatility, guarantee strength ) Estimate structural parameters by Tough to get data on leverage, Estimate these quantities structurallyliquidity, assets’ value, assets’volatility, guarantee strength Need sufficient heterogeneity indeterminantsSMM Use counterfactual analysis tomeasure sensitivity of runs todeterminantsfrom data on prices, runs, andrecoveries Do not need heterogeneity indeterminants Exogenous variation in determinants Model is true:(i.e., regression does not omit anycorrelated determinants of runs) Got the functional form right- Includes all determinants of runs- Rational investors- Functional forms are correctThe structural approach complements existing reduced-form research by(1) overcoming certain data challenges(2) imposing a different type of identifying assumption.
STRUCTURAL VS. REDUCED-FORM ESTIMATIONAdvantagesReduced-formStructural estimation “Fewer” assumptions? Often the only feasible option for Results more convincing?Easier to doEasier to understand larger audienceanswering certain important questions Tough to find good instruments The connection between theory and testsof theory is extremely tight, which allowsmore transparent interpretation of anyresults. Structural estimation “puts thetheory first” and makes it explicit. Results generalize better? For job market: Makes you look smartBottom line: Do what lets you answer your research question most convincingly and easily If structural and reduced-form will both get the job done, go reduced-form!!
PLAN What is it? Why do it? How to do it How to generate research ideas How to do SMM Which estimator should you use? Identification Tricks of the trade / warnings How to referee a structural estimation paper Where to learn more
HOW TO DO SMM (1 of 2)(Modified from Strebulaev and Whited (2012))First steps:1. Choose moments to match. Can include means, variances, covariances, regressionslopes, etc. Need at least as many moments as parameters. Extra momentsprovide a test of overidentifying restrictions.2. Compute moments in actual data, stack them in a vector M3. Estimate the covariance of M. Invert it. This is your efficient SMM/GMM weightingmatrix, W.Second steps:1. Pick β0 starting guess for the parameter vector2. Using β0, solve model, create simulated data using policy function, calculate samemoments that were calculated with real data. Stack them in vector m(β0). Notesimulated moments m depend on parameter values β0.3. Compute the SMM objective function as𝑄𝑄(𝛽𝛽0 ) (𝑀𝑀 𝑚𝑚(𝛽𝛽0 ))’ 𝑊𝑊 (𝑀𝑀 𝑚𝑚(𝛽𝛽0 ))4. Find the parameter vector 𝛽𝛽̂ that minimizes Q. This is your parameter estimate.
HOW TO DO SMM (2 of 2)5. Compute parameters’ standard errors while adjusting for simulation error.N number of observations in actual dataJ number of simulated observations / NCovariance matrix of 𝑁𝑁(𝛽𝛽̂ 𝛽𝛽) is11 𝐽𝐽′ 𝑚𝑚 𝛽𝛽 𝑚𝑚 𝛽𝛽𝑊𝑊 𝛽𝛽 𝛽𝛽 16. Compute the test of overidentifying restrictions, which tests whether the modeljointly matches all moments. The test statistic is𝑁𝑁𝑁𝑁𝑄𝑄 𝛽𝛽 𝜒𝜒 ���𝑚 ���𝑝𝑝𝑝𝑝𝑝𝑝𝑝1 𝐽𝐽7. Optional but interesting: counterfactual exercises. Change one or more parametersfrom their estimated values to counterfactual values, then examine how model’spredictions change. Shock one or more exogenous variables in the model .
WHICH ESTIMATOR SHOULD YOU USE?EstimatorPros / consGMM- Need closed-form solution FastSMM Don’t need closed-form solutions- Extremely slow (use parallel computing as much as possible) Can use “complicated” moments, sample the data in strange ways .GMM & SMM- Choice of moments is subjective and arbitrary (sometimes a ) Semiparametric: Does not require a complete specification of theprobability distribution of the data Have control over weights put on each moment Delivers a test of over-identifying restrictions
WHICH ESTIMATOR SHOULD YOU USE?EstimatorMaximumlikelihood (ML)Simulatedmaximumlikelihood (SML)Pros / cons Fast Asymptotically efficient: consistent, asymptotically normal,“smallest standard errors”- Need closed-form solutions Don’t need to subjectively choose moments /- “Uses all the moments” predicted by the model- Fully parametric[All the same pros / cons as ML, except slower than ML] Easy to accommodate heterogeneity in parameter values
WHICH ESTIMATOR SHOULD YOU USE?EstimatorMarkov chainMonte CarloPros / cons Good at estimating non-linear models with many latent variablesthat require high-dimensional integration to evaluate the likelihoodfunction Good at handing hierarchical models Good at handling missing data Faster than SMM Good small-sample propertiesSee Arthur Korteweg’s webpage for more info
WHICH ESTIMATOR SHOULD YOU USE?Bottom line:I don’t care much which estimator you use.As long as the model is well identified, it should not matter much.
IDENTIFICATION: STRUCTURAL VS. REDUCED-FORM Identification is often confused with establishing causation Formal statistical definition of identification: Econometrician defines an objective function over parameters and data Goal: Select parameters that minimize this objective function (E.g. Find regression slope that minimizes sum of squared errors) A parameter is identified if there is a unique minimum for the objectivefunction at its true value in the population A parameter can be identified (in the statistical sense) without beingeconomically interesting Prime example: Regression of endogenous Y on endogenous X Our goal: Identify parameters that are economically interesting The parameters may be elasticities defining causal effects But they need not be! Not all economically interesting parameters are causal elasticitiesSource: “Identification with models and exogenous data variation,” by R. Jay Kahn and Toni M. Whited
IDENTIFICATION: STRUCTURAL VS. REDUCED-FORM Exogenous variation is: Always necessary to identify a causal relation Never sufficient for identifying an economically interesting parameter You also need an economic model (either mathematical or verbal) Only sometimes necessary to identify an economically interestingparameter Interesting parameters can sometimes be identified without exogenousvariation. This is often what’s going on in structural corporate finance. In what follows, I’ll use the formal statistical definition of identificationSource: “Identification with models and exogenous data variation,” by R. Jay Kahn and Toni M. Whited
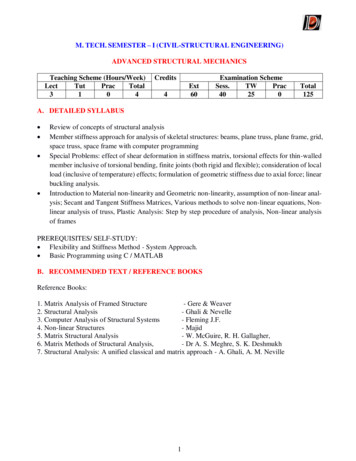
EXAMPLE OF AN UNIDENTIFIED MODEL (MLE) Want to estimate parameters α and β Parameters α and β appear in the likelihood function only in the form α/β The fraction α/β will be identified, but α and β will not be separatelyidentified Likelihood function is flat at its max:Likelihood function from aboveLikelihood functionαββα
HOW TO CHOOSE MOMENTS IN SMM/GMMMust choose moments with extreme care to obtain an identified model Best-case scenario: each moment depends on just 1 model parameter:“Moment 1 identifies parameter 1, moment 2 identifies parameter 2 ” More realistic: every moment depends on every parameter Do comparative statics to understand how each moment moves with eachparameter. Make sure you understand the economics behind each comparativestatic result. Need enough moments, and moments that move in in different directions fordifferent parameters, to obtain identification. It’s a good idea to use moments describing the policy function Policy function: Mapping from state variables to choice variables See Bazdresch, Kahn, and Whited (2014)If the author cannot clearly explain which features of the data identify each parameter,the paper is not very convincing. Structural estimation should not be a black box.
IDENTIFICATION AND OMITTED VARIABLES “Just as there does not exist any perfectly exogenous source of datavariation in observational studies, structural estimation does not magicallysolve all endogeneity problems.” (Strebulaev and Whited, 2012) An important, common criticism:“The structural model has omitted an important aspect of reality.” The model may be well identified in a technical, econometric sense, eventhough it omits this “variable” Even if the model is well identified, we may not want to take its resultsseriously if the omitted “variable” is important. Potential solutions: Avoid using moments that are contaminated by omitted forces Use moments that already “sweep out” the omitted variable(See Hennessy and Whited, 2005) TONS of robustness exercises. Extend the model to include the omittedvariable, re-estimate.
IDENTIFICATION – GENERAL REMARKS “Endogeneity” is not necessarily a problem here. Structural estimationaccounts for and exploits endogeneity within the model to get parameterestimates. It’s usually very difficult to prove whether a model is identified Two useful checks:1. If a parameter’s standard error is huge, it’s probably not identified2. (GMM or SMM) A necessary condition for local identification: TheJacobian of moments w.r.t. parameters, 𝛽𝛽 𝛽𝛽, must have full rank It’s okay to “calibrate” nuisance parameters that are hard to identifyExample: In “Why are CEOs rarely fired?” I set discount factor to 0.9 and tryalternative values for robustness.
IDENTIFICATION AND PARAMETER HETEROGENEITY Model is usually about a single firm Common identifying assumption:Parameter values are constant across all firms and years within the sample. It’s analogous to assuming a regression slope is the same for all observationsin a regression Sometimes interesting to ask how parameters vary across firms, years, etc. How to address / explore parameter heterogeneity: Estimate the model in subsamples. Do results go the way you expected? Use the method in Taylor (2012), “CEO wage dynamics .” Before estimating, purge heterogeneity that’s outside the model E.g., remove firm and time fixed effects before measuring moments
PRACTICAL TIPSGeneral tips: Before going structural, convince yourself that a structural approach isabsolutely necessary. Don’t start estimating or gathering data until you’re convinced the model isidentified and you understand why/how A way to check whether model is identified:1.2.3.4.Simulate a “fake” dataset off the modelEstimate the model, treating the fake data as if it were real dataDoes the estimator recover the true, known parameter values?Are your standard errors accurate? Repeat exercise several times.Across simulations, should find:Stdev(estimates) Average (standard error)
PRACTICAL TIPSTips for SMM/GMM: Switching moments is a huge pain. Think carefully about identificationbefore coding/estimating On searching the parameter space to minimize the objective function Use the simulated annealing (SA) algorithm to avoid local minima Once SA converges, run a deterministic minimizer like Matlab’sfminsearch. Run SA from multiple initial parameter guesses in parallel on Wharton’scomputing grid. Use the same seed for the random-number generator each time yousimulate data off the model.
PRACTICAL TIPSTips for SMM/GMM: Get the standard errors right. The actual data are usually not i.i.d. When estimating the covariance matrix for empirical moments[Cov(M)], must take into account Heteroskedasticity Time-series autocorrelation Cross-sectional correlation Serial correlation, including correlation across moments.
GETTING THE STANDARD ERRORS RIGHT (CONTINUED) Example: Empirical moments are slopes 𝛽𝛽 and 𝛾𝛾 from regressions𝑦𝑦𝑖𝑖𝑖𝑖 𝛽𝛽𝛽𝛽𝑖𝑖𝑖𝑖 𝜀𝜀𝑖𝑖𝑖𝑖ℎ𝑖𝑖𝑖𝑖 𝛾𝛾𝑧𝑧𝑖𝑖𝑖𝑖 𝛿𝛿𝑖𝑖𝑖𝑖 Need to compute𝑐𝑐𝑐𝑐𝑐𝑐 𝑀𝑀 Must take into account𝑐𝑐𝑐𝑐𝑐𝑐𝑐𝑐 𝜀𝜀𝑖𝑖𝑖𝑖 , 𝜀𝜀𝑖𝑖𝑖𝑖 0𝑐𝑐𝑐𝑐𝑐𝑐𝑐𝑐 𝜀𝜀𝑖𝑖𝑖𝑖 , 𝜀𝜀𝑗𝑗𝑗𝑗 0𝑐𝑐𝑐𝑐𝑐𝑐𝑐𝑐 𝜀𝜀𝑖𝑖𝑖𝑖 , 𝛿𝛿𝑗𝑗𝑗𝑗 0𝑣𝑣𝑎𝑎𝑎𝑎 𝛽𝛽𝑐𝑐𝑐𝑐𝑐𝑐 𝛽𝛽, 𝛾𝛾𝑐𝑐𝑐𝑐𝑐𝑐(𝛾𝛾, 𝛽𝛽) 𝑣𝑣𝑣𝑣𝑣𝑣(𝛾𝛾)[Time-series autocorrelation][Cross-sectional correlation][Time-series and cross-sectional correlationacross regressions] How to do it? Estimate the empirical moments M as a big GMM system withappropriately robust, clustered errors. See Taylor (2010) and Taylor (2012).Or use influence functions, as in Erickson and Whited’s papers (see my note,“How to compute the standard error for anything, using influencefunctions”)
PLAN What is it? Why do it? How to do it How to referee a structural estimation paper Where to learn more
QUESTIONS A REFEREE MIGHT ASK Am I convinced that we need structural estimation? Why won’t a reduced-form approach work? Is the economic question important? Or are we using a large hammer to hit a small nail? Is the identification clear, or is it a black box? Which features of the data identify each parameter, and why/how? Is model fitting the data reasonably well? If not, what can we learn from its failure? Usually not a deal-breaker Are moments contaminated by important omitted economic forces? If so, how could the omission bias the estimates? Have authors explored interesting heterogeneity in the parameters? E.g, estimate model in subsamples Enriches paper, provides useful consistency checks Does the paper take full advantage of counterfactual exercises?
WHERE TO LEARN MORE These slides owe a large debt to Toni Whited. Other resources from Toni: Her 2012 survey article with Strebulaev: “Dynamic models and structuralestimation in corporate finance” Her nontechnical lecture slides on structural estimation:http://toni.marginalq.com/fma2011.pdf Her technical slides on structural estimation:http://toni.marginalq.com/FMA.pdf Take an empirical Industrial Organization (IO) course Read papers that do structural estimation (that’s how I learned!) 2017 Mitsui Summer School on Structural Estimation Corporate Finance
WHY GO STRUCTURAL? BECAUSE IT’S FUN!Going structural may be right for you if you actually know what “robust” does in Stata you asked Santa Claus for the newest version of Matlab you left your last girlfriend/boyfriend for a Bellman equation you’d rather clean data than clean your laundry there’s not much on your calendar for next few years you’re emotionally robustIt’s easier than it looks. Go for it!
Choose moments to match. Can include means, variances, covariances, regression slopes, etc. Need at least as many moments as parameters. Extra moments provide a test of overidentifying restrictions. 2. Compute moments in actual data, stack them in a vector M 3. Estimate the covariance of M. Invert it. This is your efficient SMM/GMM weighting .