Transcription
Supply Market IndicatorMethodologyLast updatedContact: Retail Market Analysis teamMethodology29/01/2015Tel:020 7901 7000Appendix 130/04/2015Email:SMI@ofgem.gov.ukOverview:To make the energy market clearer for consumers, Ofgem regularly publishes its SupplyMarket Indicator, which provides a forward-looking estimate of average costs and marginsfor a representative large supplier.This report shows how we produce the SMI.Ofgem/Ofgem E-Serve 9 Millbank, London SW1P 3GEwww.ofgem.gov.uk
Supply Market IndicatorContents1. Introduction2What is the SMI?BackgroundStakeholder feedback1112. Interpreting the SMI3How to interpret the SMIInterpretation exampleLinks with our wider market monitoringSMI and CSSSMI and wider monitoring work334553. Data and methodologyHow is the SMI constructed?Domestic consumption and customer numbersRevenueCost componentsWholesale costsNetwork costsSupplier operating costsEnvironmental and social obligations costsVATSupplier pre-tax margin7788991315161717Appendix 1 – Data sources18Appendix 2 – Wholesale cost methodology25Appendix 3 – Glossary30Version historyVersion date27/03/1431/07/1427/11/1429/01/15Summary of changesFirst edition following 2013/14 review of methodologyConsumption input methodology amendedNetwork charges methodology amended to note thatwe use indicative and final charges when available.Methodology updated to include Contracts forDifference (CfDs) cost estimates.
Supply Market Indicator1. IntroductionChapter SummaryThis chapter defines the Supply Market Indicator (SMI) and provides a briefbackground on its origin.What is the SMI?1.1. The purpose of the SMI is to help consumers and other stakeholdersunderstand pricing trends in the domestic energy supply market. It providescommentary on recent and possible future cost trends. It does so by estimatingaverage costs and margins for a representative large supplier, using publiclyavailable and verifiable data where we can.1.2. The SMI examines the relationship between this stylised supplier’s annualcosts and revenue in the form of the average domestic consumer’s annual energybills. It calculates the indicative average pre-tax margin that a large supplier mayregister for a gas, electricity and dual-fuel customer for the following 12 months.Background1.3. Following the 2008 Ofgem study of the state of the GB energy supply markets(the ‘Probe’), we committed to continually monitoring price changes to helpinterested parties better understand the relationship between retail prices andwholesale costs. This commitment formed the basis of the current SMI, which weupdate monthly on our website.1.4.The Probe was concerned with the functioning of competition in GB electricityand gas retail supply markets for domestic and small non-domestic customers. Oneof its aims was to investigate the relationship between domestic retail bills andwholesale energy prices. This was partly in response to concerns that falls inwholesale energy prices were not translating into lower retail prices as quickly asincreases were leading to higher retail prices.1.5. The Probe concluded that there is a long-run relationship between both partsof the market. We found clear evidence of a lag between wholesale and retail pricechanges which is largely a result of suppliers’ hedging their wholesale marketexposures, and to a lesser degree the effect of administrative lags.Stakeholder feedback1.6. We are keen to ensure that stakeholders understand how we construct theSMI. We are also keen to hear your views on how we could improve our1
Supply Market Indicatormethodology. This will help us ensure that the SMI gives the best estimate of trendsin costs and margins in the future.1.7. We do not propose to hold a formal consultation on this but please contact uswith any suggestions at SMI@ofgem.gov.uk.
Supply Market Indicator2. Interpreting the SMIChapter SummaryThis chapter provides guidance on how to interpret the SMI. It also outlines how theSMI relates to our wider market monitoring work including the ConsolidatedSegmental Statements (CSS) and Ofgem’s State of the Market Report.How to interpret the SMI2.1. The SMI provides a forward-looking estimate of trends in energy costs andmargins over the following 12 months. Using the current average bill, the SMI showshow the individual cost components of the bill are expected to change over time.2.2. The SMI uses a mixture of publicly available and verifiable data and informedassumptions to provide an estimate of future trends in costs. As such, the SMIshould be viewed as an estimate rather than as a factual report (as is the case withall forecasts). In energy, several factors are inherently uncertain including thewholesale price of energy, which is sensitive to a variety of demand-side and supplyside factors. It is therefore impossible for us to have certainty over these factors andthe SMI should be interpreted with this in mind.2.3. The SMI is not based on contemporaneous information from the largesuppliers such as current hedging strategies, actual and forecast energy consumptionand suppliers’ operating costs. The SMI also does not try to estimate suppliers’financing costs and corporate tax liabilities, which would imply knowing details oftheir capital structure. Therefore the SMI cannot and does not seek to provide aforecast of company profits. A reliable indicator of profitability (before interestpayments and taxes) is provided in the individual companies’ ConsolidatedSegmental Statements (CSS). These present the required information in historicalform. Only by looking back can we accurately observe a company’s profitability in agiven time period.3
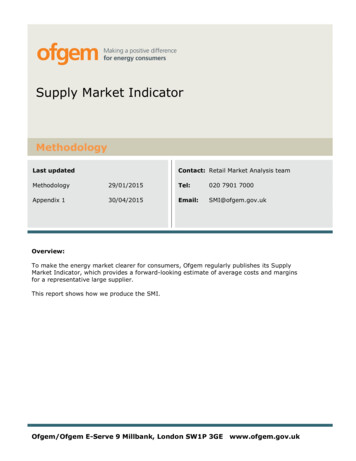
Supply Market IndicatorInterpretation exampleFigure 2.1: SMI example chart2.4. Every month, the SMI shows the annual average bill, costs and pre-tax marginper customer for the following 12 months starting that month. For example, Bobsigns a 12-month fixed price contract in January 2013. Bob has average gas andelectricity consumption and the contract he is on is a blended tariff based on theweighted average of tariffs open to customers.12.5. In this example, Bob is expected to pay a total of 1,304 over the coming 12months. His supplier (whose costs are similar to the average of the large suppliers)will likely incur around 1,246 in costs supplying Bob with electricity and gas. Thedifference between Bob’s bill and the supplier’s costs is the supplier’s pre-tax margin.The supplier will have to pay corporate taxes to the government and interestpayments with part of that money.2.6. The implied annual pre-tax margin that the representative supplier wouldmake per customer is 59 in the above example. As noted above, this should not beinterpreted as a forecast of suppliers’ profitability.1No customer therefore will be on exactly the same tariff as is described in the SMI.
Supply Market IndicatorLinks with our wider market monitoringConsolidated Segmental Statements2.7. As noted above, the SMI provides a frequently updated, forward-lookingestimate of suppliers’ costs and margins and does not seek to provide estimates ofcompanies’ profits, either collectively or individually.2.8. Detailed information on individual companies’ revenues, costs and earningsbefore interest and taxes (EBIT) in both their generation and supply arms is availableon a backward-looking basis in their CSS. We require the large vertically-integratedcompanies to produce these annually, based on audited figures.2.9. In order to make things simpler and minimise confusion, we have taken stepsto align the SMI and the CSS. To do so, we: disaggregate costs into consistent categories for both the SMI and theCSS.2use CSS data, where available, for those components in the SMI that arebased on historical figures, such as operating costs and depreciation andamortisation charges.base the SMI on average prices across all tariffs by the large suppliers,rather than standard tariffs only.add VAT in the CSS revenue when comparing the two in the SMI outputs.This because the SMI includes VAT; however the CSS does not. In the SMIrevenue, VAT is implicitly included as part of the bill so we explicitly stateit as a cost in the breakdown. The revenue reported in the CSS is after thecompanies pay VAT to HM Revenue and Customs (ie lower than the SMIrevenue based on advertised bills) and therefore isn’t included as a costestimate unbilled volumes based on reconciling latest CSS averagerevenue and the corresponding SMI revenue after accounting for VAT, theWarm Home Discount and the proportion of CSS revenue attributable tounrestricted meter tariffs.2.10. However, when comparing the CSS and SMI there are still some importantdifferences to note, including the following: The CSS is based on actual historic consumption whereas the SMI isgenerated using our assumption of annual consumption. Actualconsumption, particularly of gas, can vary quite significantly dependingon, for example, the weather.The SMI revenue calculation only includes tariffs offered to customers withunrestricted meters. It does not include tariffs such as Economy 7/10 anddynamic teleswitch (DTS) metered customers.2When we compare the average bills in the CSS and SMI we add VAT to CSS revenue to makethem comparable.5
Supply Market Indicator The SMI revenue also does not include other sources of potential revenuesuch as late payment fees.Wider monitoring work2.11. The SMI is part of wider Ofgem work in monitoring energy markets. Thisincludes analysis for our annual State of the Market Report.2.12. The report puts prices, costs and profits into the wider context of how themarket is working. First published in March 2014, the report uses historical data froma range of sources, including the CSS, to assess how well energy markets have beenworking for consumers.
Supply Market Indicator3. Data and methodologyChapter SummaryThis chapter describes the inputs, methodology and assumptions used to generatethe SMI. Appendix 1 includes a table listing the data sources for each inputand assumption where publicly available. This table will be updated on a regularbasis as and when new input data becomes available.How is the SMI constructed?3.1. The SMI shows, on a per customer basis, the average revenue (or averagecustomer bill), average supplier costs and the average pre-tax margin for arepresentative large supplier. The SMI is reported for electricity, gas and dual fuelcustomers. It should be noted that the dual fuel bill is not simply the sum of gas andelectricity bills as dual fuel discounts are taken into consideration. 33.2. Figure 3.1 displays the components of the average customer bill and lists theindividual costs included in each.Figure 3.1: Total cost and margin components of customer bills3Approximately 55% of the large suppliers’ customers are dual fuel customers.7
Supply Market Indicator3.3. All figures in the SMI estimates are presented in nominal terms. However, weadjust the historical actual data (sourced from the CSS) for inflation.Domestic consumption and customer numbers3.4. For the SMI, supplier revenues and costs are estimated based on eitheraverage domestic consumption of gas and electricity or, where the costs do not varywith consumption, customer numbers. In summary: Consumption - We estimate future consumption by applying a demandforecast to the latest average mean weather-corrected consumption values.Please see appendix 1 for the latest data we use in the SMI model. Thesefigures are used throughout the SMI wherever consumption figures arerequired for cost and bill calculations. Customer numbers - We use the number of gas, electricity and dual-fuelcustomers of the large suppliers for the respective SMI calculations.3.5. The remainder of this chapter describes the inputs, methodology andassumptions that we use for the revenue, cost and pre-tax margin components ofthe SMI.Revenue3.6. The average revenue per customer in the SMI is an estimate of the averageannual bill paid by customers in Great Britain. We do not forecast bills, but ratheruse suppliers’ prices available at the time of each update.Inputs3.7.The key inputs required to calculate average customer bills include: Annual bills for all tariffs in the market - including tariffs that are open tonew customers and those that are not. Customer numbers for each tariff and payment method.4Methodology and assumptions3.8. The annual customer bills across all tariffs are calculated based on annualdomestic consumption. We then calculate the average annual customer bill weightedby suppliers’ market shares and payment method. Previously, the SMI only includeda weighted average of the large suppliers’ standard tariffs.4i.e. how customers pay for the energy such as direct debit, standard credit or pre-payment
Supply Market Indicator3.9.We include the following assumptions in calculating annual customer bills:1. Tariff weightings – We weight the average tariff according to the splitbetween the number of customers on a standard tariff and all other tariffs inthe market.5 62. Unrestricted meters – We only include tariffs offered to customers withunrestricted electricity meters. For example, we do not include Economy 7tariffs or tariffs offered to customers with Dynamic Teleswitch (DTS) metersor similar. There are around 5 million meters in Great Britain which allow forseparate recording of off-peak consumption (approximately 18% of allelectricity customers).73. Recent price changes - Any publically-announced price changes within thenext 12 months are incorporated into the SMI from the point at which theybecome effective.4. Government electricity bill rebate- the rebate aims to reduce the generalcost of environmental and social obligations within customer bills. The final billvalue we report in the SMI accounts for this by subtracting the rebate valuefrom our estimated average annual domestic bill.Costs3.10. The following subsections describe how we estimate each of the costcomponents in the SMI.12-month forward-
Supply Market Indicator 3 2. Interpreting the SMI Chapter Summary This chapter provides guidance on how to interpret the SMI. It also outlines how the SMI relates to our wider market monitoring work including the Consolidated Segmental Statements (CSS) and Ofgem’s State of the Market Report. How to interpret the SMI 2.1. The SMI provides a forward-looking estimate of trends in energy costs and