Transcription
Ship detection using polarimetricRadarSat-2 data and multi-dimensionalcoherent Time-Frequency analysisCanbin Hu1, Laurent Ferro-Famil1, Camilla Brekke2, Stian Normann Anfinsen21 University of Rennes 1, IETR, SAPHIR team, France2 University of Tromsø, Department of Physics and Technology, NorwayJan. 2013
Outline Principle of TF analysisTF decompositionTF SAR signal modelPolarimetric coherence TF indicator Application to ship detectionShip in open seaShip in sea ice Conclusion
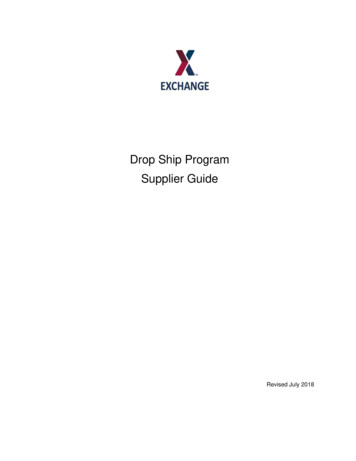
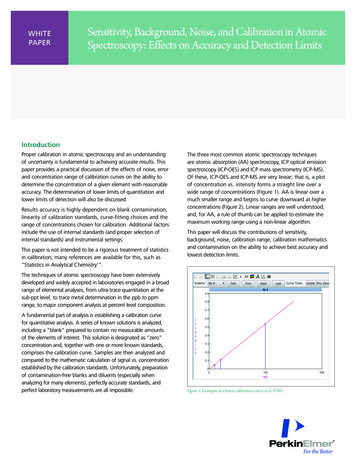
Where is the ship?ABC
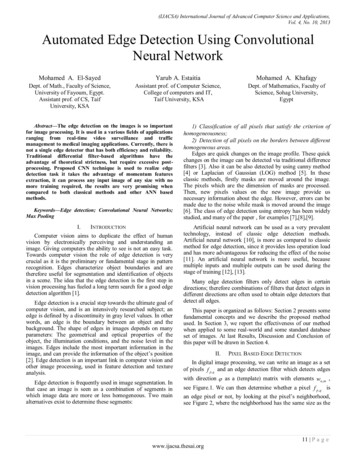
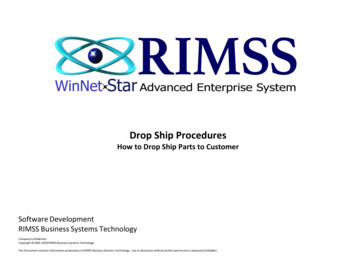
Time-Frequency decompositionLocal spectral estimationSAR imageSpectrum azT-F SAR imageLocal spectrum rg 0 az0 rgAzimuthVsarAngular behaviorRangeH o RFrequency sensitivityYoORX
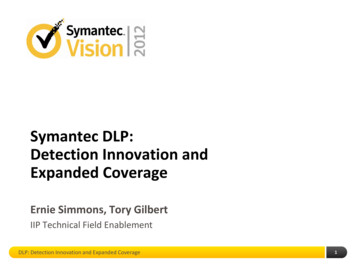
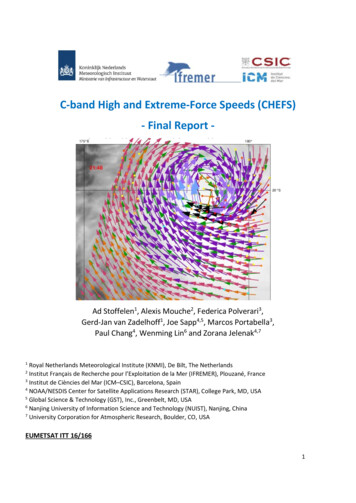
TF varying SAR signal modelVarying T-F signal model: varying composite signal: quasi-deterministic, slowly varying component highly coherent: random component, potentially non-stationary incoherent scatteringcoherence T-F behaviorsOceanNatural islandIcebergIcebreakerCargolowhighcoherence(Ref: L. Ferro-Famil & E. Pottier, “Urban area remote sensing from L-band PolSAR data using TimeFrequency techniques”, in Proc. Urban Remote Sens. Joint Event, Apri. 2007, Paris)lowhigh
Full-Pol TF coherence analysisFull-pol response sampled at R spectral positions:whereT-F coherence behavior characterizationTF-Pol coherence matix off-diagonal terms:
Coherent pixel detectionHypothesis testingUncorrelated PolSAR responses over R spectral positionsMaximum Likelihood test- Decide- Thresholdif
Coherent pixel detectionAnother representation: polarimetric whitening processCoherence informationTF-Pol coherence
Applied data sets Radarsat-2 SAR data in fine quad-pol mode Two groups:1) Ship in open sea(harbor, islands & artefact)2) Ship in sea ice(ice cracks, ridges, ice-infested water etc.)
Ships in the open sea of San Francisco areaRangeOptical image Spectral locations:4Pauli imageTF-Pol coherence Direction: 2 in Azimuth, 2 in Range
ship vs. islandOptical imagePauli imageTF-Pol coherenceDiscriminating ships from small natural island
Ships in the open sea of Vancouver areaRange
ship vs. ‘ghosts’Pauliimage H TF Pol
Ships in sea ice test site:near Savalbard archipelagoNorway test time:11 April 2011 (Red)12 April 2011 (Yellow)13 April 2011 (Green)
Verified ship in the sea iceNorwegian coast guardicebreaker and offshorepatrol vessel Name:K/V Svalbard Length: 103.7 m Breadth: 19.1 m
11 April 2011RangePauli basis
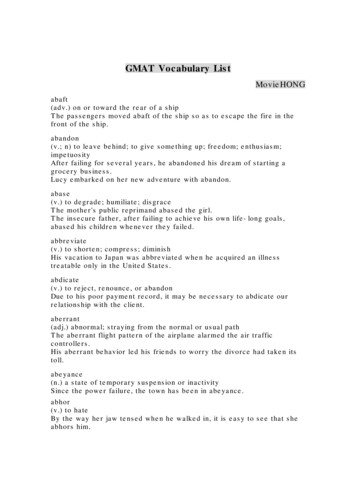
11 April 2011 Ship vs. IceRangePauli Spectral locations:4TF coherent (threshold 0.79) Direction: 2 in Azimuth, 2 in Range
11 April 2011 Ship vs. IcePauliimageH TF Pol Spectral locations:4 Direction:2 in Azimuth,2 in Range
12 April 2011RangePauli basis
12 April 2011 Ship vs. Ice Spectral locations:4 Direction: 2 in Azimuth, 2 in Range
13 April 2011RangePauli basis
13 April 2011 Ship vs. Ice Spectral locations:4 Direction: 2 in Azimuth, 2 in Range
Where is the ship?A
11 April 2011 Ship vs. IceA
Conclusion T-F coherence analysis A multi-data set, polarimetrically adaptive, detector Coherent behavior : (3R 3R) TF normalized coherence matrix a novel detector: TF-Pol coherence indicator TF Pol Application to ship detection Ship vs. Small Natural island Ship vs. Artefact (‘Ghosts’) Ship vs. Sea ice Enhance contrast efficiently beween ships and background When full-res polarisation does not perform well (high entropy) In very difficult environements (low Signal to Clutter Ratio ) Ongoing and future work using dual polarization data for ship detection Improved statistical T-F descriptors
RadarSat-2 data and multi-dimensional coherent Time-Frequency analysis Canbin Hu 1, Laurent Ferro . IETR, SAPHIR team, France 2 University of Tromsø, Department of Physics and Technology, Norway Jan. 2013. Outline Principle of TF analysis TF decomposition TF SAR signal model Polarimetric coherence TF indicator Application to ship detection