Transcription
International Journal of Innovative Studies in Aquatic Biology and Fisheries (IJISABF)Volume 2, Issue 1, 2016, PP 14-24ISSN 2454-7662 (Print) & ISSN 2454-7670 (Online)www.arcjournals.orgIn-Vitro Assessment of Plankton Production Using FishHydrolysate1B.B. Sahu, 1B.C. Mohapatra, 1N.K. Barik, 1H. Sahu, 1P. Sahoo, 2N.C. Biswal, 2P.K.Mohanty, 1U.L. Mohanty, 1S. K. Mahanta, 1P. Jayasankar1ICAR-Central Institute of Freshwater AquacultureKausalyaganga, Bhubaneswar – 751002, Odisha, India2Utkal University, Vani vihar, Bhubaneswar-751007, Odisha, Indiabinodbsahu@gmail.comAbstract: An experiment was conducted in glass jars for four weeks to assess the efficiency of fish hydrolysate(FH) of 0.01, 0.05, 0.25, 1.25 and 6.25 ml L-1 concentration on the production and growth of primaryproducers. T-3 (0.25 ml L-1) dose of FH has been found to maintain the water quality parameter to be withinoptimum level. And it ranged from pH (6.4-7.7), conductivity (312.0–355.3 µs/cm), alkalinity (51.3-86.0 mg/l),Hardness (38-86 mg/l), CO2 (2.0-6.7 mg/l), Ammonia (0-0.3mg/l), Nitrite (0-0.1 mg/l). Around 31 genre ofphytoplankton belonging to Chlorophyceae (9), bacillarioyophyceae (8), cyanophyceae (7) and zooplankton (7)were identified. The results show that FH treatment 0.25 ml L-1in T-3 enhances the phytoplankton andzooplankton production than other jar waters. So it has been recommended for application in aquacultureponds as a biofertilizer for the well growth of the plankton species.Keywords: Fish hydrolysate, primary productivity, aquaculture pond fertilization, biofertilizer.1. INTRODUCTIONIn aquaculture the maintenance of good water quality is of primary importance, so that excellentculture environment, adequate food for optimal fish yield, appraisal of the eutrophic situation andincrease in plankton population may be achieved. (Sipauba-Tavares et al, 2006; Sipauba-Tavares2011).For Aquaculture pond productivity both organic and inorganic fertilizers are used. Inorganic fertilizersmainly increases the primary production asphytoplankton and organic fertilizers increases theabundance growth of zooplankton, insects larval and other forms of fish food organisms(Jhingran1983; Olah et al., 1986). Organic wastes contain compounds are capable of promoting plant growth(Day AD and Katterman 1992).Organic fertilizers are often used to promote desirable zooplanktonspecies. Organic fertilizers may be animal manures and oil cakes. Organic fertilizers should have lesscarbon; nitrogen ratios and have fine particular sizes to allow rapid decomposition (Geiger andTurner, 1990). The organic fertilizers (manures) poultry dropping and cowdung manures arefrequently used for the growth of aquatic microphytes (Phyto-zoo plankton) which in turn used as fishfood and to regulate water quality characteristics of fish ponds. (Mirza et al., 1990)Cattle manures and poultry droppings upon addition to fish ponds start decomposition and reductionof dissolved oxygen in fish ponds and responsible for mass mortality of micro-organisms producesunpleasant smell and causes mortality of fish and aquatic organisms (Begum et al., 2012). Basalapplication of cow dung 10000 kg/ha and 1000 kg/ha every month in nursery ponds found to beacceptable for better water quality management, fish growth and health parameters.Phytoplankton is the primary producer, which provides food and oxygen for other organisms.Zooplankton comprising of four major groups, viz., Cladocerans, Copepods, Rotrifers and nauplii arethe preferred food materials for the cultured fish species. Zooplankton important to larval fish areclassified as rotrifers, cladocerans or copepods. The ability of rotifers and cladocerans to reproduceasexually enables them to react quickly to unfavorable and favorable environmental conditions.(Pennak, 1989)In larviculture information regarding relative status of plankton communities gives insight into waterquality parameters and the possible success or failure of culture system. Best management practices ARCPage 14
B.B. Sahu et al.are to maintain the high densities of desirable zooplankton species in culture pond until the fish wereable to consume commercial feed. (Morris and Mischke, 1999)There is a direct relationship between nutrient and phytoplankton density and species diversity. It wasobserved that in low temperature low abundance of phytoplankton and nitrate concentration, althoughphosphate exhibited an inverse relationship with the growth rate of planktonic organisms. Recentstudies have suggested phosphorous as the most limiting nutrient with regard to phytoplankton(Moutin et.al, 2002; Chowduryet.al, 2007).The plankton community on which the whole aquatic population depends, is largely affected by aninteraction of number of limiting factors such as low dissolved oxygen, moderatesulphate, nitrate,phosphate and other factors. (Kumar and Omen, 2009). The nitrogen and phosphorous plays dominantrole in controlling the growth and abundance on phytoplankton and freshwater angiosperms. (Heckyand Kilham 1988).Vermi-compost enriched with biofertilzers as successful organic manure for fish growth and ecofriendly product for aquaculture production (Senthil Kumar et al., 2014). Recently acid hydrolysis offish wastes has been studied to produce low cost nutrients for the production of lactic acid and lowcost protein sources have been produced by ensiling hydrolyzed fish viscera to obtain a suitablemedium for lactic acid bacteria. (Gao et.al, 2006)Fish wastes are also utilized for the fish meal production however this process is costly and heatrequired for drying makes the fish meal less digestible (Yamamato, 1960). According to Afonoso andBorquez, (2002) fermented broth of fish wastes could be a valuable recourses for agriculture. To dateonly a few reports on reutilization of biodegraded waste products as liquid fertilizers are available. Byusing some microorganisms extracted from earthworm viscera, the fish wastes were converted intoliquid fertilizers (Kim et al 2010)Both addition of formic acid to cold offal and fermentation of lactic acid bacteria are effectivemethods of ensiling this material. Peat extracts with relatively high carbohydrate content were foundto be a satisfactory source of carbohydrates for the fermentation of lactic acid bacteria in cod offalsilage. However, peat extracts with a relatively low pH were found to be unsatisfactory as a directsource of acid for ensiling (Martin and Bemiste,1994). The underutilized fish processing waste costeffectively transformed into fish hydrolysate using a natural fermentation process. Their value hasbeen increased by using them as liquid biofertilizer, feed supplement and bio-organic manures. Thevalues have been reported to be nitrogen-2.95%, phosphorous-1.98%, potassium 0.65%, sulphur1.52%, boron-10.4ppm, calcium-2.24%, magnesium-1.75%. (Sahu et al., 2014)2. MATERIALS AND METHOD2.1. Study AreaResearch was carried out at ICAR- Central Institute of Freshwater Aquaculture (20 011’10.7”N,85051’21.7’’E) at Bhubaneswar, Odisha, India in the month of August to October, 2014. Theexperiment was conducted in 25L glass jars filled with 20L filtered pond water filtered with mesh size125µ. Each glass jar was inoculated with fish hydrolysate (FH) (Sahu et al., 2014) at differentconcentrations in triplicate (Table 1, 2). The culture setup was as follows (A control and five doses intriplicate):1. Control- Pond water alone2. T1- 0.01 ml L-13. T2- 0.05 ml L-14. T3- 0.25 ml L-15. T4- 1.25 ml L-16. T5- 6.25 ml L-1All the culture jars were aerated till the end of this experiment (28 days). Water quality such astemperature, pH, conductivity, CO2, Alkalinity, Hardness, Ammonia, Nitrate and Nitrite weremeasured at weekly intervals by following the standard method. (APHA, 1989)International Journal of Innovative Studies in Aquatic Biology and Fisheries (IJISABF)Page 15
In-Vitro Assessment of Plankton Production Using Fish HydrolysateTable I. Chemical Composition of fish hydrolysate from processing wasteParameterTotal Nitrogen (%)Total Phosphorous (%)Total Potassium (%)Fe (ppm)Mn (ppm)Cu (ppm)Zn (ppm)Composition1.51 0.230.52 0.110.40 0.15240.5 32.26.2 0.33.5 0.51.8 0.3Value represents percentage of dry matterValue represents mean SE (n 3)Table II. Chemical Properties of fish hydrolysate as bio fertilizerParameterpHmvOrganic Carbon (%)Available nitrogen (mg) in 100mLAvailable Phosphorus (mg) in 100mLC/N ratioComposition4.25 0.2162.0 11.02.2 0.2392 0.2110 0.51.52.2. Preservation of Plankton SamplesPlankton species were collected in a weekly basis from each experimental jars. The samples werefixed with 2 ml of Lugols iodine (1:1000) for sedimentation and preservation of planktons. After 2-3days the supernatant was carefully siphoned out and the volume was made upto 50 ml. theconcentrated preserved plankton samples were analysed on a Sedgewick-Rafter counting cell (SRCell) under compound microscope with digital photography (APHA, 1989).2.3. Enumeration and Identification of PlanktonFor each sample, 1 ml of sub-sample was transferred to the cell. From 10 randomly selected cell,square of the planktonic organisms were enumerated. The plankton was further identified upto genuslevel following the guidelines of (Bellinger, 1992; Needham and Needham 1972). The planktonabundance in the original volume was then computed using the formula by Stirling (1985).N 𝐴 𝑥 100 𝑥 𝐶𝑉𝑥𝐹𝑋𝐿Where,N Number of plankton cells or units per litre of sampleA Total number of plankton countedC Volume of final concentrate of the sample in mlV Volume of a field in cubic mmF Number of field countedL Volume of original water in Litre3. RESULTS AND DISCUSSION3.1. Chlorophyll ProductionTable-3 shows the growth of chlorophyll in the fish hydrolysate treated pond water. The maximumcell density was observed on 0.25 ml L-1 concentration. Highest chlorophyll a concentration wasobserved which showed a gradual increase as the time elapsed. Lower and higher concentrations offish hydrolysate did not produce effective result in chlorophyll production. Fish hydrolysate 0.25 mlL-1 dose increased the chlorophyll-a concentration ranged between 0.37-2.67 µg L-1, a gradualincrease was noted between 0-28 days. Similar results have been reported by Sipauba- Tavares et al.,(2006).International Journal of Innovative Studies in Aquatic Biology and Fisheries (IJISABF)Page 16
B.B. Sahu et al.Table III. Generic status of plankton available in fish hydrolysate treated pond RotifersMean values of some water quality parameters are presented in Table 4. The presence of high amountof ammonia, carbon dioxide indicates a eutrophic nature, pH values in all the fish hydrolysatetreatment ranged from 6.4 to 8.2. In heavily dosed fish hydrolysate jars, pH values increased up to 7.8to 8.2 indicating water quality deterioration. In 0.25 ml L-1 fish hydrolysate treatment, pH wasmaintained at 7.5 to 7.7 indicating optimum value for vigorous plankton production.Table IV. Percentile value of abundance of planktons during different periods of 23242526272829303132333435363738Names of the frequently availableplankton species in percentageGreen aBlue – Green aMerismopediaOscillatoriaDesmids onMicrasteriasNetriumSpirotaeniaDiatoms fers0 days07 days14 days21 days28 ional Journal of Innovative Studies in Aquatic Biology and Fisheries (IJISABF)Page 17
In-Vitro Assessment of Plankton Production Using Fish Hydrolysate3.2. Generic Status of Planktons Available in Fish Hydrolysate Treated JarsGeneric plankton abundance in the experimental jars comprised of five groups (Table 5) consisting of38 genera. The total planktonic organisms mainly composed of four groups of phytoplankton and onegroup of zooplankton. Some 31 genera of phytoplankton belonging to chlorophyce (9) cyanophyce (7)bacillariophyceae (8). Seven genera of zooplanktons were also identified.Table V. Mean values of some Physico-chemical parameters in fish hydrolysate treated experimental jar 28Conductivity (µs )7142128T–1(0.01ml 383.3T–2(0.05 ml 82.7T–3(0.25 ml 686.7T–4(1.25 ml 90.0156.3349.061.358.056 .055.354.741.338.744.7122.0141.3T–5(6.25 ml 6.090.088.03.3. Relative Abundance of Phytoplankton and Zooplankton in FH Treated JarsThe main phytoplankton groups recorded were Chlorophyce, Bacillariophyce (diatoms) cyanophyceand Desmidiace in the order of merit in 0.25 ml L-1 fish hydrolysate treated jars (Table 6, Figure 1).The percentage composition of each phytoplankton group was as follows (Table 7). In chlorophycegroups highest percentage of phytoplankton recorded were cladophora (93.3), crucigenia (86.6) andBotryococcus (80.6) respectively on 28 days of inoculation.Table VI. Mean values of some Physico-chemical parameters in fish hydrolysate treated experimental jar waterParametersCO2 (mg/L)Days07142128Ammonia0(mg/L)7142128Nitrate (mg/L) 07142128Nitrite (mg/L) 07142128T–1(0.01 ml .50.10.10.10.1T–2(0.05 ml 0.10.1T–3(0.25 ml .10.10.1T–4(1.25 ml .00.10.10.10.1T–5(6.25 ml 0.00.00.00.00.0International Journal of Innovative Studies in Aquatic Biology and Fisheries 00.50.50.50.10.0Page 18
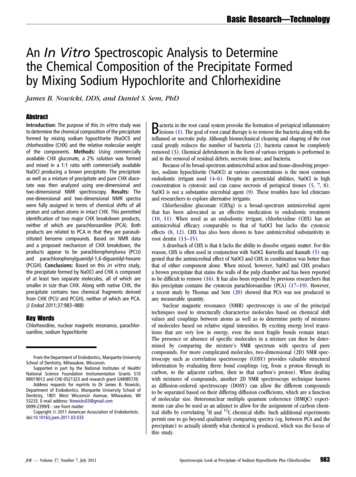
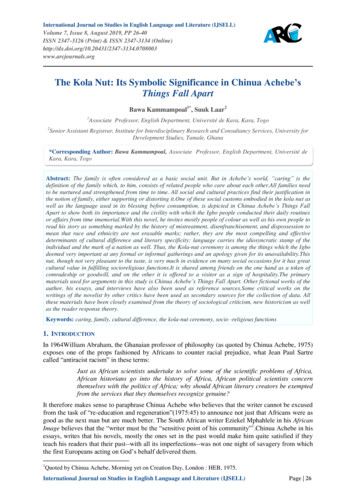
B.B. Sahu et al.Fig I. Total abundance of generic phytoplankton and zooplankton species in hydrolysate treated jar waterTable VII. Mean values of chlorophyll (µgm/L) in various treatmentsTank No. Conc. (ml 7142128Chlorophyll a0.37 0.010.36 0.010.73 0.030.77 0.040.86 0.020.37 0.010.36 0.030.97 0.031.57 0.031.85 0.030.37 0.010.38 0.021.86 0.042.64 0.042.67 0.030.37 0.010.41 0.021.04 0.051.85 0.030.63 0.010.37 0.010.52 0.050.67 0.010.84 0.030.66 0.030.37 0.011.14 0.060.42 0.030.46 0.020.54 0.07Chlorophyll b0.44 0.020.59 0.020.64 0.070.35 0.030.51 0.040.44 0.020.56 0.030.63 0.021.45 0.021.70 0.060.44 0.020.57 0.040.87 0.031.47 0.011.65 0.040.44 0.020.54 0.030.77 0.011.97 0.020.82 0.020.44 0.020.63 0.020.62 0.020.54 0.050.54 0.030.44 0.020.47 0.040.53 0.020.50 0.030.68 0.03Chlorophyll c0.93 0.021.35 0.061.77 0.084.92 0.084.24 0.120.93 0.021.37 0.031.78 0.021.39 0.021.48 0.020.93 0.021.39 0.021.80 0.022.51 0.392.08 0.020.93 0.021.36 0.011.17 0.032.08 0.051.62 0.020.93 0.021.60 0.061.11 0.021.53 0.020.94 0.040.93 0.022.37 0.051.36 0.084.06 0.053.56 0.41Total Chlorophyll0.30 0.030.40 0.030.55 0.031.04 0.070.97 0.040.30 0.030.40 0.030.58 0.040.76 0.050.87 0.050.3 0.030.41 0.020.79 0.050.79 0.051.14 0.040.3 0.020.52 0.020.52 0.031.02 0.080.53 0.030.3 0.030.48 0.050.41 0.020.5 0.040.37 0.021.11 0.060.30 0.030.69 0.040.87 0.060.83 0.10Table VIII. Total abundance of generic phytoplankton and zooplankton species in hydrolysate treated jar waterSl. No. of aeBacillariophyceaeZooplanktons0 day7 day14 day21 day28 day319.7 x 103126.5 x 10399.8 x 103173.1 x 103199.8 x 103310.1 x 103144.1 x 103113.1 x 103261.8 x 103253.1 x 103486.5 x 103165.5 x 103163.1 x 103253.1 x 103273.2 x 103583.4 x 103226.5 x 103177.8 x 103319.8 x 103366.5 x 103557.7 x 103233.8 x 103206.5 x 103352.3 x 103426.4 x 103International Journal of Innovative Studies in Aquatic Biology and Fisheries (IJISABF)Page 19
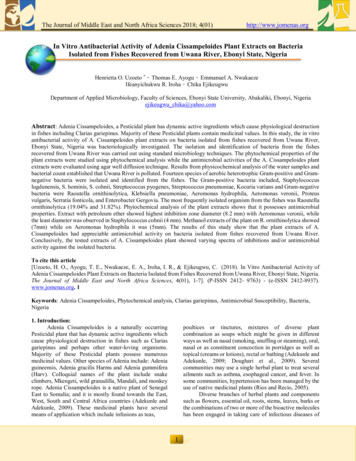
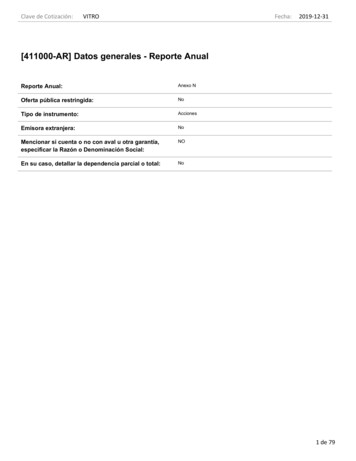
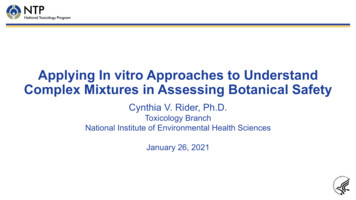
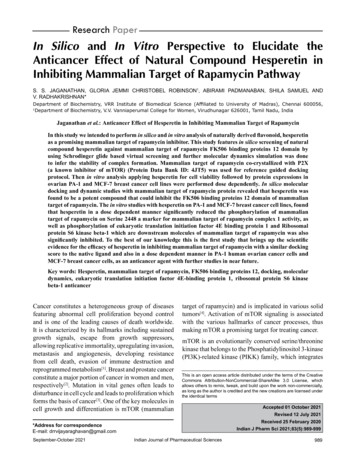
In-Vitro Assessment of Plankton Production Using Fish HydrolysateIn Bacillariophyceae, Navicula (100%) Melosira (73.3%) Diatoms and Synedra (40%). InDesmidaceae group Gonatozygon (53.3%) and Closterium (40%) was recorded. Cyanophyce groupsRivularia (60%) and Merismopedia (46.6%) were recorded. Zooplankton groups had Cyclops (100%),Copepods (93.3%) and Cypridopsis (80%) were recorded.Optimal fertilization rate is the amount of organic matter that may be cost effective, eco-friendly andutilized in a pond ecosystem without any harmful effect on water quality and fish growth.Phytoplankton requires both macronutrients and micronutrients for their growth. Fish hydrolysate isan organic fertilizer consisting of macronutrients, micronutrients and secondary elements in a naturalproportion in liquid biofertilizer. The observed highest number of phytoplankton and zooplankton inT-3 showed that micronutrients and macronutrients at a proper dose are very much essential. (Boyd,1979).Fig IIa. Quality zooplankton & phytoplankton production in 0.25 ml L-1 FH treated T-3 glass jarsFig IIb. Quality zooplankton & phytoplankton production in 0.25 ml L-1 FH treated T-3 glass jarsInternational Journal of Innovative Studies in Aquatic Biology and Fisheries (IJISABF)Page 20
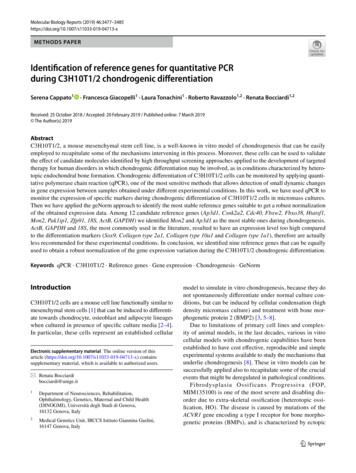
B.B. Sahu et al.Fig IIc. Quality zooplankton & phytoplankton production in 0.25 ml L-1 FH treated T-3 glass jars3.4. Physicochemical Parameters of Water QualityThe water quality parameters such as temperature, pH, alkalinity, CO 2, ammonia, nitrate and nitriteremained congenial for fish culture point of view in 0.25 ml L-1 fish hydrolysate treated jars. Boyd(1979) reported similar results in freshwater aquaculture ponds. The physicochemical condition waswithin the suitable range and biological production was higher in T-3, where 0.25 ml L-1 fishhydrolysate was used as organic fertilizer. Therefore, it may be recommended for higher productivityof a water body. Total phytoplankton population growth in hydrolysate treated water than the controlpond water due to micronutrients nitrogen, phosphorus and potassium and trace elements present inthe fish hydrolysate. A significant amount of iron (Fe) present in the fish hydrolysate. Iron is anespecially essential element for the growth of phytoplankton and its deficiency is well known tosuppress primary productivity in both freshwater and marine ecosystem (Naito et al., 2006). Iron hasthe potential to control the growth and composition of phytoplankton communities. (Noiri et al., 2005)3.5. Generic Status of Planktons Available in Fish Hydrolysate Treated JarsProduction of an unpredictable mixture of algal is greatly covered by application of fish hydrolysate0.25 ml L-1 (T-3) throughout the experimental pond. Phytoplanton require both macronutrients andmicronutrients for their growth. Fish hydrolysate contains both macro and micronutrients in abalanced form. It contains iron, manganese, copper and zinc as micronutrients N:P:K::1.5:0.5:0.4 asmacronutrients. (Davies et al., 2006)Generic plankton abundance in the experiment with T-3 doses comprised of five groups, 4 groups ofphytoplankton and 1 group of zooplankton, consisting of 31 genera. Some 31 genera of phytoplanktonbelonging to chlorophyceae (9) Cyanophyceae (7) Bacillariophyce (8). Seven genera of zooplanktonwere also identified. The Chlorophyceae group was the most representative, followed bybacillariophyceae and cyanophyceae. The zooplankton community consisted of cladocerans, copepodsand rotifers and they are common or constant throughout the experiment. Planktonic organisms suchas green algal (chlorophyta) copepod-calanoida were more abundant in organic fertilized fish ponds.Rotifers and chaoborus species densities were increased when inorganic fertilizers were used in theaquaculture ponds (Sipauba-Tavares et al., 2006)3.6. Relative Abundance of Phytoplankton and Zooplankton in FH Treated JarsIn 0.25 ml L-1 FH treated jars phytoplankton groups chlorophyceae; bacillariophyceae (diatoms)cyanophyceae and Desmidaceae were recorded in order of merit. Numerical density of phytoplanktonimplies that green algae occupied the first predominant pair and followed by the diatoms. Higherconcentration of zooplankton organisms like rotifers and the positive indicators from fish rearingpoint of view. (Ayyappan et al., 1990; Mageed and Konsowa, 2002)International Journal of Innovative Studies in Aquatic Biology and Fisheries (IJISABF)Page 21
In-Vitro Assessment of Plankton Production Using Fish HydrolysateRotifers have shortest life span (12 days) and can reach their peak reproduction level in about 3-5days. Cladocerans and copepod have similar lifespan of approximately 50 days. But Cladoceransrequire 14-15 days to reach peak reproduction capacity. However, copepods require 24 days. (Allan,1976)Application of FH at 0.25 ml L-1 dose had produced Cyclops (100%) copepods (93.3%) cypridopsis(80%) in the experimental period. Similar results have been reported in zooplankton production byusing biofertilizer enriched vermin-compost on production and growth of primary product.4. CONCLUSIONFrom the present study it is concluded that water quality parameters were found within the optimumlimit for primary production and freshwater aquaculture. The highest chlorophyll and planktoncomposition (phytoplankton and zooplanktons) was observed in T-3 (0.25 ml L-1) fish hydrolysatetreatment and lowest value was recorded in control. We strongly recommended fish hydrolysate at theabove concentration FH biofertilizer as successful organic manure an eco-friendly product foraquaculture practices. The dose has been calculated to be 20 L Ac-1 m water body in 4 split doses with15 days interval for aquaculture practices.ACKNOWLEDGEMENTThe authors are thankful to the Director, ICAR-CIFA, Kausalyaganga, Bhubaneswar for providing thefacilities for conducting the research and to Sidhartha mahali for photography and documentationassiatance.REFERENCES[1] Afonso MD and Bórquez R. 2002. Review of the treatment of seafood processing wastewatersand recovery of proteins therein by membrane separation processes: prospects of theultrafiltration of wastewaters from the fish meal industry. Desalination 142, 29-45.[2] Allan, J.D. (1976) Life history patterns in zooplankton. Am. Nat., 110, pp. 165—180.[3] APHA 1989. Standard methods for examination of water and waste water, 12th edn.AmericanPublic Health Association, Washington D.C., 1452 pp[4] Ayyappan, S., Pandey, B. K. and Tripathi, S. D. (1990) Nutritive quality of microbialcommunities as feed components in experimental carp culture. Indian J. Exp. Biol., 28(10), pp.977--980.[5] Begum, H., Najejo, N.T., Achakzai, G.D. and Ghotto, M. A. (2012) Impact of indiscriminate useof cow dung on the physico-chemical parameters of nursery ponds of the Nursery Ponds OfChilya Fish Hatchery District Thatta, Sindh. Sindh Univ. Res. Jour. (Sci. Ser.), 44(3), pp. 355-360.[6] Bellinger, E.G. (1992) A key to common algae, The Institute of water and EnvironmentalManagement, London, pp. 138.[7] Boyd CE (1979). Water quality in warm water fish ponds, Auburn University Agricultural,Experiment Station, Alabama, U.S.A, pp. 59.[8] Chowdhury, MMR., Mondol, MRK. And Sarkar, C. (2007) Seasonal variation of planktonpopulation of Borobilabeel in Rangpur district. University Journal of Zoology, RajshahiUniversity, 26(5), pp. 49--54.[9] Davies, O. A., Alfred-Ockiya, J. F. and Asele, A. (2006). Induced growth of phytoplankton usingtwo fertilizers (NPK and agrolyser) under laboratory conditions. African Journal ofBiotechnology Vol. 5 (4), pp. 373-377[10] Day AD and Katterman FRH. 1992. Sewage sludge provides plant growth factors in aridenvironments. J Arid Environ 23, 229-233.[11] Gao M.T., Hirata M, Toorisaka E and Hano T. 2006. Acid-hydrolysis of fish wastes for lacticacid fermentation. Bioresour Technol 97, 2414-2420.[12] Geiger, J.G. and C.J. Turners (1990) Pond fertilization and zooplankton management techniquesfor production of fingerling striped bass and hybrid striped bass in culture and propagationstriped bass and its hybrid.International Journal of Innovative Studies in Aquatic Biology and Fisheries (IJISABF)Page 22
B.B. Sahu et al.[13] Hecky, R. E. and P. Kilham. (1988) Nutrient limitation of phytoplankton in freshwater andmarine environments: A review of recent evidence on the effects of enrichment. Limnol.Oceanogr., 33, pp. 796--822.[14] Jhingran, V.G. (1983) Fish and Fisheries of India. Hindustan Publication Corporation India, NewDelhi, pp. 666.[15] Kim JK, Dao VT, Kong IS and Lee HH.( 2010). Identification and characterization ofmicroorganisms from earthworm viscera for the conversion of fish wastes into liquid fertilizer.Bioresour Technol 101, 5131-5136.[16] Kumar, NJI. And Omen, C. (2009) Influence of limiting factors on phytoplankton and coliformpopulation in an inundated, isolated wetland. Journal of Wetlands Ecology, 3, pp. 43--55.[17] Mageed, A. A. and A. H. Konsowa. (2002) Relationship between phytoplankton, zooplanktonand fish culture in a freshwater fish farm. Egyptian J. Aquatic. Biol. & Fish., 6(2), pp. 183--206.[18] Malik, S. (1992) Microbial population and zooplankton production potentialities of selectedorganic and chemical fertilizers. M. Sc. (Ag.) Thesis, Department of Limnology and Fisheries,RCA, Rajasthan Agriculture University, Udaipur, pp. 131.[19] Martin Antonio M. and Paul L. Bemister (1994) Use of Peat Extract in the Ensiling of FisheriesWastes Waste Management Research. 12 (November) 6, pp. 467--479.[20] Mirza, M.J.A., Kadir, M.A., Nandi, C.S., and Nuruzzaman,N., (1990) Effects of cow dung on thephysico chemical characteristics of the nursery ponds. Bangladesh J. Train. Devt. , 3(1), pp.83-89.[21] Morris, J.E. and Mischeke, C.C. (1999) Plankton management for fish production ponds.Technical bulletin series 114, Ames, lowa.[22] Moutin, T., Thingstad, TT.,Wambeke, FV., Marie, D., Slawyk, G., Raimbault, P. and Claustre,H. (2002) Does competition for nanomolecular phosphate supply explain the predominance ofthe cyanobacterium Synechococcus. Limnology and Oceanography, 47(5), pp. 1562-1567.http://dx.doi. org/10.4319/lo.2002.47.5.1562.[23] Naito K., Suzuki M., Mito S., Hasegawa H., Matsui M. & Imai I. (2006) Effects of thesubstances secreted from Closterium aciculare (Charophyceae, Chlorophyta) on the growth offreshwater phytoplankton under iron-deficient conditions. Plankton Benthos Res, 1(4), pp. 191-199.[24] Needham, J. G. and Needham, R. P (1972) A guide to the study of freshwater biology. Holdenday, INC Cali 94 (III), U.S.A.[25] Noiri Y, Kudo I, Kiyosawa H, Nishioka J, Tsuda A (2005) Influence of iron and temperature ongrowth, nutrient utilization ratios and phytoplankton species composition in the western subarcticPacific Ocean during the SEEDS experiment. Prog. Oceanogr, 64, pp. 149--166.[26] Olah, J., V.R.P. Sinha, S. Ayyappan, C.S. Purushothaman and S. Radheyshyam (1986) Primaryproduction and fish yields in fish ponds under different management practices. Aquaculture, 58,pp. 111--122.[27] Pennak, R. E. (1989) Freshwater invertebrates of United States: Protozoa to Mollusca (3rd eds.).New York: Wiley.[28] Sahu, B. B., Barik, N. K., Mohapatra, B. C., Sahu, B. N., Sahu, H., Sahoo, P., Majhi, D., Biswal,N. C., Mohanty, P.K., Jayasankar,P. (2014) Valorization of fish processing waste through naturalfermentation with molasses for preparation of bio fertilizer and bio supplement. JECET, 3(3), pp.1849--1855.[29] Senthil Kumar, D., Satheesh Kumar, P., Uthaya kumar, V. and G. Anbuganapathi (2014)Efficacy of Biofertilizer Enriched Flower Waste Vermicompost on Production and Growth ofPrimary Producers and Freshwater Aquarium Fishes. Global Veterinaria, 13(2), pp. 215--220.[30] Sipaúba-Tavares, L.H., Baccarin., A.E. and Braga, F.M. de S. (2006) Limnological parametersand plankton community responds in Nile tilapia ponds under chicken dung and NPK (4–14-8).Fertilizers.Acta.Limnol.Bras. 18(3), pp. 335-346.[31] Sipaúba-Tavares, LH.,Donadon, ARV. and Milan, RN. (2011) Water quality and planktonpopulations in an earthen polyculture pond. Braz. J. Biol.,71 (4) pp. 845—855.International Journal of Inn
concentrated preserved plankton samples were analysed on a Sedgewick-Rafter counting cell (SR- . , 1989). 2.3. Enumeration and Identification of Plankton For each sample, 1 ml of sub-sample was transferred to the cell. From 10 randomly selected cell, square of the planktonic organisms were enumerated. The plankton was further identified upto .