Transcription
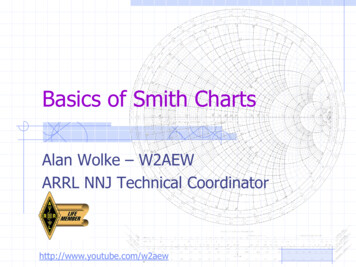
Basics of Smith ChartsAlan Wolke – W2AEWARRL NNJ Technical Coordinatorhttp://www.youtube.com/w2aew
W2AEWWhat is a Smith Chart A graphical tool to plot and compute:– Complex impedance– Complex reflection coefficient– VSWR– Transmission line effects– Matching networks– and more Let’s break it down .Page 23/7/2019
W2AEWNormalized Impedance Normalized Z Actual Z / System Z0– For Z0 50Ω, divide values by 50 Example:– 𝑍 37 𝑗55′–𝑍 3750 55𝑗50This is what we plot on the chart– 𝑍 ′ 0.74 𝑗1.10 Makes it usable for any system Z0Page 33/7/2019
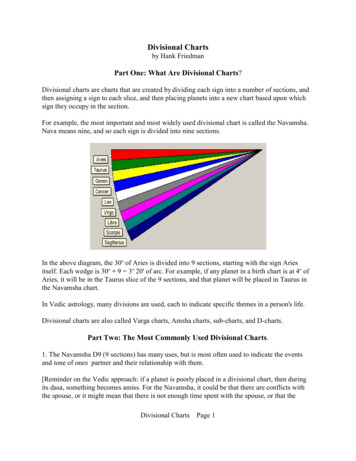
W2AEWZ Regions on the Smith Chart𝑅 𝑗𝑋 j Inductive𝑅 𝑗𝑋Page 4Purely Resistive𝑗𝑋 0-j Capacitive3/7/2019
W2AEWKey Values on the chartShortCircuitPage 5Z0(system impedance)OpenCircuit3/7/2019
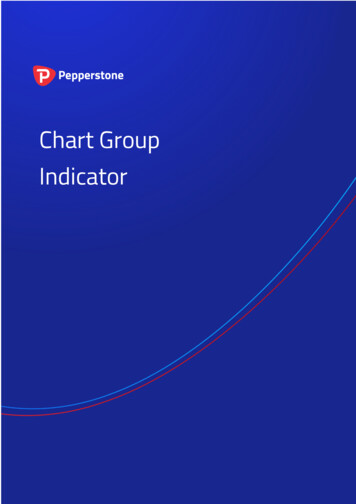
W2AEWConstant Resistance CirclesR’ 1.0R’ 0.4R’ 3.0Page 63/7/2019
W2AEWConstant Reactance ‘Arcs’X’ j1.0X’ j0.5X’ 0X’ -j0.5X’ -j1.0Page 73/7/2019
W2AEWPlot a Complex Impedance 𝒁 𝟐𝟓 𝒋𝟒𝟎 Divide by 50 to normalize 𝒁′ 𝟎. 𝟓 𝒋𝟎. 𝟖 Find intersection ofR’ 0.5 circle and X’ 0.8 arcPage 83/7/2019
W2AEWAdding Series ElementsAddedXL’ j0.6 Add components tomove around theSmith Chart Series L & C movealong constant-Rcircles– Series L moves CW– Series C moves CCWPage 9Addingseries LAddingseries C3/7/2019
W2AEWWhat about Admittance? Admittance is handywhen adding elementsin parallel ConvertingImpedance toAdmittance is easywith Smith Chart1𝐴𝑑𝑚𝑖𝑡𝑡𝑎𝑛𝑐𝑒: 𝑌 : 𝐺 𝑅1𝑆𝑢𝑠𝑐𝑒𝑝𝑡𝑎𝑛𝑐𝑒: 𝐵 𝑋** (when “real” component 0)Page 103/7/2019
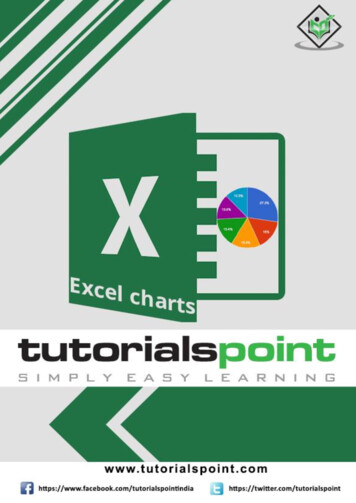
W2AEWConverting to Admittance Draw circle centeredon Z0 that crossesthrough Z point Bisect circle thru Zand Z0 Y is 180 away oncircle𝑍 ′ 1 𝑗1.1𝑌 ′ 0.45 𝑗0.5Page 11ZY3/7/2019
W2AEWAdmittance CurvesAdmittance Curves are obtained by simplyrotating the Smith Chart by 180 ZPage 12Y3/7/2019
W2AEWCombination Charts Look carefully –Admittance curvesare here! Both Z-onlyand combocharts are available Constant Conductance Constant SusceptancePage 133/7/2019
W2AEWAdding elements in parallel Adding parallel orshunt L & C movesalong constantconductance circles Easiest to do with“combo” Smith Chart– Shunt L with𝐵′ 𝐿 𝑗0.3is shownPage 14Addingparallel LAddingparallel C3/7/2019
W2AEWQuick tip – adding elements Adding inductors“eLevate” thrureal axis Adding capacitors“Crash” downthru real axis Remember thiswhen we design amatching circuit!Page 15Addingseries LAddingseries CAddingparallel LAddingparallel C3/7/2019
W2AEWMore Smith Chart Magic Radially ScaledParameters Rotate vector to realaxis, extend to radialscales:– VSWR: 2.3:1– Return Loss: 8.10dB– Reflection Coefficient:Power: 0.155V or I: 0.39Page 163/7/2019
W2AEWVSWR and Transmission Lines Constant VSWR circle– Impedance varies– VSWR stays same One trip aroundSmith chart is½ wavelength– Impedance repeats Half-way around is¼ wavelength:– Open transformed to Short– Short transformed to OpenPage 173/7/2019
W2AEWVSWR and Transmission Lines Transmission Line effects– Predict Z vs. line length Example:– Measure Z atTX, predict Zat antennaMeasuredat TXPage 18Rotate towardsLoad to find Zat antenna3/7/2019
Impedance Matching:L-NetworkW2AEW Add series/parallelinductor/capacitor to moveZL to Z0 L-Network topology based onwhere ZL is on the Smith Chart Sometimes more than onenetwork topology worksPage 193/7/2019
W2AEWL-Network Design Process Pick a topology Process:– Add ser/par L/C torotate to unity R or Gcircle– Add ser/par L/C torotate to Z0– Compute values from X’ and B’Shunt CSeries L Example:– Series L, shunt CPage 203/7/2019
W2AEWL-Network Example: Step 1 Freq 432.1MHz 𝑍𝐿 75 𝑗60 Normalize 𝑍𝐿′ 1.5 𝑗1.2 Plot it Pick a topology:Page 213/7/2019
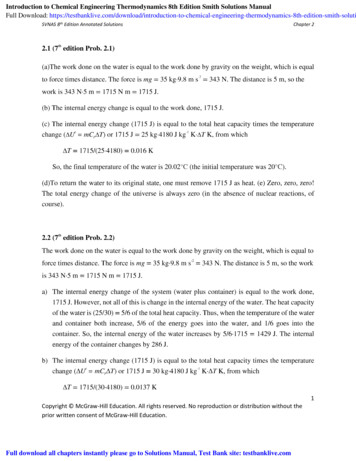
W2AEWL-Network Example: Step 2 Add Shunt L– Rotate on constantG until hit R’ 1– Added B’L is0.32 0.5 j0.82– X’L j1.22– XL j61– L XL/(2*pi*F)– L 22.5nHPage 22 j0.5 j0.323/7/2019
W2AEWL-Network Example: Step 3 Add Series C– Rotate on R’ 1until hit Z0– Added X’C -j1.2– XC -j60– C 1/(XC*2*pi*F)– C 6.14pF-j1.26.14pF22.5nHPage 233/7/2019
W2AEWExtra Credit: Z-only chart3: Convert toAdmittance Y’L5: Convert toImpedance6: AddSeries C4: AddShunt L2: Plot Z’L&ConstantSWR circle1: DrawY 1 circlePage 243/7/2019
W2AEWSummary The Smith Chart is a highly useful tool:– Complex Impedance Transformations– Determining VSWR, RL, and much more– Transmission Line impedance transformations– Matching Network Design– and a lot more that we haven’t touched on Check out SimSmith – PC based tool– http://www.ae6ty.com/Smith Charts.html– http://www.w0qe.com/SimSmith.htmlPage 253/7/2019
Adding Series Elements Add components to move around the Smith Chart Series L & C move along constant-R circles -Series L moves CW -Series C moves CCW Page 9 3/7/2019 Adding series L Adding series C Added X L' j0.6