Transcription
“Profitable CandlestickEntry and Exit Strategies”How To Recognize The Exact Right Time To Buy Or SellA Candlestick Forum publication – Years of Candlestick Analysis madeavailable in concise formats. Information that when learned andunderstood will revolutionize and discipline your investment thinking.Copyright @ by Stephen W. Bigalow 2002Published by The Candlestick Forum LLC
Profitable Candlestick Entry and ExitStrategiesTable of ContentsIntroduction . . 3Common Sense 4“Buy stocks that are going up. If they don’t go up, don’t buy them” 5How Stocks Open Reveals Huge Knowledge . . 7BUY on a Strong Open . 13Use Pre-Open Indicators to Improve Profits . . 14Play The Probabilities . . 17When Is It Time To Get Out?. . 22Simple Rules . . 25The Trend Has Started. . 26Use Today’s Investing Strategies for Today! 282
IntroductionThe Candlestick signals are in existence today because of their statistical probabilities. Ascan be imagined, the signals would not be in existence today if they did not produceprofits. Profits noticeable through history, significantly more than random luck or normalmarket returns. The purpose for utilizing the Candlestick signals is to put as manyprobabilities in your favor as possible.The fact that the signals are still around is due to results over centuries of observations.Assuming that the probabilities of making a profit from a signal is above 50%, maybe60%, 70% or even 80%, those percentages can be enhanced by an additional factor. (Todate, statistical performance has been difficult to obtain. The fact that there have beensevere misunderstandings by most investors of when a signal is truly a signal has beena deterrent. That lack of knowledge and the multitude of parameters needed to dostatistical analysis makes programming for statistical results an overwhelming task.The Candlestick Forum is currently directing local university projects to accumulatethose statistics. They will be made available to Candlestick Forum members as resultsare obtained. Because of the magnitude of this project, information will probably bereleased in bits and pieces as they are completed.)How the position is acting once the signal has appeared is an immediate filtering element.Being that we all eternal optimists, we want every position to go up as soon as we buy it.But keep in mind, even with phenomenal results of 80% positive trades, that still leaves20% that will not work. The more steps that can be taken to reduce the bad trades, thebetter the results of your placed investment funds.The information revealed in this book and on the Candlestick Forum website is not thetelling of ancient “secrets” or the new development of sophisticated computer generatedformulas. It is the assembling of common sense observations from centuries of actualprofitable experience. As you may have noticed yourself, Candlestick information hasbeen around for several decades. Everybody knows about them, they use the graphics forbetter viewing of charts, but they just don’t know how to use the signals themselves. You,by taking the time and effort to research the Candlestick method, are still in a smallminority of the investment community. All the concepts conveyed in this book and therest of Candlestick analysis is just common sense. Remember, the Japanese rice tradersmade huge profits from the Candlestick method. They used rice paper to draw charts andbacklit them in candle boxes. The concepts applied to Candlestick analysis eventuallybecame the backdrop of the Japanese investment culture.3
Common SenseAs you learn about the Candlestick method, keep in mind that the common senseapproach is what distinguishes this investment technique from most other tradingpractices, with those practices being heavily weighted by emotional decision-makingprocesses. The information you are receiving is knowledge available to everyone.However, you have the benefit of getting the correct interpretation, which means youget the desired results. Take advantage of this knowledge. It will create confidence ininvesting that most people never experience.Just as the signals produce valuable information as to when to buy a position, they arejust as valuable for demonstrating when to sell. This sometimes is much sooner than isexpected. Simple logic tells us that if a Candlestick “buy” signal appears in the rightplace with the right confirming indicators, that the trade should be ready to go.Unfortunately, reality may show a different outcome. How a price opens the next day isalso a very important indicator as to how aggressive the buyers are. (The sameparameters can be applied to sell / short transactions, but for illustration purposes, the buyside will be used to represent all trades.) Utilizing that information can be instrumental inweeding out less favorable trades.The logic behind the results of an open the next day after a signal is simple. Is thereevidence that the buyers are still around? That information is readily available throughinexpensive live-feed services. We recommend the TCNet program (see moreinformation about all the investment benefits that TCNet provides for investors on oursite, www.candlestickforum.com). Being able to view how a stock is going to openbefore the market opens improves an investor’s positioning dramatically. Watch yourreturns multiply by eliminating the bad trades.The shorter the trading period, the more critical the opening placement. Options aretrading vehicles that require the most exact timing possible. Longer-term investors havemore leeway when putting on a position. A six-month trade or a one-year trade is usuallybeing bought when the monthly, weekly and daily candlestick charts all coordinate, eachchart showing it is time to buy. (The monthly and daily charts are the pivotal charts forlong-term investors; the weekly chart is often out of sync with the other two, which doesnot affect the results).4
“Buy stocks that are going up. If they don’t go up, don’t buythem.” Will RogersEach formation is not necessarily a signal. A Candlestick “buy” signal in the overboughtarea does not mean the same as a Candlestick “buy” signal in the oversold area.Conversely, a Candlestick “sell” signal does not mean the same in the oversold area as itdoes in the overbought area. Many investors confuse the formations as signals, but do nottake into consideration where the stochastics are.As you learn more about the signals, you will become acquainted with where the realsignals occur. The majority of the time, that will be in the overbought or oversold ranges.Occasionally it will be in a midrange area, as in the J-Hook pattern. But there should beone simple, basic parameter for entering a position after the appearance of a buy signal.Are the buyers still present?When do most investors want to buy into a stock? Usually after the price has gone upconsistently for the past number of days or weeks. Finally they become convinced thatthe stock is going to go up forever. That is the reason inordinate amount of volume isusually seen at the tops. Everybody has gained enough confidence to get in. There hasbeen broadcast after broadcast on the T.V. financial stations about how great thecompany or the industry is doing. To not get in means you are going to be left behind. Ofcourse that is just about the top of the run. It starts to pull back because of profit taking.You hang on because after the profit taking, the up trend should continue. However, thepullback lasts a few weeks longer than you expect. Then it moves slowly up to the areathat you bought, bumps into resistance, and pulls back again. Pretty soon you are sittingin a stock that you’ve owned for three months and it still isn’t back to where you boughtit. Not a good return on your invested dollars!Or consider the investor who has a little more thinking in his approach. He is going tobuy a stock he has followed because it has pulled back a hefty percentage. This is at leastmore logical than buying a stock because it has gone up a great deal. But this also has itsflaws if done without using any buying parameters or signals. Enron is a prime exampleof not buying a stock just because it has backed off a good percentage from its high. Theperson buying a stock because it has gone down, without any buying signals, is justgrabbing for the falling knife. One of three things can happen from that point, and two ofthem do not make you money. The price could easily continue its downward trek. Buyingbecause you think that the sellers have sold enough may not be a viable approach. Or thestock price could level out and trade flat for the next six months, not a profitableendeavor.Finally, because you have a wonderful sixth sense, you happened to buy the stock at thebottom and it turned up reasonably quick. If that is the case, you do not want to read thisbook or any book that would screw up that talent.The best investment strategy is to buy a stock that has bottomed and the buying isbecoming more prevalent. Tall order? Not really, when you can visually see the buy5
signs. The probabilities are much greater in finding stocks that are just starting to makean up move. It is better to buy a stock where fresh buying is recently coming into thestock and getting in on strength. Participating with other buyers at least indicates thatthere are other buyers, logical. As in the famous investment strategy of Will Rogers,“Buy stocks that are going up. If they don’t go up, don’t buy them”. As backward as thatphilosophy appears in the real world, the Candlestick signals get investors close to thatconcept.6
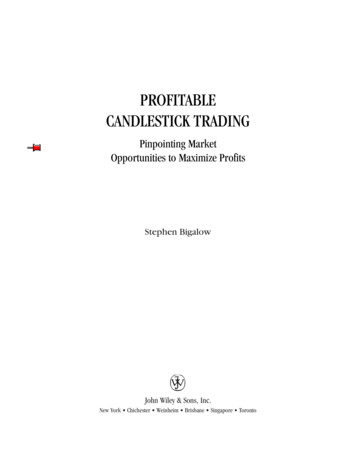
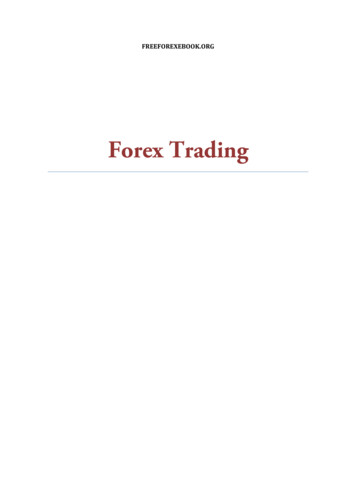
How Stocks Open Reveals Huge KnowledgeAfter that wordy dissertation, we now get to the meat of the subject - being aware of howto get into trades properly. What is the message of a “buy” signal? As expressed in the“Profitable Candlestick Trading” book, a signal is the cumulative knowledge of allinvestors participating in that stock that day. If this is the only statement that youremember about Candlestick analysis, you will easily comprehend the ramificationsbehind the signals. A “buy” signal is formed by the reversal of the psychology of adownward trend. That is the formation that becomes visually evident to the Candlestickinvestor.Simply stated, the signal is showing the evidence of buyers coming into a stock, reversingthe previous downtrend. Those signals, 10 major signals and approximately 40 secondarysignals and continuation patterns, can be identified by the Candlestick trader. Asdiscussed earlier, the signals each provide a positive percentage of profitable trades, andbad trades. The best test for determining placing a position from that signal is based uponone simple question. On the open of the next day, are the buyers still there?This may appear to be elementary, but it is the basis for getting into the position in thefirst place. The Candlestick signal represents a change of direction. The magnitude of thepresence of buyers has an important factor on how strong that reversal will be.Figure 1, Pinnacle Entertainment opens near the previous close. This clearly indicatesthat the buyers have not backed away. Witnessing the price advance from the openingtrades reveals that buyers are stepping in without hesitation. Buy immediately. You haveall the parameters evaluated. The probabilities are in your favor. There should be noreason not to get into the position.7
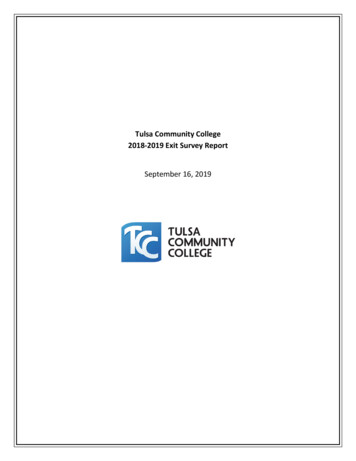
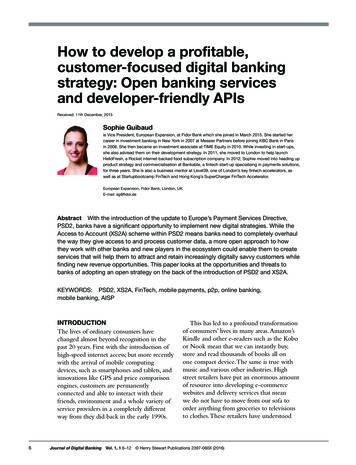
Figure 1, Pinnacle EntertainmentOpening near theprevious close andimmediately headinghigher is considered astrong openNote in Figure 2, Province Healthcare Co. the buyers were still present. The open, byremaining in the area of where the buyers closed the price the day before, indicates thatthere was not a change of heart overnight. “In the area” can mean a slightly loweropening price. Consider the action of the price the day before. It had a big up day. As theclose was getting near, the shorts may have realized that selling was not coming into thisstock. They may have covered, pushing the price up further on the close. Profit taking orsellers still wanting to get out of the stock could lower the price on the open. The nextmorning, prices opening slightly lower and immediately heading higher indicates that thebuyers have not disappeared. As soon as the first few minutes of trading transpire afterthe open, an investor should be able to ascertain how the stock and markets areperforming.If the market is not falling out of bed and the stock price doesn’t appear to want to headlower, it is time to start putting on the position. A prudent method would be to buy halfthe position at the slightly lower level and putting a buy stop at the previous day’s closefor the other half. The rationale being that if the price comes up through yesterday’sprice, the buyers are still present.8
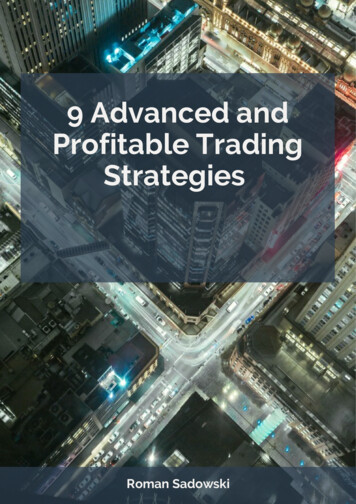
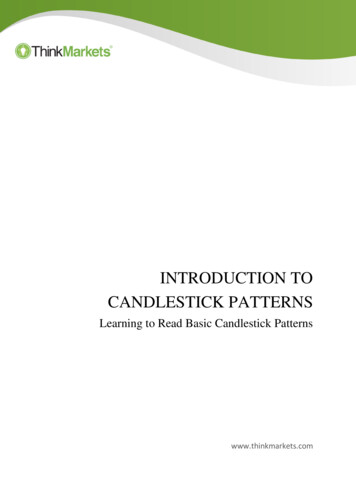
Figure 2, Province Healthcare Co.An open very nearthe previous close isa strong openThe most promising form of evidence that the price is getting strong buyers’ attention isthe gap up. Note in Figure 3, Meritage Corp., a gap up formed. As defined by the gap,(see “Big Profit Patterns Using Candlesticks Signals and Gaps”) the strength from thebuyers is very strong. A gap at the bottom of a downtrend and after a reversal signal isone of the best signs of buying strength possible. One should be committing fundsimmediately.The gap up at a beginning of a trend bodes very well for an extended rally. Whether theindexes are opening up weak or strong, a gap up in a stock requires immediate attention.There is buying going on in this stock that is not concerned about the status of themarkets. Try to get into the stock as fast as possible. The advantage of being able to viewthe bid and ask prices prior to the open is that it prepares you for your entry strategy.Seeing a stock price being bid up before the open, and knowing what a gap up indi
27.05.2002 · trading vehicles that require the most exact timing possible. Longer-term investors have more leeway when putting on a position. A six-month trade or a one-year trade is usually being bought when the monthly, weekly and daily candlestick charts all coordinate, each chart showing it is time to buy. (The monthly and daily charts are the pivotal charts for long-term investors; the weekly chart is .