Transcription
Individual Intelligence andAdaptive TestingMardis Dunham, Ph.D.Professor and Licensed PsychologistMurray State University (KY)December 9, 2020
Purpose of Workshop To review assessment concepts and test interpretation To review distinctions between screening and diagnostictests To review/discuss IQ, Adaptive, and AchievementTesting concepts and purposes To review/discuss intellectual disabilities via casestudies
Phrenology . . .
Important Assessment Concepts:Criterion Referenced vs Norm Referenced Coverage: Narrow Items:vs Broad spectrumMany items vs Few items Purpose:Instructional vs Diagnostic/eligibility Interpretation: Percentage ofCriterion acquired vsPercentile (placement within the norm group)
Example Bob has mastered 83% of his times-tablesthrough number 10. Bob’s performance on the Woodcock-JohnsonAchievement Test placed him at the 53rd percentile. Percentile tells the % of people, who took the same testas Bob, who scored at or below his score. “Anchor point” for criterion tests is the test items; forNorm-Referenced Tests it is the population of otherpeople that same age who took that same test
Norm-Referenced/Standardized Tests Used for Diagnostic and Eligibility Purposes Can be academic, personality, cognitive/intellectual, andadaptive All diagnostic, norm-referenced tests have several scales orindices, never just one stand alone score Items for each scale begin very easy and advance to verydifficult The number of items a person gets correct is the Raw Score
The Raw Score is then compared to the expected or averageraw score for that persons age The fewer items correct, the lower the person’s reading skills,IQ, memory, etc; the more items correct, the higher theperson’s skills relative to others their age. When the person’s raw score is compared to that of 100s ofothers their age, the score is converted to a Standard Score—this is where the Normal Curve comes in Standardized means that the test is administered the sameway to every person.
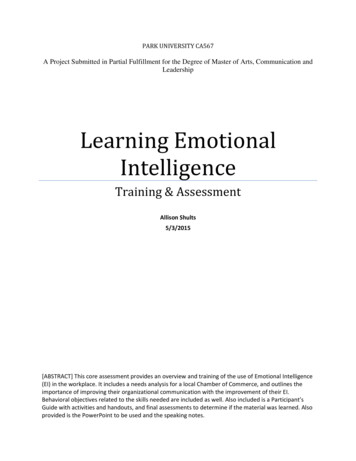
IQ Distribution
Normal Curve—an abstract mathematical construct uponwhich almost all mental measurement (psychometrics) arebuilt. Most well standardized instruments yield scores that arenormally distributed—that is, the mean, median, and modeare all the same. The Normal Curve allows us to predict/determine thepercentage or number of scores falling above, at or below acertain standard score or between two certain points on thecurve.
Mean and Standard Deviation Theseare used in concert to establish how farabove or below average a person’s score on a testfalls TheMean is the average (arithmetic mean) TheStandard Deviation tells how the scoresacross a population of test takers is dispersedaround the mean. Takethe example of archery . . .
Derived or Standard scores—often expressed asdeviation IQ scores, these scores have beentransformed to have a set mean and set standarddeviation. Standard scores allow us to compare how a personperformed on two different instruments relative to thepopulation. For example, a standard score on an IQ test of 100 isaverage, but a standard score on a test of reading of 80is below average (assuming they both have a standarddeviation of 15).
Important Scores on Standardized Tests Most all standardized, norm-referenced tests have an average orMean score of 100 and a standard deviation of 15 pts. Scores 90 to 109 (or 110) are considered average for most tests(This captures the middle 50% of the population) (%iles 25 to75) Scores 85 to 115 are considered average for other tests (thiscaptures the middle 68% of the population) (%iles 15 to 85) Scores below 70 are at the lowest 2% of the population (this isthe magical cut score to consider an intellectual disability.
Cont.Standard Error of Measurement Every score obtained on a standardized test is composed of the person’s“true” score, /- error. Error comes from poor administration, over-encouragement, givingfeedback, giving suggestions, poor scoring, etc. This “error” is normally distributed and predictable—called thestandard error of measurement or SEm. The SEm forms the confidence band within which the “true score” willfall 90% of the time (or 68% or whatever). The SEm can be used sparingly to help determine eligibility
SEm Sample The SEm for 95% of standardized IQ, ach, and AdaptiveBehavior tests is 3 pts ( /-) So, Julio has a Full Scale IQ of 72. If applying the SEm, hisscore range is 69 to 75. Because 69 is below 70, we can nowconsider ID. BUT, take these scores:FSIQVerbal Comp IQ 65Perceptual Org IQ71Working Memory 6380Processing Speed 77 Using SEM would be inappropriate Can use SEM for Adaptive Testing too, BUT CAUTIOUSLY
Screening Tests Screeningtests are brief assessments designed tofind those at risk for certain disorders, who mightbe eligible for school programs (e.g.,counseling), who might need remediation (viaRTI), and who might need comprehensiveevaluation (Sattler, 2008) e.g.,depression screening, vision screening,behavior screening, substance abuse screening,ADHD screenings . . .
Used in schools, clinics, hospitals, and private practiceas part of a two-step process Typically used by paraprofessionals are quick and easyto give and score Minimal training required; easy to purchase Typically, no credential required to use
Measurea narrow-band of functioning (e.g.,attention, low mood, word reading, verbalexpression) Commonlygroup or computer administered Typicallymultiple-choice format (to limit trainingrequired and to increase reliability) Designedto prevent unnecessary comprehensive(i.e., diagnostic and expensive) testing
Sample Cognitive Screeners Kaufman Brief Intelligence Test-2 (KBIT-2) Scholastic Abilities Test for Adults (SATA)Aptitude Quotient Wechsler Abbreviated Scale of Intelligence-2(WASI-2) Shipley-2 Test of Nonverbal Intelligence (TONI) Raven’s Progressive matrices Naglieri Nonverbal Ability Test (NNAT)
Sample Academic Screeners WideRange Achievement Test Nelson-Denny Curriculum-basedassessments Scholastic Abilities Test short-forms offor Adultscomprehensive achievement tests
Academicscreeners often measure lowlevel/basic academic skills (word reading,spelling, math calculation) Typicallyno measure of academiccomprehension/application or speed/fluency Notco-normed with cognitive tests Interpretation isvery limited (not their purpose)
Diagnostic Tests Theseprovide detailed evaluation of one’snormative and personal strengths andweaknesses in several areas Designedto diagnose conditions and establisheligibility for programs Betternorming/better stratification
Severalsubtests normed together—permits morecomprehensive analysis of scores (e.g., unexpecteddifferences) Measurelow level skills and higher-order reasoningskills and sometimes fluency (for academic skills) Usedin schools, clinics, hospitals, and privatepractice settings
Requiremore training, practice, andcredentialing to ethically administer, score, andinterpret Typicallyrequire undergraduate training(achievement tests) and graduate training andcredentials (cognitive and behavior tests) Thesetests require verification of credentials topurchase
Sample Diagnostic Cognitive Tests– 89) UNIT-2 (5 to age 21-11) WISC-5 (6 to age 16-11) KABC-2 (3 to age 18-11) Leiter-3 (3 – 75) WJ-IV Cognitive (2 to age 89) Stanford-Binet-5 (2 – 85) Wechsler Memory Scale-IV (16 – 89) WAIS-IV (16
Sample Diagnostic Achievement Tests Woodcock-Johnson-IV Testsof Achievement (2to age 89) WechslerIndividual Ach. Test-3 (6 to age 50) Kaufman Testof Educational Achievement-3 (3to age 25-11) GrayOral Reading Test-5 (6 to age 23-11)
Sample Diagnostic AdaptiveTests Adaptive Behavior Assessment System—Third Edition (ABAS-3) Vineland Adaptive Behavior Scale—ThirdEdition (VABS-3)
Getting more into the weeds withIQ Tests . . .
Wechsler Adult Intelligence Scale—FourthEdition (WAIS-IV) (2008) Average scores are 90 to 109FACTORS/INDICES Full Scale (composite of 10 subtests) Verbal Comprehension (3 subtests) Perceptual Organization (3 subtests) Processing Speed (2 subtests) Working Memory (2 subtests)
Descriptions of Scores130 Very Superior120 – 129 Superior110 – 119 is High Average90 - 109 is Average80 - 89 is Low Average70 – 79 is Borderline69 and below is Extremely Low
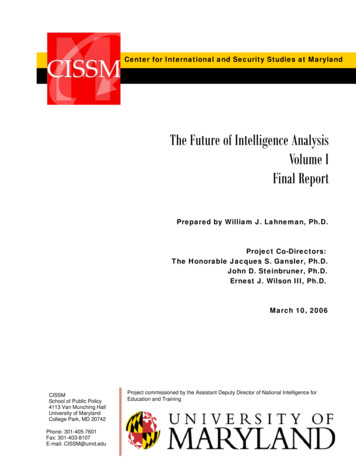
Organization/Structure: FSIQVerbal ComprehensionFullScaleIQPerceptual ReasoningProcessing SpeedWorking Memory
Scale Descriptors:Primary ScalesFSIQ Primarily seen as a measure of generalor overall intelligence Simply a compilation of 10 subtests butis generally seen as the best indicator ofa wide range of factors (adaptation,learning, academics, etc.)
Verbal Comprehension Index (VCI) Measuresthe ability to access (retrieve) andapply acquired word knowledge, verbalconceptual thinking, verbal reasoning, andverbal expression. Vocabulary, Information, and Similarities
Perceptual Organization (POI) Measuresthe ability to grasp underlying conceptualrelationships among visual stimuli, ability to usereasoning to identify and apply rules, inductivereasoning, simultaneous processing, and novelproblem solving BlockDesign, Matrix Reasoning, Figure Weights
Working Memory (WMI) The ability to register, maintain, andmanipulate visual and auditory informationin immediate/conscious awareness. Requiresattention, concentration, goodimmediate storage, and mental resequencing Digit Span and Arithmetic
Processing Speed (PSI) Measures speed and accuracy of visualregistration, decision making and decisionimplementation. Tapsvisual scanning, visual memory,visuomotor coordination and concentration Coding and Symbol Search
Woodcock-Johnson IV: Testsof Cognitive Abilities (2014)Schrank, McGrew, & Mather
Organization/Structure: Gf-GcComprehensionKnowledge (Gc)Gf-GcFluid Reasoning (Gf)
Gf-Gc Composite (not for ID diagnosis) Thisestimates IQ based upon the four higher order/gsaturated subtests. 4 Subtests Subtests that measure lower-level abilities are removed Average Scores are 90 to 110 Like the WAIS, WJ-COG cores 70 indicate IDGeneral Intellectual Ability and GIA Extended(may* be used for ID Diagnosis) 10subtests or 14 subtests (Extended)*not my top test for ID
GIA Extended IndicesComprehension-Knowledge (Gc)Breadth and depth of knowledge and skills,including verbal communication and information.Reasoning, when using a previously learnedprocedure, is included as well
Fluid Reasoning (Gf)The ability to reason and solve problems thatinvolve novel information. Includes thereorganization, transformation, and extrapolation ofinformation
Short-Term Working Memory (Gsm)The ability to encode, maintain, andmanipulate information in immediateawareness. Includes the capacity to performthese procedures and the efficiency ofattentional control to manipulateinformation in immediate awareness.
Auditory Processing (Ga)The ability to discriminate, encode,employ and synthesize auditorystimuli.
Long-Term Retrieval (Glr)The ability to encode, consolidate, andretrieve information over periods of timeafter being displaced from immediateawareness. Involves the amount that canbe stored and the rate and fluency that itcan be accessed or retrieved
Visual Processing (Gv)The ability to analyze and synthesizevisual stimuli and to employ andmanipulate mental images to solveproblems
Cognitive Processing Speed (Gs)The speed and efficiency atperforming cognitive tasks,particularly when under pressure tosustain controlled attention andconcentration
Academic Achievement TestsMost popular include . . . Woodcock-Johnson IV Tests of Achievement (2– 89) Wechsler Individual Achievement Test-IV (6 to16-11) Kaufman Test of Educational Achievement(3 –25) Average scores are 90 to 109, 90 to 110, or 85 to115
All Comprehensive, standardized/Diagnosticachievement measure: Basic Reading, Reading Comprehension, ReadingSpeed, Decoding MathComputation, Math reasoning, Math calculationspeed Spelling, Writtenexpression
Adaptive Behavior A person’scompetence in meeting the natural andsocial demands of one’s environment, including selfhelp skills, social skills, communication skills, copingskills, community navigation skills. These behaviorsare learned Adaptive Itemsdo.”behavior testing is informant drivenmeasure “does do” without reminders vs “can
Adaptive Behavior TestsVineland Adaptive Behavior Scales—ThirdEdition (VABS-3) (2016) Adequate/Averagescores 86 – 114 AgesBirth – 90 for Interview Form Ages3 – 90 for Domain Form TeacherForms, Parent Forms Providesa measure of maladaptive behavior
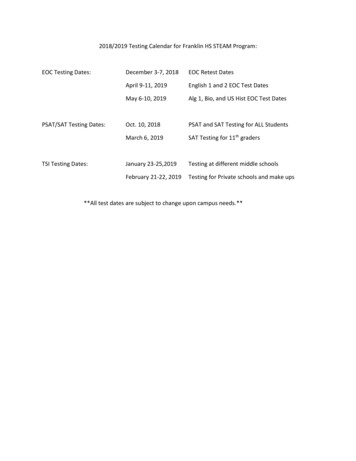
VABS-3 Organizational Structure:CommunicationDaily Living SkillsABCSocializationMotor Skills
VABS-3 DomainsCommunication: measures receptive, expressive, and writtencommunication effectivenessDaily Living Skills: measures self-sufficiency in personalliving/self-help, including dressing and hygiene; skill in performinghousehold tasks, including food preparation; community livingSocialization: measures effectiveness in responding/relating toothers, conversational interactions, and emotional/behavioral control
Adaptive Behavior Assessment System—ThirdEdition (ABAS-3) (2015) Adequate/Average scores Ages 90 - 109Birth – 89 Teacher,caregiver, other adult forms
ABAS-3 Organizational Structure:ConceptualSocialGACPracticalMotor Skills andWork Skills
ABAS-3 DomainsConceptual: measures behaviors needed to communicate withothers, apply academic skills, and manage and accomplish tasks.Practical: measures behaviors needed to address personal andhealth needs, take care of home, classroom, or work settings, andfunction in a community.Social: measures behaviors needed to engage in interpersonalinteractions, act with social responsibility, and use leisure time.
Quick Review of Intellectual DisabilitiesIntelligence disabilities is defined by the DSM-V (and for all previouseditions) requires:1. IQ and adaptive behavior is two standard deviation units below themean—that is, an IQ below 702. Condition must occur during the developmental period (i.e.,childhood) Other conditions, occurring beyond the developmental period, cancause significant intellectual impairment as well. E.g., brain tumorsand injuries, toxicity, poisonings, various neurological conditions
Four Levels of Intellectual DisabilitiesIQ LevelRangeApprox. Mental Ageas AdultMild50-55 to 708-3 to 10-9Moderate35-40 to 50-555-7 to 8-2Severe20-25 to 35-403-2 to 5-6Profound 20-25 3-2
ETIOLOGYGenetic DisordersFragile X SyndromeGlactosemiaLesch-Nyhan SyndromeNeurofibromatosis 1Phenylketonuria (PKU)Rett SyndromeRubinstein Taybi SyndromeTay-Sachs DiseaseTuberous Sclerosis
Chromosomal DeviationsAngleman syndromeCri-du-chat syndromeDown syndromeEdwards syndromeKlinefelter’s syndromePatau syndromePrader-Willi syndrome
Cranial MalformationsHydrocephalusMicrocephalusOther Congenital FactorsCongenital Hypothyroidism (Cretinism)Congenital ToxoplasmosisFetal Alcohol Syndrome (FAS)
Human Immunodeficiency Virus type 1 (HIV-1)Rh IncompatibilitiesRubellaSyphilisPerinatal FactorsCytomegalovirus (CMV)Extreme Prematurity (1-1.5 lb. birth weight)
Perinatal Factors Hypoxic-ischemicencephalopathy Neural tube defect Placental dysfunction Tetrogens
Mild Intellectual Disability Largefamilial connection 85% of all persons with Intellectual Disabilities Combination of genetics and below averageenvironmental conditions Often non-organic etiologies
Limitationsare primarily manifested duringschool—may not be as readily apparent asadults Highly imitative, externally motivated Mild to moderate lag in behavioraldevelopment Intervention designed to teach functionalsocial, vocational and academic skills
Moderate, Severe, Profound Ratesabout equal across ethnic groups/socio-economiclevels Sibling IQ usually Average 15% of all persons with ID Due to single gene defects (Down Syndrome) Chromosomal abnormalities (Turner’s Syndrome) Typically have brain malformations stemming fromprenatal development Interventions designed to teach functional social, language,and self-help skills
Case StudiesMahliaWAIS-IVVABS-3Full Scale IQ72Composite78Verbal Comprehension64Communication66Perceptual Reasoning86Daily Living74Working Memory67Socialization83Processing Speed79
OscarWAIS-IVFull Scale IQABAS-369Composite72Verbal Comprehension 72Conceptual73Perceptual Reasoning61Social65Working Memory73Practical69Processing Speed70
LexisWAIS-IVFull Scale IQVABS-355Composite56Verbal Comprehension 64Communication72Perceptual Reasoning50Daily Living48Working Memory59Socialization51Processing Speed71
Comments and QuestionsMardis Dunham, Ph.D., ProfessorMurray State Universitymdunham@murraystate.eduKentucky Licensed PsychologistKentucky Certified School Psychologist
Wechsler Abbreviated Scale of Intelligence-2 (WASI-2) Shipley-2 Test of Nonverbal Intelligence (TONI) Raven’s P