Transcription
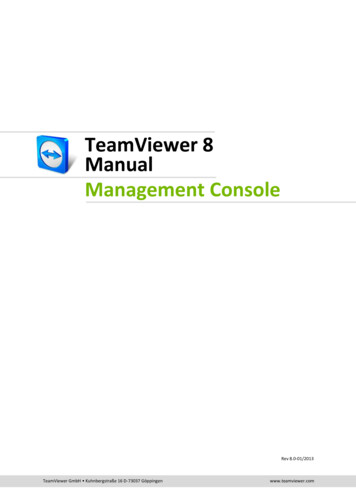
Q1 2021 Unaudited ResultsInvestor Presentation4 May 2021
Important NoticeThis presentation as well as any information communicated in connection therewith (the "Presentation") contains information regarding TeamViewer AG (the "Company") and its subsidiaries (the Company, together with its subsidiaries, "TeamViewer").It is being provided for informational purposes only and should not be relied on for any purpose and may not be redistributed, reproduced, published, or passed on to any other person or used in whole or in part for any other purpose.All stated figures are unaudited.Certain statements in this presentation may constitute forward looking statements. These statements are based on assumptions that are believed to be reasonable at the time they are made, and are subject to significant risks and uncertainties,including, but not limited to, those risks and uncertainties described in TeamViewer's disclosures. You should not rely on these forward-looking statements as predictions of future events, and we undertake no obligation to update or revise thesestatements. Our actual results may differ materially and adversely from any forward-looking statements discussed in these statements due to several factors, including without limitation, risks from macroeconomic developments, external fraud, lack ofinnovation capabilities, inadequate data security and changes in competition levels.The Company undertakes no obligation, and does not expect to publicly update, or publicly revise, any forward-looking statement, whether as a result of new information, future events or otherwise. All subsequent written and oral forward-lookingstatements attributable to it or to persons acting on its behalf are expressly qualified in their entirety by the cautionary statements referred to above and contained elsewhere in this Presentation.This document contains certain alternative performance measures (collectively, “APMs”) including billings and Adjusted EBITDA that are not required by, or presented in accordance with, IFRS, German GAAP or any other generally accepted accountingprinciples. TeamViewer presents APMs because they are used by management in monitoring, evaluating and managing its business and management believes these measures provide an enhanced understanding of TeamViewer’s underlying resultsand related trends. The definitions of the APMs may not be comparable to other similarly titled measures of other companies and have limitations as analytical tools and should, therefore, not be considered in isolation or as a substitute for analysis ofTeamViewer’s operating results as reported under IFRS or German GAAP. APMs such as billings and Adjusted EBITDA are not measurements of TeamViewer’s performance or liquidity under IFRS or German GAAP and should not be considered asalternatives to results for the period or any other performance measures derived in accordance with IFRS, German GAAP or any other generally accepted accounting principles or as alternatives to cash flow from operating, investing or financingactivities.TeamViewer has defined each of the following APMs as follows:“Billings” represent the (net) value of goods and services invoiced to customers in a given period if realization is probable – it is defined as revenue adjusted for change in deferred revenue P&L-effective;“Adjusted EBITDA” means EBITDA, adjusted for P&L-effective changes in deferred revenue as well as for certain special items relating to share-based compensations and other material items that are not reflective of the operating performance of thebusiness.“Adjusted EBITDA margin” means adjusted EBITDA as a percentage of billings.This document also includes further certain operational metrics, such as Net Retention Rate, and additional financial measures that are not required by, or presented in accordance with IFRS, German GAAP or any other generally accepted accountingprinciples (collectively, “other financial measures”). TeamViewer presents these operational metrics and other financial measures for information purposes and because they are used by the management for monitoring, evaluating and managing itsbusiness. The definitions of these operational metrics and other financial metrics may not be comparable to other similarly titled measures of other companies and have limitations as analytical tools and should, therefore, not be considered in isolationor as a substitute for analysis of TeamViewer’s operating results, performance or liquidity as reported under IFRS or German GAAP.TeamViewer has defined these operational metrics and other financial measures for information purposes as follows:“Levered free cash flow” (FCFE) means net cash from operating activities less capital expenditure for property, plant and equipment and intangible assets (excl. M&A), payments for the capital element of leaseliabilities and interest paid for borrowings and lease liabilities; and„Net leverage“ means the ratio of net financial debt (sum of interest-bearing loans and borrowings, current and non-current, less cash and cash equivalents) to Adjusted EBITDA.“Net retention rate” or ”NRR” means annual recurring billings (renewals, up- & cross sell) attributable to retained subscribers (subscribers which had been subscribers in the previous 12-month period) of the last 12-month period divided by all annualrecurring billings of the previous 12-month period. TeamViewer amended the NRR definition with the beginning of FY 2021 to facilitate a direct derivation from reported annual recuring billings. For further explanation please refer to the appendix of thispresentation.The use by TeamViewer of any MSCI ESG research llc or its affiliates (“MSCI”) data, and the use of MSCI logos, trademarks, service marks or index names herein, do not constitute a sponsorship, endorsement, recommendation, or promotion ofTeamViewer by MSCI. MSCI services and data are the property of MSCI or its information providers and are provided “as-is” and without warranty. MSCI names and logos are trademarks or service marks of MSCI. In 2020, TeamViewer received a ratingof „AA“ (on a scale of AAA-CCC) in the MSCI ESG ratings assessment.Copyright 2020 Systainalytics. All rights reserved. This publications contains information developed by Systainalytics (www.systainalytics.com). Such information and data are proprietary of Systainalytics and/or its third-party suppliers (Third PartyData) and are provided for informational purposes only. They do not constitute an endorsement of any product or project, nor investment advice and are not warranted to be complete, timely, accurate or suitable for a particular purpose. Their use issubject to conditions available at https://www.systainalytics.com/legal-disclaimers. In December 2020, TeamViewer received an ESG Risk Rating of 15.6 and was assessed by Systainalytics to be at „Low Risk“ of experiencing material financial impactsfrom ESG factors.ISS ESG: In February 2020, TeamViewer has been awarded „Prime“ status with the ISS ESG Corporate Rating.In April 2020 TeamViewer has received an ESG rating score from Vigeo Eiris2TeamViewer Q1 2021 Unaudited Results - Investor Presentation
Business OverviewOliver Steil
Q1 2021 HighlightsPreparing the ground for long-term growth while delivering 26% cc1 billings growth and high profitabilityBeating Tough Q1 2020 CompStrategic Achievements Acquisition integrations well on track 146.6mBillings(Q1 2021, non-IFRS) 22% 26% cc1 100% NRR- Xaleon rolled out as TeamViewer Engage ESG embedded in financing strategy with 300m promissory note loan(Q1 2021, non-IFRS)1Growth4at constant currencies- Partnerships activated61.4%2 Year-on-year- New CMO on management board-0.3pp Serving over 2,000 enterprise customers withdigitalisation solutions across the value chaingrowth as of 31 March 2021, LTMTeamViewer Q1 2021 Unaudited Results - Investor Presentation 17% subscriber growth2- Leadership in AR-assisted workflows: globalfootprint with Upskill and Frontline Marketing and brand building strategy launchedAdj. EBITDAMarginAdditional Highlights Strong liquidity position Net leverage reduced to 1.6x
Over 2,000 enterprise customers with billings up 90% yoyQuality of client base steadily improving and successful retention of larger enterprisesEnterprise Customers (LTM)1Enterprise Billings ( m, LTM)2 74%Enterprise Billings by ACV (LTM) 10-50k 90%58.713%32%17%68% Added customers in attractivesectors of industrials, healthcare/lifescience, logistics31 Mar 2031 Mar 21 Continued progress with Core toTensor migration supporting ACVexpansion Further blue chip wins1Customers2Total5with invoiced billings across all products and services of at least 10,000 during the last twelve months (ACV or annual contract value)billings of all enterprise customersTeamViewer Q1 2021 Unaudited Results - Investor Presentation15%10%31.031 Mar 21 200k9%2,05831 Mar 20 100k41%9%1,183 50k31 Mar 2059%31 Mar 21 Portion of contracts with ACVs 50k on the rise Increasing number of 200k contracts due tosuccessful up- and cross selling
Trend towards higher ACVs in the enterprise segment driven by newbusinesses, high retention and strong upsellingSectorCountryACV in LicenseUse CasesIndustrialsGermany 200kTensorGroup wide remote support for security systems in buildings with 14,000 managed devicesIndustrialsFrance 200kTensor/PilotSupporting sales representatives; AR-based support of field techniciansLogisticsUSA 100kTensorRemote control of refrigeration systems in distribution centersAgricultureFrance 100kTensorRemote support & maintenance for more than 500 users of farming softwareEducation ServicesUSA 50kTensorRemote support to users of an online education platform as well as employeesTechnology HardwareGermany 50kFrontlineAR-based remote support and troubleshooting for water treatment systemsFinancial ServicesUSA 50kTensorInternal IT support with high security feautres (SSO) as well as MS Intune & Teams integrationIndustrialsSwitzerland 50kTensorGroup-wide remote support solution meeting high security and integration requirementsLife ScienceUSA 50kTensorRemote access for scientific devices, internal IT support and working from homeMaterialsSweden 50kFrontlineAR-based remote support in the event of a machine breakdown as well as general maintenanceHealthcareUSA 50kTensorRemote support for employees working from homeLogisticsUSA 50kFrontlineAR-support to optimize the receiving process in warehousesIndustrialsChina 50kFrontline/Tensor AR-based guidance for automobile repairs and spare parts pickingTMTJapan 50kFrontlineSelection of Q1 2021 deals6TeamViewer Q1 2021 Unaudited Results - Investor PresentationEnhanced customer engagement and quoting processes through AR
Smart factory use cases digitalize the enterprise value chainWorld-leading manufacturer for electronic devicesAR-powered remote customer training and guidance for industrialautomation systems incl. industrial control systems, drives, and robotsMitsubishi Electric Europe B.V. CEE division of Mitsubishi’selectronic equipment divisionDiverse customer base incl. leading manufacturers from the food,aerospace and automotive industriesEnhanced support experience and repair processes reducedowntime of business-critical factory equipmentBühler Group production lines ensure food supply for two billion peopleA global manufacturer ofequipment and processtechnology for the food,feed and mobility industrieswith more than 12,000employees worldwideDigitalisation of support processes: remote maintenance andcommissioning of machinesAR-based knowledge transfer and trainings using smart glasses atplants and construction sitesReducing machine downtime and higher customer satisfactionvia real-time supportBühler picture source: www.buhlergroup.com7TeamViewer Q1 2021 Unaudited Results - Investor Presentation
ESG at the core of our solutions portfolio and strategyOur accomplishments drive us to improve even further Our platform connects people worldwide and free of charge Our solutions support businesses in their efforts to digitalization and efficiency Using our products reduces travel and enables companies to limit their carbonfootprint and thus contributes to avoid 37 megatons of CO2e emissions per year1Defined environmental and diversity goals partially achievedEnvironmental goals20192020CO2e emissions (t) / employee47.03.3CO2e emissions (t) / m revenue5241213Target- 50% by 2025vs. 2019- 50% by 2030vs. 2019 Embedded ESG in financing strategy with ESG-linked promissory note loan Promoting a diverse workplace with equal opportunities- 91% employee retention in 20202- 34% female ratio and gender pay equality3- Staff of over 70 nationalitiesWomen in management positionsTodayManagement Board33%25% by 2023Supervisory Board0%33% by 2023 29%33% by 2024GroupProgress already reflected in favorable ESG ratings by various agencies615.6 Low Risk1Regardinga study conducted by the renowned sustainability experts of the DFGE research institute in 2020retention increased by 5%-points in 2020 398.8%% equality amongst largest TeamViewer employee groups: inside sales representatives, software developers and customer support specialists4GHG scope 1 and 2 emissions as well as operational scope 3 emissions development per FTE against 2019 5GHG scope 1, 2 and 3 (full) emissions development per million EUR against 2019 6See disclaimer on page 22Employee8TeamViewer Q1 2021 Unaudited Results - Investor PresentationTarget
Financial OverviewStefan Gaiser
22% yoy and 26% cc billings growth with 100% net retention rateFX effects carrying into Q1 2021Billings by Category ( m) & Net Retention Rate (LTM) 30% 33%cc376.1119.70.1110.10.7 22% 26%cc487.13.0122.2146.61.026.7 NRR amended – now derived from reportedgross billings NRR calculated as retained billings in theLTM period divided by total recurring billingsin the previous LTM period 1 NRR of 100% (LTM Q1 2021):374.038.7- FX impact of (3pp)253.3118.9- Gross-value churn compensated byexpansion80.9Q1 20Retained1Previously10LTM Q1 20Q1 21NewLTM Q1 21Non-Recurringbased on billings net of payment defaults. See comparison to previously disclosed net retention rates and billings categories and definitions in the appendixTeamViewer Q1 2021 Unaudited Results - Investor Presentation
Tough Q1 2020 comp beat with well-balanced performance acrossregions and sales channels AMERICASEMEAAPACQ1 2021 BillingsQ1 2021 BillingsQ1 2021 Billings 44.9m 86.7m 14.9m 18% 28% cc 26% 27% cc 17% 17% ccGood performance across all sales channelsSuccessful retention and capacityadjustments as expectedToughest comp given full quarter2020 lock-down impact(except Japan)Upskill acquisition strengthens enterprisesales for enhanced pipeline building andacceleration of up- & cross sell11TeamViewer Q1 2021 Unaudited Results - Investor PresentationLargest enterprise dealnow above 1m ACVGood enterprise pipeline build.Marketing step-up required
resulting in strong group billings growth and best-in-class adj. EBITDAmargin, while investments in future growth continued mQ1 21Q1 20 Billings146.6119.7 22%Cost of sales(10.2)(7.8)(6.5%) 31% Q1 2021 billings up 26% at constant currenciesGross profit136.4111.9 22% Gross profit margin stable and well above 90%Sales(16.4)(12.7) 29% Continued investments across all functions, with focus onmarketingMarketing(11.0)(6.9) 59% Scale effects within G&AR&D(9.1)(7.4) 22% Lower bad debt expenses due to improved processes andreceivables agingG&A(6.6)(6.1)Other1(3.3)(4.9)Total Opex(46.3)(38.1)(31.8%) 22%Adj. EBITDA90.073.9 22%61.4%61.7%-0.3pp% of billings% Margin% of billings% of billings(4.5%)% of billings(2.2%)% of billings12(7.5%)(6.2%)% of billings1Incl.93.0%(11.2%)% of billings% 4.1%)other income/expenses and bad debt expenses of 4.5m in Q1 2021 and 5.2m in Q1 2020TeamViewer Q1 2021 Unaudited Results - Investor Presentation-0.5pp 8%-33%
Continued strong Levered Free Cash FlowLevered Free Cash Flow ( m) and Cash ConversionQ1 21Q1 20 46.662.8-26%(12.6)(8.1)55%Capital expenditure (excl. M&A)(3.9)(5.2)-25%Lease repayments(1.1)(1.0)14%Interest paid for borrowings and lease liabilities(4.0)(13.3)-70%Levered Free Cash Flow (FCFE)25.035.2-29%as % of adj. EBITDA28%48%as % of EBITDA62%75%Pre-Tax net cash from operating activities (IFRS)Income tax paid13TeamViewer Q1 2021 Unaudited Results - Investor Presentation Operational cash flow impacted by changes in other networking capital including marketing prepayment Levered free cash flow excludes Xaleon and Upskillacquisitions as well as cash flow from net borrowings
Strong liquidity positionAcquisitions funded with operating cash flow. New debt raised to fund future growth and repay RCFDevelopment of cash & cash equivalents in Q1 2021 ( m) 400m debt raised and 52.7m RCF drawing repaid14TeamViewer Q1 2021 Unaudited Results - Investor Presentation
Debt diversified and maturities extended with promissory note loanSlight reduction in net leverage to 1.6x of LTM adjusted EBITDADevelopment of gross & net financial debt ( m) 1Maturity profile ( .6x495.1431193459.710011 Carrying2 2031 Dec34valuesnotional / repayment amounts3 150m undrawn RCF not shown under syndicated facilities31 Mar6 215xNet Leverage2 Debt15TeamViewer Q1 2021 Unaudited Results - Investor Presentation7222222202120222023Cash & Cash Equiv.Net Financial Debt222024IFRS 16 LeasesSyndicated Facilities20252026 2026Promissory Note LoanBilateral Facility
2021 outlook confirmed after strong Q1Strategic initiatives and marketing partnerships to underpin long-term growth with 50% marginsOutlook 20212023 ObjectiveLong-term AmbitionBillings 585 – 605m 1,000mGrow 25% p.a. after 2023Revenue 525 – 540mAround 50% until 2023Margin expansion potential from2024 due to scale effects(non-IFRS)(IFRS)Adj. EBITDA Margin(non-IFRS, as % of Billings)49 – 51% 2021 outlook assumes USD/EUR exchange rate of 1.20 and broadly stable other currencies Deferred revenue from record Q1 billings to be largely released to revenue during the remainder of the year Updated 2021 adj. EBITDA margin outlook solely due to marketing partnerships16TeamViewer Q1 2021 Unaudited Results - Investor Presentation
Q&A
Thank you for your attention!5 MayRoadshow (Morgan Stanley)19 - 20 MayCommerzbank European Conference, USA15 JunAnnual General Meeting3 AugQ2 2021 Results
Appendix
Billings categories definitions: comparative viewPrevious DefinitionsOLDRenewal Billings: Billings from subscription renewals and up- & cross sell to all subscribers.Migration Billings: Billings from new subscription sales to perpetual license customers.New Billings: Billings from new subscription sales.Other Billings: Billings from perpetual license sales, OEM subscription licenses, professionalservices and hardware reselling.Net Retention Rate: Annual recurring billings of existing subscription customers during theperiod considered less gross value churn plus billings from upselling and cross-selling,including foreign exchange effects and expiring discounts, as a percentage of annualrecurring billings in the previous period (based on billings net of payment defaults).Billings ( m)New DefinitionsRetained Billings: Annual recurring billings (renewals, up- & cross sell) attributable to retainedsubscribers which were subscribers in the previous 12-month period.New Billings: Annual recurring billings attributable to new subscribersNon-Recurring: Billings: All billings that do not recur annually such as professional servicesand hardware reselling.Net Retention Rate: Retained billings of the last 12-month period divided by all annualrecurring billings of the previous 12-month period.Billings ( m) 42% 104%Q4 19 LTMQ4 20 LTMQ4 19 LTMQ4 20 LTMTeamViewer Q1 2021 Unaudited Results - Investor 36.0319.020Amended
Q1 2021 reconciliation from management key metrics to IFRS mBillings / RevenueManagement viewadjusted P&L1Change indeferred revenue2146.6(28.2)Cost of sales(10.2) / (7.0%)Gross profit136.4% marginD&AOther non-IFRSadjustmentsAccounting viewIFRS P&L1118.3(8.0)(0.1)(18.3) / (15.5%)100.0Sales93.0%(16.4) / (11.2%)(1.6)(6.6)84.5%(24.6) / (20.8%)Marketing(11.0) / (7.5%)(0.3)(1.7)(13.0) / (11.0%)R&D(9.1) / (6.2%)(1.5)(3.3)(13.8) / (11.7%)G&A(6.6) / (4.5%)(0.6)(6.6)(13.7) / (11.6%)Other3(3.3) / (2.3%)(2.8)(6.1) / (5.1%)Adj. EBITDA90.0% margin61.4%D&A (ordinary only)4(4.8)4Adj. EBIT / Operating profit (EBIT)85.2% margin58.1%D&A (total4 5)EBITDA(7.1)5(21.1)28.824.3%11.940.7% margin34.4%1Marginsand percentages of billings in adjusted view and IFRS revenuechange in undue billingsother income/expenses and bad debt expenses of 4.5m in Q1 20214D&A excl. amortization intangible assets from PPA5Amortization intangible assets from PPA2Included3Incl.21(28.2)TeamViewer Q1 2021 Unaudited Results - Investor Presentation
Deferred revenue and non-IFRS adjustments in EBITDADeferred revenue adjustmentsOther non-IFRS adjustments mQ1 21Q1 20 mQ1 21Q1 20Billings146.6119.7Total IFRS 2 charges(15.0)(10.1)TeamViewer LTIP(0.9)(0.1)M&A related share-basedcompensation(7.2)-Share-based compensation by TLO(6.9)(10.0)(3.3)-Financing, M&A, transaction-related(1.3)-Other(2.0)-Valuation effects in financial result(2.8)-Total(21.1)(10.1)Perpetual def. revenueRelease / (Addition)Subscription def. revenueRelease / (Addition)1.717.4(14.8)(21.5)Unallocated def. revenueRelease / (Addition)(15.2)(12.9)Revenue118.3102.7Other material items Perpetual deferred revenue now largely released with 0.9m remaining onbalance sheet (see next page) M&A related and TLO share-based compensation not dilutive to share countand not cash relevant Unallocated deferred revenue of 15.2m mainly consists of the increase ofundue billings during the quarter which are not yet recognizable asreceivables under IFRS 15 Valuation effects relate to a negative mark-to-market effect of hedginginstruments22TeamViewer Q1 2021 Unaudited Results - Investor Presentation
Deferred revenue developmentPerpetual deferred revenue from previous license sales model largely releasedQ1 21Q1 202.648.9(–) Release1.717.5( ) Addition0.00.10.931.4212.5164.0(–) Release131.898.1( ) Addition146.6119.6Subscription deferred revenue (EoP)227.3185.5Total deferred revenue (BoP)215.2212.8(–) Release133.5115.6( ) Addition146.6119.7228.3216.9 mPerpetual deferred revenue (BoP)Perpetual deferred revenue (EoP)Subscription deferred revenue (BoP)Total deferred revenue (EoP)23TeamViewer Q1 2021 Unaudited Results - Investor Presentation
Profit & Loss Statement(unaudited) thousandQ1 2021Q1 2020 %RevenueCost of salesGross profitSalesMarketingR&DG&ABad debt expensesOther incomeOther expensesOperating ProfitFinance incomeFinance costsForeign exchange incomeForeign exchange costsProfit before taxationIncome taxesProfit / (loss) for the 13%57%50%46%7%-13% 100% % 9180.02200,000,0000.06200,000,0000.06Basic number of shares issued and outstandingEarnings per share (in per share)Diluted number of shares issued and outstandingDiluted earnings per share (in per share)24TeamViewer Q1 2021 Unaudited Results - Investor Presentation-67%-67%
Balance Sheet(unaudited) thousand31 March 202131 December 2020Goodwill665,076646,793Intangible assets268,074255,33043,32940,4694,5164,516Other assets966857Deferred tax assets159159982,119948,124Trade receivables18,05519,667Other 7115,3011,472,1061,063,425Non-current assetsProperty, plant and equipmentFinancial assetsTotal non-current assetsCurrent assetsTax assetsFinancial assetsCash and cash equivalentsTotal current assetsTotal assets25TeamViewer Q1 2021 Unaudited Results - Investor Presentation
Balance Sheet (cont’d)(unaudited) thousand31 March 202131 December 6,898(326,854)(61)(343)240,711ProvisionsFinancial liabilitiesDeferred revenueDeferred and other liabilitiesOther financial liabilitiesDeferred tax liabilitiesTotal non-current 3440,1533611,614029,186471,747ProvisionsFinancial liabilitiesTrade payablesDeferred revenueDeferred and other liabilitiesOther financial liabilitiesTax liabilitiesTotal current liabilitiesTotal liabilitiesTotal equity and ,120294,378350,966822,7141,063,425EquityIssued capitalCapital reserve(Accumulated losses)/retained earningsHedge reserveForeign currency translation reserveTotal equity attributable to owners of the parentNon-current liabilitiesCurrent liabilities26TeamViewer Q1 2021 Unaudited Results - Investor Presentation
Cash Flow Statement(unaudited) thousandQ1 2021Q1 9Expenses for equity settled share-based compensationNet financial costsChange in deferred revenueChanges in other net working capital and otherIncome tax paidNet cash from operating 0,1338,0914,1233,682(8,104)54,717Proceeds from the sale of property, plant and equipmentPayments for the acquisition of non-current financial assetsAcquisition of subsidiariesNet cash used in investing (5,205)Cash flows from operating activitiesProfit before taxationDepreciation, amortisation and impairment of non-current assets(Gain)/loss from the sale of property, plant and equipmentIncrease/(decrease) in provisionsNon-operational foreign exchange (gains)/lossesCash flows from investing activitiesCapital expenditure for property, plant and equipment and intangible assets27TeamViewer Q1 2021 Unaudited Results - Investor Presentation
Cash Flow Statement (cont’d)(unaudited) thousandQ1 2021Q1 2020Repayments of borrowings(52,730)0Proceeds from bank borrowings400,0000Payments for the capital element of leaseliabilities(1,107)(967)Interest paid for borrowings and leaseliabilities(3,975)(13,349)Net cash used in financing activities342,188(14,316)Net change in cash and cash equivalents353,21335,195Net foreign exchange rate difference1,516453Net change from cash risk sh flows from financing activitiesCash and cash equivalents at beginning of periodCash and cash equivalents at end of period28TeamViewer Q1 2021 Unaudited Results - Investor Presentation
8 TeamViewer Q1 2021 Unaudited Results - Investor Presentation ESG at the core of our solutions portfolio and strategy 1Regarding a study conducted by the renowned sustainability experts of the DFGE research institute in 2020 2Employee retention increased by 5%-points in 2020 398.8%% equality amongst largest TeamViewer employee groups: inside sales representatives, software developers and .