Transcription
bit.ly/Hancock-ICOTS2018Infusing Data Visualization intoIntro Stat Using TableauStacey HancockDepartment of Mathematical Sciences, MSUInternational Conference on Teaching StatisticsKyoto, JapanJuly 13, 2018
Outline Why data visualization in the intro course? Why Tableau in the intro course? Tableau activity Assessment and results Improvements and next stepsbit.ly/Hancock-ICOTS2018
GAISE College Reportbit.ly/Hancock-ICOTS20181. Teach statistical thinking. Teach statistics as an investigative process of problem-solving and decisionmaking. Give students experience with multivariable thinking.2.3.4.5.6.Focus on conceptual understanding.Integrate real data with a context and purpose.Foster active learning.Use technology to explore concepts and analyze data.Use assessments to improve and evaluate student learning.
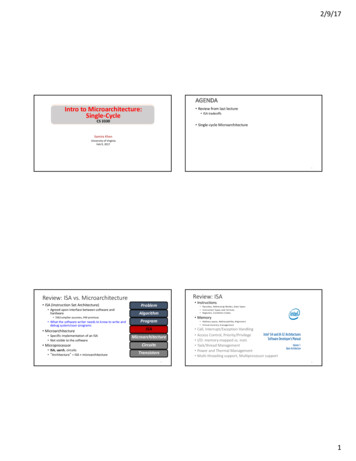
bit.ly/Hancock-ICOTS2018NOV 8, 2017A state legislator in a guest column writes:“A scatter-plot graph of tuition versus graduation rates in the50 states reveals a strong correlation–low tuition is associatedwith low graduation rates, high with high The clear expectation is that taxpayers should fork overescalating amounts to keep tuition low [but] low tuitionspurs a high dropout rate.” (emphasis added)
bit.ly/Hancock-ICOTS2018Graduation Rate vs In-State TuitionGraduation Rate (%)1007550Data source:U.S. Department ofEducation NationalCenter forEducation Statisticshttps://nces.ed.gov25020000In State Tuition ( )40000
bit.ly/Hancock-ICOTS2018Graduation Rate vs In-State Tuition100Graduation Rate (%)MSU7550Data source:U.S. Department ofEducation NationalCenter forEducation Statisticshttps://nces.ed.gov25020000In State Tuition ( )40000
bit.ly/Hancock-ICOTS2018Graduation Rate vs In-State Tuition100Graduation Rate (%)MSU755025020000In State Tuition ( )40000
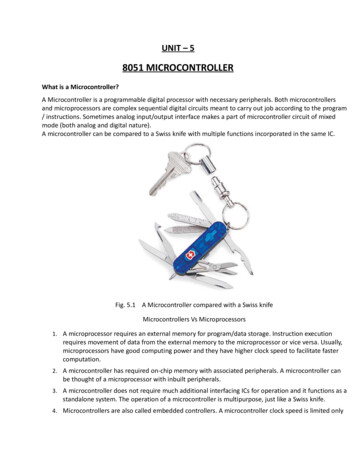
Graduation Rate vs In-State Tuition by Type of Institutionbit.ly/Hancock-ICOTS2018100Graduation Rate (%)75TypePublicPrivate Non-profitPrivate For-profit5025020000In State Tuition ( )40000
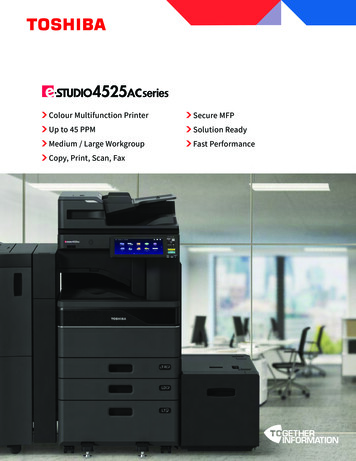
Graduation Rate vs In-State Tuition by Math SAT Scorebit.ly/Hancock-ICOTS2018100Graduation Rate (%)75SATBelow 500500-650Above 6505025020000In State Tuition ( )40000
bit.ly/Hancock-ICOTS2018Why Data Visualization in the Intro Course? easily investigate causal claims in the news! multivariable thinking in the first week explore “real data with a context and purpose” component of data literacy
Why Tableau?bit.ly/Hancock-ICOTS2018 powerful and authentic free for academic use drag-and-drop interface that facilitates data exploration produces quality graphics without requiring programming skills requires minimal training in how to use the software provides a platform for sharing work (Tableau Public)
bit.ly/Hancock-ICOTS2018Intro Stat at Montana State University Flipped format Students working in groups of three, tables of nine Simulation-based curriculum (Tintle et al.) About 20-25 sections of 40 students each eal.htm
Tableau Activity (Fall 2017)bit.ly/Hancock-ICOTS2018One 75-minute class period:1. Classroom discussion of data visualization in the news (10 min)2. Instructor demo of Tableau (10 min)3. Activity (60 min): Current Population Survey data with step-by-step instructions Roller Coaster data4. Instructor wrap-up (5 min)
bit.ly/Hancock-ICOTS20181. What are the observational units inthese data?2. What are the variables or summarymeasures displayed in the plot andwhat “graphical perception tasks”(Cleveland, 1994) are used for eachvariable, e.g., position, area, angle?What are the variable types(quantitative or categorical)?3. What would the data set look like in aspreadsheet?4. What is the overall message theauthor is attempting to communicatethrough the visualization?5. What comparisons are easy to makeusing this data visualization? Hard tomake?6. How could we improve thisvisualization?http://nyti.ms/2pC2HZvBergen, S. USCOTS 2017
Current Population Survey Databit.ly/Hancock-ICOTS2018 Mix of categorical and quantitative variables, e.g., hourly wage (USdollars per hour), number of years of education, sex, age (years),sector of the economy (sales, clerical, etc.) Wang, Rush & Horton (2017) describe data visualization activity usingthese data with R and R Studio Use this data set to give step-by-step instructors for different types ofplots in Tableau
Roller Coaster Databit.ly/Hancock-ICOTS2018 Sample of 157 roller coasters in the US that opened between 1915 and 2016 15 Variables: Coaster, Park, City, State, Type, Design, Year Opened, Top Speed,Max Height, Drop, Length, Duration, Inversions?, # of Inversions, Age Group Data from Roller Coaster DataBase (https://rcdb.com/) andhttps://www.UltimateRollerCoaster.com/ Some activity questions from ESTEEM: Enhancing Statistics TeacherEducation with E-Modules (http://hirise.fi.ncsu.edu/project/esteem/) Activity worksheet posted uActivityS18.pdf
Roller Coaster Databit.ly/Hancock-ICOTS20181. How fast is the fastest roller coaster? What is the name of this roller coaster?2. Do newer roller coasters seem to have higher top speed than older ones? Create adata visualization that answers this question.3. Are newer roller coasters more likely to be made of steel than older ones? Whatabout roller coasters with a high top speed?4. Is there a relationship between top speed and maximum height? Describe thisrelationship.5. Investigate some other factors that you think might have a relationship with topspeed. Create a Dashboard comprised of data visualizations which you thinksummarize the relationship between top speed and at least two other variables thatseem to be related to top speed. Add text to the Dashboard and write a fewsentences describing what you find.
Assessmentbit.ly/Hancock-ICOTS2018Student learning: Tableau questions on most homework assignments Tableau visualization given on exams Course projectTableau activity: Fall 2017: Online student survey in week 14 (one 1 section) Spring 2018: Pre- and post-activity online student survey (all sections)
bit.ly/Hancock-ICOTS2018
bit.ly/Hancock-ICOTS2018
Qualitative Resultsbit.ly/Hancock-ICOTS2018 Student feedback in fall 2017 mixed only 4 of 34 agreed that Tableau had enhanced their understanding ofstatistics several commented that Tableau helped make data easier to interpret andgave them a better understanding of how to visualize data need more time in-class, guidance, and practice with the software Spring 2018 enjoyed working in a team on activity valued instructor guidance throughout activity viewed activity as a good introduction to visualizing data
Improvements in Spring 2018bit.ly/Hancock-ICOTS2018 Two class days for activity:Day 1: Basic descriptive statistics and plots, instructor demo of Tableau;Day 2: Tableau activity with CPS and roller coaster data Revisit Tableau often (in-class activities, homework assignments, classproject)
bit.ly/Hancock-ICOTS2018Thank /
ReferencesBergen, S., & Iverson, T. (2017, May). Web Scraping and Data Visualization with Python and Tableau.Workshop presented at the United States Conference on Teaching Statistics, State College, PA.Bui, Q. (2016, August 18). More Older People Are Finding Work, but What Kind? Retrieved Nov 9,2017, from: http://nyti.ms/2pC2HZv.Cleveland, W. (1994). The Elements of Graphing Data. Summit, NJ: Hobart Press.GAISE College Report ASA Revision Committee, “Guidelines for Assessment and Instruction inStatistics Education College Report 2016,” http://www.amstat.org/education/gaise.Tintle, N. L., Chance, B. L., Cobb, G. W., Rossman, A. J., Roy, S., Swanson, T. M., & VanderStoep, J. L.(2016). Introduction to Statistical Investigations. Hoboken: Wiley.Wang, X., Rush, C., Horton, N. J. (2017). Data visualization on day one: Bringing big ideas into introstats early and often, Technology Innovations in Statistics Education, 10(1).
powerful and authentic free for academic use drag-and-drop interface that facilitates data exploration produces quality graphics without requiring programming skills requires minimal training in how to use the software provides a platform for sharing work (Tableau Public) bit.ly/Hancock-ICOTS2018 Intro Stat at Montana State University