Transcription
SAS Manual ForIntroduction tothe Practice of StatisticsThird EditionMichael EvansUniversity of Toronto
ii
ContentsPrefaceIixSAS Language11 Overview and Conventions . . . . . . . . . . . . . .2 Accessing and Exiting SAS . . . . . . . . . . . . .3 Getting Help . . . . . . . . . . . . . . . . . . . . .4 SAS Programs . . . . . . . . . . . . . . . . . . . .5 Data Step . . . . . . . . . . . . . . . . . . . . . . .5.1 Form and Behavior of a Data Step . . . . .5.1 SAS Constants, Variables, and Expressions .5.3 Input . . . . . . . . . . . . . . . . . . . . .5.4 Output . . . . . . . . . . . . . . . . . . . .5.5 Control Statements . . . . . . . . . . . . . .6 SAS Procedures . . . . . . . . . . . . . . . . . . .6.1 PROC PRINT . . . . . . . . . . . . . . . .6.2 PROC SORT . . . . . . . . . . . . . . . . .7 Exercises . . . . . . . . . . . . . . . . . . . . . . . .II.SAS Procedures for Data Analysis1 Looking at Data: Distributions1.1 Tabulating and Summarizing Data . . . . . . . . . . .1.1.1 PROC FREQ . . . . . . . . . . . . . . . . . . .1.1.2 Calculating the Empirical Distribution Function1.1.3 PROC MEANS . . . . . . . . . . . . . . . . . .iii34791314151727323737384143.4546464950
ivCONTENTS1.21.31.41.51.1.4 PROC UNIVARIATEGraphing Data . . . . . . . .1.2.1 PROC CHART . . . .1.2.2 PROC TIMEPLOT . .Graphing Using SAS/Graph .1.3.1 PROC GCHART . . .Normal Distribution . . . . .1.4.1 Normal Quantile PlotsExercises . . . . . . . . . . . .2 Looking at Data: Relationships2.1 Relationships Between Two Quantitative Variables2.1.1 PROC PLOT and PROC GPLOT . . . . .2.1.2 PROC CORR . . . . . . . . . . . . . . . . .2.1.3 PROC REG . . . . . . . . . . . . . . . . . .2.2 Relationships Between Two Categorical Variables .2.3 Relationship Between a CategoricalVariable and a Quantitative Variable . . . . . . . .2.3.1 PROC TABULATE . . . . . . . . . . . . . .2.4 Exercises . . . . . . . . . . . . . . . . . . . . . . . .3 Producing Data3.1 PROC PLAN . . . . . . . . . . . .3.2 Sampling from Distributions . . . .3.3 Simulating Sampling Distributions3.4 Exercises . . . . . . . . . . . . . . .4 Probability: The Study of Randomness4.1 Basic Probability Calculations . . . . . . . . . . . .4.2 Simulation . . . . . . . . . . . . . . . . . . . . . . .4.2.1 Simulation for Approximating Probabilities .4.2.2 Simulation for Approximating Means . . . .4.3 Exercises . . . . . . . . . . . . . . . . . . . . . . . .566060656667676969.737373788387. . . . . . 90. . . . . . 91. . . . . . 94.979899101102.105. 105. 107. 107. 108. 1095 From Probability to Inference1135.1 Binomial Distribution . . . . . . . . . . . . . . . . . . . . . . . 1135.2 Control Charts . . . . . . . . . . . . . . . . . . . . . . . . . . 1155.2.1 PROC SHEWHART . . . . . . . . . . . . . . . . . . . 115
CONTENTSv5.3 Exercises . . . . . . . . . . . . . . . . . . . . . . . . . . . . . . 1196 Introduction to Inference6.1 z Intervals and z tests . . . . . . .6.2 Simulations for Confidence Intervals6.3 Simulations for Power Calculations6.4 Chi-square Distribution . . . . . . .6.5 Exercises . . . . . . . . . . . . . . .135. 135. 136. 139. 140. 143. 1448 Inference for Proportions8.1 Inference for a Single Proportion . . . . . . . . . . . . . . .8.2 Inference for Two Proportions . . . . . . . . . . . . . . . . .8.3 Exercises . . . . . . . . . . . . . . . . . . . . . . . . . . . . .147. 147. 149. 1529 Inference for Two-way Tables9.1 PROC FREQ with Nontabulated Data . . . . . . . . . . . .9.2 PROC FREQ with Tabulated Data . . . . . . . . . . . . . .9.3 Exercises . . . . . . . . . . . . . . . . . . . . . . . . . . . . .153. 153. 156. 15710 Inference for Regression10.1 PROC REG . . . . . . . . . . . . . . . . . . . . . . . . . .10.2 Example . . . . . . . . . . . . . . . . . . . . . . . . . . . . .10.3 Exercises . . . . . . . . . . . . . . . . . . . . . . . . . . . . .159. 159. 161. 16511 Multiple Regression11.1 Example Using PROC REG . . . . . . . . . . . . . . . . . .11.2 PROC GLM . . . . . . . . . . . . . . . . . . . . . . . . . . .11.3 Exercises . . . . . . . . . . . . . . . . . . . . . . . . . . . . .167. 167. 170. 172.123123126128131133.7 Inference for Distributions7.1 Student Distribution . .7.2 The t Interval and t Test7.3 The Sign Test . . . . . .7.4 PROC TTEST . . . . .7.5 F Distribution . . . . . .7.6 Exercises . . . . . . . . .
viCONTENTS12 One-way Analysis of Variance17312.1 Example . . . . . . . . . . . . . . . . . . . . . . . . . . . . . . 17412.2 Exercises . . . . . . . . . . . . . . . . . . . . . . . . . . . . . . 17813 Two-way Analysis of Variance18113.1 Example . . . . . . . . . . . . . . . . . . . . . . . . . . . . . . 18113.2 Exercises . . . . . . . . . . . . . . . . . . . . . . . . . . . . . . 18714 Nonparametric Tests14.1 PROC NPAR1WAY . . . . . . . . . . . .14.2 Wilcoxon Rank Sum Test . . . . . . . . .14.3 Sign Test and Wilcoxon Signed Rank Test14.4 Kruskal-Wallis Test . . . . . . . . . . . . .14.5 Exercises . . . . . . . . . . . . . . . . . . .18918919019219319415 Logistic Regression19715.1 Logistic Regression Model . . . . . . . . . . . . . . . . . . . . 19715.2 Example . . . . . . . . . . . . . . . . . . . . . . . . . . . . . . 19815.3 Exercises . . . . . . . . . . . . . . . . . . . . . . . . . . . . . . 202IIIAppendicesA Operators and Functions in the Data StepA.1 Operators . . . . . . . . . . . . . . . . . .A.1.1 Arithmetic Operators . . . . . . . .A.1.2 Comparison Operators . . . . . . .A.1.3 Logical Operators . . . . . . . . . .A.1.4 Other Operators . . . . . . . . . .A.1.5 Priority of Operators . . . . . . . .A.2 Functions . . . . . . . . . . . . . . . . . .A.2.1 Arithmetic Functions . . . . . . . .A.2.2 Truncation Functions . . . . . . . .A.2.3 Special Functions . . . . . . . . . .A.2.4 Trigonometric Functions . . . . . .A.2.5 Probability Functions . . . . . . . .A.2.6 Sample Statistical Functions . . . .A.2.7 Random Number Functions . . . .205.207. 207. 207. 208. 208. 208. 208. 209. 209. 209. 210. 210. 210. 211. 212
CONTENTSviiB Arrays in the Data StepC PROC IMLC.1 Creating Matrices . . . . . . . . . . . . . . . . . . . .C.1.1 Specifying Matrices Directly in IML ProgramsC.1.2 Creating Matrices from SAS Data Sets . . . .C.1.3 Creating Matrices from Text Files . . . . . . .C.2 Outputting Matrices . . . . . . . . . . . . . . . . . .C.2.1 Printing . . . . . . . . . . . . . . . . . . . . .C.2.2 Creating SAS Data Sets from Matrices . . . .C.2.3 Writing Matrices to Text Files . . . . . . . . .C.3 Matrix Operations . . . . . . . . . . . . . . . . . . .C.3.1 Operators . . . . . . . . . . . . . . . . . . . .C.3.2 Matrix-generating Functions . . . . . . . . . .C.3.3 Matrix Inquiry Functions . . . . . . . . . . . .C.3.4 Summary Functions . . . . . . . . . . . . . . .C.3.5 Matrix Arithmetic Functions . . . . . . . . . .C.3.6 Matrix Reshaping Functions . . . . . . . . . .C.3.7 Linear Algebra and Statistical Functions . . .C.4 Call Statements . . . . . . . . . . . . . . . . . . . . .C.5 Control Statements . . . . . . . . . . . . . . . . . . .C.6 Modules . . . . . . . . . . . . . . . . . . . . . . . . .C.7 Simulations Within IML . . . . . . . . . . . . . . . .213.217. 217. 217. 218. 220. 220. 220. 221. 221. 222. 222. 227. 229. 230. 230. 231. 232. 236. 238. 242. 243D Advanced Statistical Methods in SAS245E References247Index249
viiiCONTENTSstuff
PrefaceThis SAS manual is to be used with Introduction to the Practice of Statistics, Third Edition, by David S. Moore and George P. McCabe, and to theCD-ROM that accompanies this text. We abbreviate the textbook title asIPS.SAS is a sophisticated computer package containing many components.The capabilities of the entire package extend far beyond the needs of anintroductory statistics course. In this book we present an introduction to SASthat provides you with the skills necessary to do all the statistical analysesasked for in IPS and also sufficient background to use SAS to do many ofthe analyses you might encounter throughout your undergraduate career.While the manual’s primary goal is to teach SAS, more generally we want tohelp develop strong data analytic skills in conjunction with the text and theCD-ROM.The manual is divided into three parts. Part I is an introduction thatprovides the necessary details to start using SAS and in particular discusseshow to construct SAS programs. The material in this section is based onreferences 1 and 2 in Appendix E. Not all the material in Part I needs to befully absorbed on first reading. Overall, Part I serves as a reference for manyof the nonstatistical commands in SAS.Part II follows the structure of the textbook. Each chapter is titled andnumbered as in IPS. The last two chapters are not in IPS but correspond tooptional material included on the CD-ROM. The SAS procedures (proc’s)relevant to doing the problems in each IPS chapter are introduced and theiruse illustrated. Each chapter concludes with a set of exercises, some of whichare modifications of or related to problems in IPS and many of which are new
xand specifically designed to ensure that the relevant SAS material has beenunderstood. The material in this part is based on references 3, 4, 5 and 6 inAppendix E.We recommend that you read Part I before starting Chapter 1 of Part II.Sections I.5.3, I.5.4, and I.5.5 do not need to be read in great detail the firsttime through. Part I together with the early chapters of Part II representa fairly heavy investment in study time but there is a payoff, as subsequentchapters are much easier to absorb and less time is required. Again, eachchapter in Part II contains more material than is really necessary to do theproblems in IPS. In part, they are to serve as references for the variousprocedures discussed. So the idea is not to read a chapter with the aim ofabsorbing and committing to memory every detail recorded there, but ratherget a general idea of the contents and the capabilities of each procedure. Ofcourse you want to acquire enough knowledge to do the problems in IPS usingSAS. It is recommended that you use SAS to do as many of the problems aspossible. This will ensure that you become a proficient user of SAS.Part III contains Appendices dealing with more advanced features of SAS,such as matrix algebra. Appendices A and B are based on more advancedmaterial from references 1 and 2 in Appendix E. Appendix C is based onreference 7 in Appendix E. This material may prove useful after taking thecourse, so it is a handy reference and hopefully an easy place to learn thematerial. Appendix D lists some of the more advanced statistical proceduresfound in references 3 and 4.SAS is available in a variety of versions and for different types of computing systems. In writing the manual we have used Release 6.12 for Windows.For the most part the manual should be compatible with other versions ofSAS as well.Many thanks to Patrick Farace, Chris Granville, and Chris Spavens ofW. H. Freeman for their help. Also thanks to Rosemary and Heather fortheir support.
Part ISAS Language1
SAS statements introduced in this partbyfilelibnameproc sortstoragecardsgotolistputupdatecontents idlostcardrenamevardataif-then-else mergerundatalines ropkeepproc print stop1 Overview and ConventionsPart I is concerned with getting data into and out of SAS and giving youthe tools necessary to perform various elementary operations on the data sothat they are in a form in which you can carry out a statistical analysis. Youdon’t need to understand everything in Part I to begin doing the problems inyour course. But before you start on Part II, you should read Part I, perhapsreading sections 5.3-5.5 lightly and returning to them later for reference.SAS is a software package that runs on several different types of computersand comes in a number of versions. This manual does not try to describeall the possible implementations or the full extent of the package. We limitour discussion to aspects of version 6.12 of SAS running under Windows95/98/NT. Also, for the most part, we present only those aspects of SASrelevant to carrying out the statistical analyses discussed in IPS. Of course,this is a fairly wide range of analyses, but the full power of SAS is neverthelessunnecessary. The material in this manual should be enough to successfully3
4SAS Languagecarry out, in any version of SAS, the analyses required in your course.In this manual special statistical or SAS concepts are highlighted in italicfont. You should be sure you understand these concepts. We provide a briefexplanation for any terms not defined in IPS. When a reference is made to aSAS statement or procedure its name is in bold face. Menu commands areaccessed by clicking the left button of the mouse on items in lists. We use aspecial notation for menu commands. For example,AIBICmeans left-click the command A on the menu bar, then in the list that dropsdown left-click the command B and finally left-click C. The menu commandsare denoted in ordinary font exactly as they appear. The record of a SASsession – the commands we type and the output obtained – are denoted intypewriter font, as are the names of any files used by SAS, variables, andconstants.SAS is case insensitive except for the values of character variables. Thestatement PROC PRINT; has the same effect as proc print; and the variablea is the same as the variable A. However, if a and b are character variablesthat take the values X and x for a particular observation, then they are notequal. For convenience we use lower case whenever possible except, of course,when referring to the values of character variables that include upper case.At the end of Part I and of each chapter in Part II we provide a fewexercises that can be used to make sure you have understood the material.We also recommend that whenever possible you use SAS to do the problems inIPS. While many problems can be done by hand you will save a considerableamount of time and avoid errors by learning to use SAS effectively. We alsorecommend that you try out the SAS concepts and commands as you readabout them to ensure full understanding.2 Accessing and Exiting SASThe first thing you should do is find out how to access the SAS packagefor your course. This information will come from your instructor or systempersonnel, or from software documentation if you have purchased SAS torun on your own computer. If you are not running SAS on your own system,you will probably need a login name and a password to the computer systembeing used in your course. After you have logged on – provided a login and
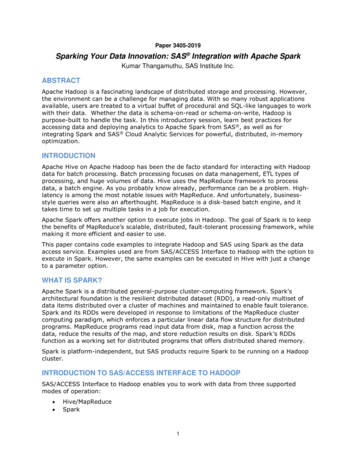
SAS Language5Figure 1: Short-cut icon to SAS software.password to the computer system – you then access SAS.Under Windows 95/98/NT you can access SAS in a number of ways.Perhaps the easiest method is to left-click or double left-click, whichever isrelevant to your system, an icon such as the short-cut icon in Figure 1.Alternatively you may use the Start button on the task bar in the lowerleft-hand corner of your screen: Start I Run, fill in the dialog box that popsup withC:\SAS\sas.exeand hit Enter. This gives the pathname for the SAS program, which hereresides on the C drive in the folder called SAS. If the software resides in adifferent folder, then a different pathname must be given. In either case,once you have invoked SAS, the Display Manager window shown in Figure 2should be displayed on your screen.The top line of the Display Manager window is called the menu bar. Itcontains File, Edit, View, Locals, Globals, Options, Window, and Help when the Program Editor window is active and File, Edit, View, Globals, Options, Window and Help when the Log window is active. A window is made active by clicking on it. The upper border of an active window is dark blue; that ofan inactive window is gray. Left-clicking any of the commands in the menubar produces a drop-down list. Below the menu bar is a small window wheretext can be typed and a row of buttons called the task bar. The buttonsin the task bar correspond to frequently used commands that can also beaccessed from the drop-down lists in the menu bar.Below the task bar is the Log window. When you run a SAS program,a listing of the program is printed in this window. Details concerning therunning of the program are printed here, e.g. how much time it took. If theprogram doesn’t work, SAS prints messages along with the program, thatindicate where it found errors. The Log window should always be examinedafter running a SAS program.The Program Editor window appears below the Log window. It is here
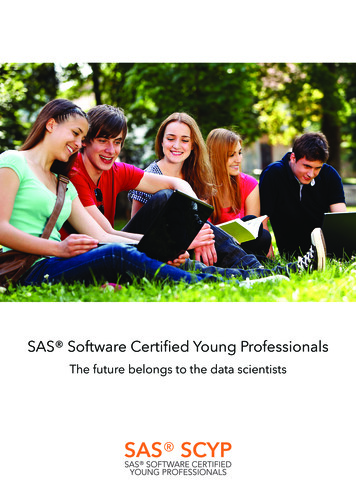
6SAS LanguageFigure 2: SAS Display Manager window containing menu bar, task bar, Logwindow and Program Editor window.
SAS Language7that the various commands that make up a SAS program are typed. Oncea SAS program is typed into the Program Editor window it is submitted forexecution. We describe action this in Section I.3.If the program runs successfully then the output from the program willappear in the Output window. To access the Output window use the menucommand Window I 3 OUTPUT. Notice that you can toggle between win dows by using Window I 1 LOG, Window I 2 PROGRAM EDITOR and Window I 3 OUTPUT. If you use the command Window I Cascade then all three windows are displayed in the Display Manager window, overlayingone another, with the active one on top. You can then toggle between thewindows by left-clicking in the window you wish to be active. Clicking anywhere on the upper border of a window will maximize the window to fillthe entire Display Manager window. Note that you can also toggle betweenthe windows by clicking on the relevant item in the drop-down list that isproduced from Globals I . To exit SAS you can simply click on the close window symbol in the upperright-hand corner of the Display Manager window. You are then asked if youreally want to terminate your SAS session. If you respond by clicking OK,then the Display Manager window closes and the SAS session ends. Ofcourse, any programs, logs, or output produced during the SAS session arelost unless they have been saved. We subsequently discuss how to save suchdata so that it can be reused. Alternatively you can use the menu commandFile I Exit with the same results. 3 Getting HelpAt times you may want more information about a command or some otheraspect of SAS than this manual provides, or you may wish to remind yourselfof some detail you have partially forgotten. SAS contains a convenient onlinehelp manual. There are several ways to access help. The simplest method isto click on the help button in the task bar depicted in Figure 3.Figure 3: The Help button.Alternatively use the menu command Help I Online documentation. Ei
8SAS LanguageFigure 4: Help window.ther of these opens a help window, as depicted in Figure 4. Observe thatthere are three tabs. The first tab is called Contents and gives a list of majortopics in the online manual, each with a book icon beside it. Click on anyof these and then click on Open at the bottom of the Help window. Thiscauses a further list of topics to be displayed. Documents describing featuresof SAS are marked with the document icon (Figure 5); a book icon leads toa further set of topics. Clicking on a document icon and the Display buttonat the bottom of the Help window causes the text of the document topic tobe displayed.This method is fine when we want to read about large topics. Often,however, we want to go directly to the point in the manual where a specific
SAS Language9Figure 5: Document icon.topic is discussed, for example, the input statement. For this we click on theIndex tab and type “input” into the small window that appears there. Thesection of the manual that discusses this statement immediately opens. Ifthere is more than one section relevant to what we typed, the window scrollsto a place in the list where these entries are listed. Clicking on one of themand then on the Display button causes the text to be displayed.If the topic we are interested in cannot be easily located in the Contentsor Index, then we can use the Find tab to search the manual for entriesrelevant to the word or phrase of interest. This is often the most convenientway to call up information about a topic.Conveniently there are hyperlinks throughout the manual that allow youto navigate your way through the manual via related topics. Spend sometime getting acquainted with Help. Undoubtedly you will need to use it atsome time.4 SAS ProgramsA SAS program typed into the Program Editor window is submitted forprocessing by clicking on the Submit button shown in Figure 6. Alternativelyyou can use the menu command Locals I Submit. Figure 6: Submit program button.A SAS program consists of SAS statements and sometimes data. Eachstatement must end in a semicolon. A SAS statement can be placed on morethan one line. If a statement does not scan correctly as a valid SAS statement,then an error will occur and the program will not run. Broadly speaking thestatements in a SAS program are organized in groups in two categories: datasteps and procedures (hereafter referred to as proc’s, as is standard whendiscussing SAS). Essentially the data steps are concerned with constructing
10SAS LanguageSAS data sets that are then analyzed via various procedures. The data steptypically involves inputting some data from a source, such as an externalfile, and then manipulating the data so that they are in a form suitable foranalysis by a procedure. In an application we will have identified some SASstatistical procedures as providing answers to questions we have about thereal-world phenomenon that gave rise to the data. There are many differentSAS procedures, and they carry out a wide variety of statistical analyses.After a SAS procedure has analyzed the data, output is created. This maytake the form of (a) actual output written in the Output window (b) datawritten to an external file, or (c) a temporary file holding a SAS data set.Let us look at a very simple SAS program. Suppose we type the followingcommands in the Program Editor window:data;input x;cards;123proc print;var x;run;The data step consists of all the SAS statements starting with the line data;and ending with the line cards;. The cards statement tells SAS that thisdata step is over. The word cards is a holdover from the days when programswere submitted to computers on punch cards. Alternatively we can use theword datalines instead of cards. Immediately following the end of thedata step are the data; in this case there are three observations, or cases,where each observation consists of one variable x. The value of x for the firstobservation is 1, for the second 2, and for the third 3. SAS constructs thisdata set and calls it work.data1. This is a default name until we learn howto name data sets.Immediately after the data comes the first procedure, in this case theproc print procedure. SAS knows that the actual data have ended when itsees a word like data or proc on a line. The procedure proc print consistsof the line proc print; and the subsequent line var x;. The var statementtells proc print which variables to print in the just created SAS data setwork.data. Since there is only one variable in this data set, there is really
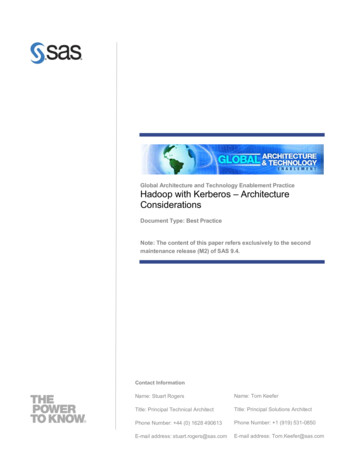
SAS Language11no need to include this statement. As we will see, we can also tell a procwhich SAS data set to operate on; if we don’t, the proc will operate on themost recently created data set by default.The run command tells SAS that everything above this line is to be executed. If no run command is given, the program does not execute althoughthe program is still checked for errors and a listing produced in the Logwindow. Prior to submission, the Program Editor window looks like Figure7.Figure 7: Program Editor window.After submitting the program, the Program Editor window empties and alisting of the program together with comments is printed in the Log windowdisplayed in Figure 8. We see from the Log window that the program ran, sowe then check the Output window for the output from the program (Figure9). Notice that the Output window contains the three observations.Suppose you submit your program and you have made an error. Becausethe Program Editor window empties after submission, you have to put theoriginally submitted program back into this window and correct it. This isdone by the menu command Locals I Recall text when the Program Editor window is active. If you forgot to type in the run command, then the listingand any error messages based on the syntax of SAS commands only, no errormessages based on the execution of the program, are produced in the Logwindow. If a program has a long running time, this is a good way to scanthe program for syntax errors before actually running it.If you have text in any of the windows and you don’t want it there, thenthe window can be emptied by activating the window and using the commandEdit I Clear text. Alternatively, you may want to print the contents of a window. This is done by making the relevant window active and then usingthe command File I Print. If you want to save the contents of a window to a
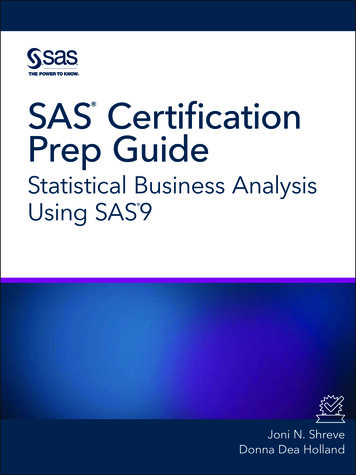
12SAS LanguageFigure 8: Log window.Figure 9: Output window.
SAS Language13file, use the command File I Save or File I Save as. A window pops up and you are asked which folder you want to save the window contents in, whatname you want to give the file and what suffix you want to give the file name.For example, you can choose the suffices .sas, .log, .lst, .dat, or .rtf. If youchoose .dat or .rtf, then the contents of the window are placed in a text file,and clicking on the file is likely to result in some editor on the system openingthe file to be edited. The .sas ending, however, is treated in a special way, asthis suffix identifies the contents of the file as consisting of a SAS program(whether it is a valid program or not). Clicking on such a file causes the SASprogram to launch and the contents of the file to be loaded into the ProgramEditor window. Note that this gives you an alternative way of constructingSAS programs: use your favorite editor and then save the SAS statementsin a file with the suffix .sas. If you use the .lst suffix, clicking on the fileresults in it being opened by the SAS System Viewer, provided this softwarehas been installed on your system. The System Viewer regards .lst files asoutput from a SAS program that has been written to the Output window.If you use the .log suffix, clicking on the file results in it being opened bythe System Viewer, which regards the file as a listing of a program, togetherwith comments, that has been written to the Log window.A SAS program can also contain comments. This is helpful when you havea long program and you want to be able to remind yourself later about whatthe program does and how it does it. Comments can be placed anywhere ina SAS program provided they start with /* and end with */. For example,data; /* this is the data step */input x;cards;1 /* this is the data */22proc print; /* this is a procedure */run;5 Data StepWe discuss only the key features of the data step in this section. Forthe many other more advanced procedures, we refer the reader to reference1 in Appendix E. In Appendix B we discuss arrays, which are useful when
14SAS Languagecarrying out extensive data processing that requires recoding of data. Thismaterial is not needed in an elementary statistics course, however.5.1 Form and Behavior of a Data StepThe first thing you have to know how to do is to get your data into the SASprogram so that they can be analyzed. SAS uses data steps to construct SASdata sets. Several SAS data sets can be constructed in a single SAS programby including several data steps. These data sets can be combined to formnew SAS data sets, and they can be permanently stored in computer files sothat they can be accessed at a later date.The general form of the data step isdata name;statementscards;where name corresponds to a name we give to the SAS data set being constructed and statements is a set of SAS statements. These statements typically involve reading data from observations from some source and perhapsperforming various mathematical operations on the data to form new variables. SAS expects to read data from some source whenever there is aninput statement included in statements. For example, the default methodof supplying the data to an input statement is to include the data in theprogram immediately after the cards statement. If we are not going to usethis method, and it is often inconvenient because it may involve a lot oferror-prone typing, then we must tell SAS where to find the data. We don’thave to supply name, but if we don’t, a default name is assigned, with thefirst unnamed SAS data set in the program called work.data1, the secondcalled work.data2, and so on. In general it is better to name a data setwith some evocative name so that you can remember what kind of data itcontains. The value given to name must conform to certain rules, it must bea valid SAS name. A SAS name must begin with a letter or underscore ,can consist of letters, numbers, and the
vi CONTENTS 12 One-way Analysis of Variance 173 12.1Example.174 12.2Exercises.178 13 Two-way Analysis of Variance 181