Transcription
Introduction to SAS for Data AnalysisIntroduction to SAS for Data AnalysisScott RichterThe University of North Carolina at GreensboroUNCG Quantitative Methodology Series 1
Introduction to SAS for Data AnalysisContents1What is SAS? . 32What can I do with SAS? . 43Finding SAS . 53.1UNCG faculty, staff or students . 53.2Outside the UNC System . 63.3SAS Coding and Syntax . 73.4Getting data into SAS . 204Statistical analysis using SAS . 214.1Our working data set . 214.2Research questions . 244.3Using SAS to get the results . 294.4SAS Enterprise Guide . 66UNCG Quantitative Methodology Series 2
Introduction to SAS for Data Analysis1What is SAS?From: http://www.sas.com/en us/company‐information.html“SAS is the leader in analytics. Through innovative analytics, business intelligenceand data management software and services, SAS helps customers at more than 80,000sites make better decisions faster. Since 1976, SAS has been giving customers aroundthe world THE POWER TO KNOW .”In this workshop, we will learn the basics of using SAS for statistical analysis,including Data file creation/acquisition Data manipulation Using supplied functions Simple data analyses and graphics We will only scratch the surface!UNCG Quantitative Methodology Series 3
Introduction to SAS for Data Analysis2What can I do with SAS?SAS is an integrated software suite for advanced analytics, business intelligence, datamanagement, and predictive analytics. You can use SAS software through both a graphicalinterface and the SAS programming language, or Base SAS.With SAS software, you can access data in almost any format, including SAS tables, Microsoft Excel tables, anddatabase files.manage and manipulate your existing data to get the data that you need. For example, youcan subset your data, combine it with other data, and create new columns.analyze your data using statistical techniques ranging from descriptive measures likecorrelations to logistic regression and mixed models to sophisticated methods such asmodern model selection and Bayesian hierarchical models.present the results of your analyses in a meaningful report that you can share with others.The reports that you create can be saved in a wide variety of formats, including HTML,PDF, and RTF.UNCG Quantitative Methodology Series 4
Introduction to SAS for Data Analysis3Finding SAS3.1UNCG faculty, staff or /SAS and JMP may be installed on a University (desktop or laptop) computer, or used on ahome computer by faculty, staff or students enrolled in degree-granting programs at UNCG.How can I get the software? Install from the campus network.SAS and JMP are available for installation on university-owned computers at nocharge from Run Advertised Programs (RAP). For details on installing software fromRAP please see Installing Applications on the General Computing Network. Download SAS installation files via secure FTP.You can download the SAS or JMP installation files via secure FTP from any locationwith internet access. For this option you will need high-speed internet and no datadownload limits.Please note: Because the SAS installation files are over 15GB in size the downloadwill take a significant amount of time - at 1mbps download, you can expect thedownload to take over 4 hours. For instructions visit: Secure FTP downloadinstructions for SAS. Assisted installation in the TSC.Consultants in the Technology Support Center in 101 Forney Building on campus candownload and/or install SAS for free to your 32G or higher flash drive, external harddrive, or computer. Install from disc.Installation discs may be borrowed from the ITS Client Services office in 202 Forneyfor a refundable deposit of 5. Office hours are 8am-5pm, M-F, except on universityholidays. Outside of office hours, you can call 6-TECH at 336-256-8324 to request thedisc and get instructions on how to pick it up. Use the versions installed on the campus networkSAS is available in the ITS open access computer labs and from either on or offcampus via MyCloud.UNCG Quantitative Methodology Series 5
Introduction to SAS for Data Analysis3.2Outside the UNC SystemSAS University EditionWith SAS University Edition, you get SAS Studio, Base SAS, SAS/STAT, SAS/IML,SAS/ACCESS and several time series forecasting procedures from SAS/ETS. It's thesame world‐class analytics software used by more than 80,000 business,government and university sites around the world, including 93 of the top 100companies on the Fortune Global 500 list. That means you'll be using the most up‐to‐date statistical and quantitative methods. And did we mention it's free?(http://www.sas.com/en us/software/university‐edition.html)UNCG Quantitative Methodology Series 6
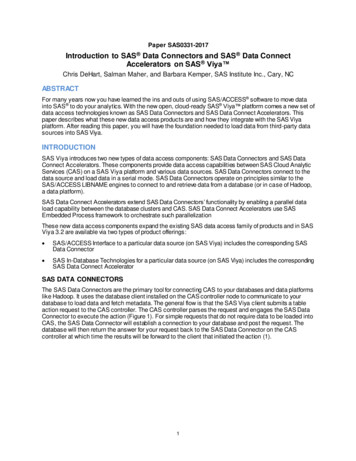
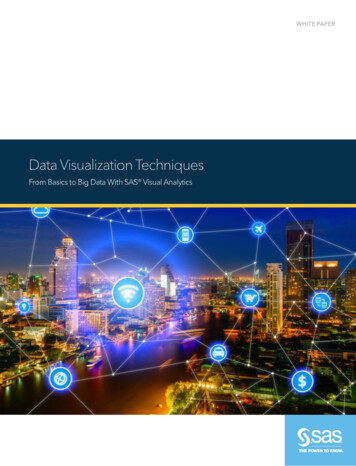
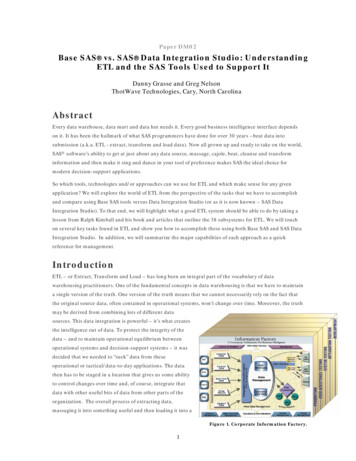
Introduction to SAS for Data Analysis3.3SAS Coding and SyntaxStart using SAS from lab machine. From the START menu find the SAS folder under AllPrograms and choose SAS 9.3 (or 9.4).Something similar to below appears:SAS Windows1. (Enhanced) Editor – Although there are now other ways to obtain results in SAS, the“traditional” method is to compose and execute programs in the editor window.Here is where you will write your programs.2. Log – Contains the details of program execution. The Log window is where to look tofind errors, warnings and information on settings. On startup the Log window givesversion and licensing information.3. Output ‐‐ Contains output generated by the program.Note: Beginning in version 9.3, the Results Window, containing output in htmlformat, opens whenever output is generated rather than text output.4. Results/Explorer – The Results window will contain a list of output created, and theExplorer window allows functions in a similar way to Windows Explorer.UNCG Quantitative Methodology Series 7
Introduction to SAS for Data AnalysisComposing a programSAS requires that a complete module of code be executed in order to create andmanipulate data files and perform data analysis. In general, first a data file must be createdusing a DATA step.The DATA step.There are several ways to create data files in SAS, but the simplest is to list theobservations within a DATA step.Example. Suppose a have a list a values for which we wish to compute summary statistics.*Program 1: First DATA step;data first data;input y;datalines;25991011;run;The first line opens the DATA step and names the file. The input statementspecifies the variable names. datalines tells SAS to expect the data points to be listed,starting on the next row. The run statement ends the DATA step. SAS will read thecommands but will not execute any until a run statement is encountered.UNCG Quantitative Methodology Series 8
Introduction to SAS for Data AnalysisSubmitting code.There are at least three ways to submit a program:i. Choose Submit from the Run menu.ii. Click on the “running man” icon,, in the Application Toolbar.UNCG Quantitative Methodology Series 9
Introduction to SAS for Data Analysisiii. Type “Submit” in the Command window in the upper left corner of the window.When this code is submitted, the following appears in the Log window:UNCG Quantitative Methodology Series 10
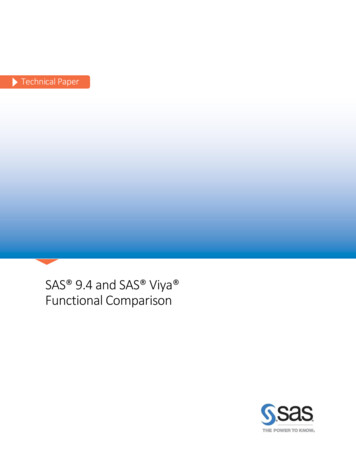
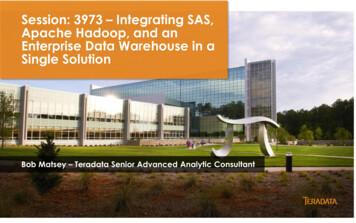
Introduction to SAS for Data Analysis1234*Program 1: First DATA step (p.8);data first data;input y;datalines;NOTE: The data set WORK.FIRST DATA has 6 observations and 1variables.NOTE: DATA statement used (Total process time):real time0.13 secondscpu time0.00 seconds1112;run;As stated on p.7, the Log gives details of program execution and also displays errors andwarnings. In this case, it indicates that the SAS data file WORK.FIRST DATA has beencreated. The WORK prefix indicates the SAS folder where the data file is stored. It can beviewed using the Explorer window:Double-clicking the Libraries icon opens a list of SAS folders, including the “Work” folder.UNCG Quantitative Methodology Series 11
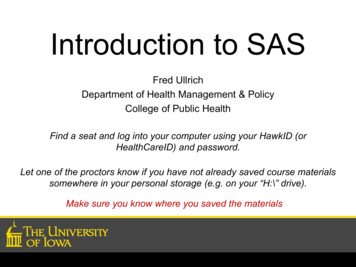
Introduction to SAS for Data AnalysisInside the “Work” folder is the First data file:UNCG Quantitative Methodology Series 12
Introduction to SAS for Data AnalysisDouble‐clicking on First data opens the VIEWTABLE:UNCG Quantitative Methodology Series 13
Introduction to SAS for Data AnalysisThe data file can also be viewed in the Results window using the PRINT procedure. Thecode below can be submitted as before. The option “data datafile name” appears aftera space after proc print. Other options, separated by a space, may also be added asnecessary:*Program 2: Printing the data file;proc print data first data;run;The Results window(s) then opens:Now suppose we would like to compute summary statistics and construct plots. Thereare several procedures that can do this, but we illustrate here UNIVARIATE procedure.Note that here we have specified two options in the proc univariate statement. The plotoption requests common univariate plots be output:*Program 3: Using PROC UNIVARIATE;proc univariate plot data first data;var y;run;UNCG Quantitative Methodology Series 14
Introduction to SAS for Data AnalysisThe Results window displays the following:The SAS SystemThe UNIVARIATE ProcedureVariable: yMomentsN6Mean7.66666667 Sum Observations 46Std Deviation3.44480285 Variance11.8666667Skewness-1.0747341 Kurtosis-0.0804823Sum WeightsUncorrected SS 412Corrected SSCoeff Variation 44.9322111 Std Error Mean659.33333331.40633487Basic Statistical MeasuresLocationMeanVariability7.666667 Std DeviationMedian 9.000000 VarianceMode3.4448011.866679.000000 Range9.00000Interquartile Range 5.00000Tests for Location: Mu0 0TestStatisticStudent's ttSignM 3Signed Rank Sp Value5.451523 Pr t 0.0028Pr M 0.031310.5Pr S 0.0313Quantiles (Definition 5)QuantileEstimate100% Max1199%1195%1190%1175% Q310UNCG Quantitative Methodology Series 15
Introduction to SAS for Data Analysis50% Median 925% Q1510%25%21%20% Min2Extreme ObservationsLowestHighestValue Obs Value Obs21525293949493105105116UNCG Quantitative Methodology Series 16
Introduction to SAS for Data AnalysisWe will investigate generating summary statistics and plots in more detail later.UNCG Quantitative Methodology Series 17
Introduction to SAS for Data AnalysisImportant!You may have noticed that each SAS statement ends in a semicolon. The semicolonsignals SAS to execute the code preceding it (from the previous semicolon, if there isone).Suppose in the previous program we had inadvertently omitted a semicolon. Weconsider two versions, the first where the semicolon is omitted from the first line, andthe second where the semicolon is omitted from the second line.First case:*Program 4(a): Missing semicolons in Program 3;proc univariate plot data first datavar y;run;Log window:1819proc univariate plot data first datavar y;--22202ERROR 22-322: Syntax error, expecting one of the following: ;, (, ALL, ALPHA, ANNOTATE,CIBASIC,CIPCTLDF, CIPCTLNORMAL, CIQUANTDF, CIQUANTNORMAL, DATA, DEBUG, EXCLNPWGT, FREQ,GOUT, LOCCOUNT, MODE, MODES, MU0, NEXTROBS, NEXTRVAL, NOBYPLOT, NOPRINT, NORMAL,NOTABCONTENTS, NOVARCONTENTS, OUTTABLE, PCTLDEF, PLOT, PLOTSIZE, ROBUSTSCALE,ROUND,SUMMARYCONTENTS, TRIMMED, VARDEF, WINSORIZED.ERROR 202-322: The option or parameter is not recognized and will be ignored.20run;NOTE: The SAS System stopped processing this step because of errors.NOTE: PROCEDURE UNIVARIATE used (Total process time):real time0.04 secondscpu time0.00 secondsIn the first case, the missing semicolon causes SAS to read the second line as part ofthe first, and since “var” is not a valid option in the proc univariate statement, a syntaxerror is produced.UNCG Quantitative Methodology Series 18
Introduction to SAS for Data AnalysisSecond case:*Program 4(b): Missing semicolons in Program 3;proc univariate plot data first data;var yrun;Log window:21proc univariate plot data first data;22var y23run;ERROR: Variable RUN not found.In the second case, the missing semicolon causes SAS to read the third line as part ofthe second, and interprets “run” as a second variable to be analyzed. However, there isnot variable called run in the data set, so again an error is produced.Commands, object and variable names, functions and options, however are not casesensitive.UNCG Quantitative Methodology Series 19
Introduction to SAS for Data Analysis3.4Getting data into SASIn most situations, data will be stored in an external file that will need to be read.Delimited files can be read using the DATA step, while many other types of files can beimported. We will focus here on reading using the DATA step.Suppose the data of the previous examples is contained in a text file called “datafile.txt”,saved in the folder “C : \Documents\SAS workshop\MyData” and arranged as below, withrows corresponding to observations:258991011To create the data file:*Program 5: Reading a delimited file;data first data2;infile 'C:\Documents\SAS workshop\datafile.txt';input y;run;To view the data file, we can use the Explorer window or the PRINT procedure (Seep. 14)Now we may use procedures to process the data as before.UNCG Quantitative Methodology Series 20
Introduction to SAS for Data Analysis44.1Statistical analysis using SASOur working data setWe now consider a space‐delimited data file containing several variablesmeasured on students of an introductory statistics class.Students in an introductory statistics class (MS212 taught by Professor JohnEccleston and Dr Richard Wilson at The University of Queensland) participated in asimple experiment. The students took their own pulse rate. They were then asked to flipa coin. If the coin came up heads, they were to run in place for one minute. Otherwisethey sat for one minute. Then everyone took their pulse again. The pulse rates and otherphysiological and lifestyle data are given in the data.Five class groups between 1993 and 1998 participated in the experiment. Thelecturer, Richard Wilson, was concerned that some students would choose the lessstrenuous option of sitting rather than running even if their coin came up heads, so inthe years 1995‐1998 a different method of random assignment was used. In these years,data forms were handed out to the class before the experiment. The forms were pre‐assigned to either running or non‐running and there were an equal number of each. seRanDescriptionHeight (cm)Weight (kg)Age (years)Sex (1 M, 2 F)Regular smoker? (1 yes, 2 no)Regular drinker? (1 yes, 2 no)Frequency of exercise (1 high, 2 moderate, 3 low)Whether the student ran or sat between the first and second pulsemeasurements(1 ran, 2 sat)Pulse1First pulse measurement (rate per minute)Pulse2Second pulse measurement (rate per minute)YearYear of class (93 ‐ 98)1995 and 1998 not all of the forms were returned so the numbers running and sittingwas still not entirely controlled. (complete description available athttp://www.statsci.org/data/oz/ms212.html)The first few rows of the data file are given below:UNCG Quantitative Methodology Series 21
Introduction to SAS for Data AnalysisHeight Weight AgeGender Smokes Alcohol ExerciseRanPulse1 Pulse2 11196176931958418M21127173931736418F2132908893A DATA step similar to that in Section 3.4 can be used to read the file:*Program 6: Reading a space delimited file;data pulse;infile 'C:\Documents\SAS workshop\MyData\pulse.txt'firstobs 2;input Height Weight Age Gender Smokes AlcoholExercise Ran Pulse1 Pulse2 Year;run;When using the infile statement to read a delimited file, the variable names and theirformats must be known and supplied in the input statement. Since the Gender variablehas nonnumeric values (M/F) a ‘ ’ is added after the variable name to tell SAS that thevariable has character string values. Also, since variable names appear at the top of thedata file, the firstobs 2 option is included so that so that SAS begins reading data valueson row 2 of the file instead of row 1.UNCG Quantitative Methodology Series 22
Introduction to SAS for Data AnalysisAnother common type of delimited file is a comma‐separated (csv) file. If theprevious data file had been saved as a csv file, the infile statement can be modified asbelow, where the dlm ’,’ option indicates a comma‐separated file.*Program 7: Reading a csv delimited file;data pulse;infile 'C:\Documents\SAS workshop\MyData\data.csv'dlm ',' firstobs 2;input Height Weight Age Gender Smokes AlcoholExercise Ran Pulse1 Pulse2 Year;run;We will use these data to answer several research questions, completing several analysistasks and illustrating many SAS concepts along the way.Using the Import WizardData files can also be imported by choosing “Import Data” from the File menu.UNCG Quantitative Methodology Series 23
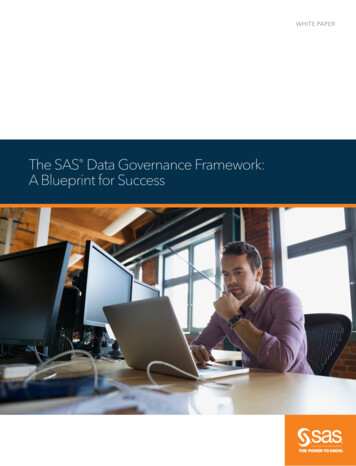
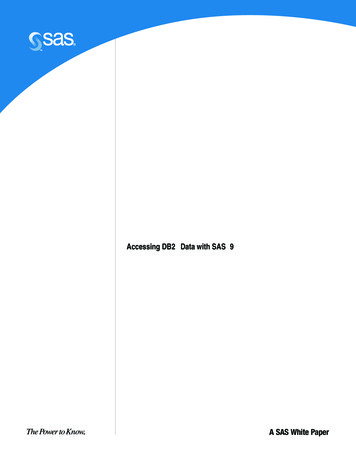
Introduction to SAS for Data Analysis4.2Research questions1. How does Pulse1 (the first pulse measurement) depend on lifestyle andphysiological measurements? Are frequent exercisers fitter?Explore the relationship between Pulse1 and Weight.(a) Scatterplot of Pulse1 by Weight. “The plot suggests a weak negative linearrelation between weight and the first pulse reading. There is also an outlyingobservation that could affect the quantitative assessments of the association.”(b) Simple linear regression. “Each additional pound of weight was associatedwith a 0.17 beat per minute decrease in pulse”(c) Pearson correlation. “The Pearson correlation between Pulse1 and Weightwas r ‐0.195, which was statistically significant at the 0.05 level ofsignificance t(df 107) ‐2.05, p 0.043).”UNCG Quantitative Methodology Series 24
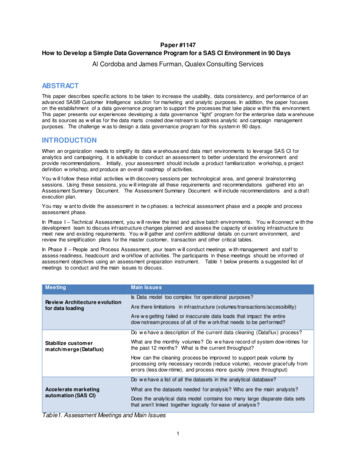
Introduction to SAS for Data AnalysisExplore the relationship between Pulse1 and smoking status.(a) Boxplot of Pulse1 by smoking status: “The boxplots suggest that there is littledifference between typical first pulse measurements of smokers andnonsmokers, but that there is more variability among nonsmokers.”(b) Descriptives. “The mean pulse rate for smokers was 77.55 bpm and fornonsmokers 75.48 bpm.(c) t‐test. The mean difference of 2.07 was not statistically significant t(df 107) 0.49, p 0.314)”UNCG Quantitative Methodology Series 25
Introduction to SAS for Data Analysis2. Is there evidence that some students didn’t run even though their coin toss cameup heads?Is there evidence that fewer than 50% would be selected to run?(a) Frequencies and proportions. “Overall, 41.8% of all students ran betweenpulse readings.(b) Test for proportion. Assuming this groups of students can be considered arandom sample from all similar statistics students, this was moderatelyconvincing st
May 12, 2016 · SAS is an integrated software suite for advanced analytics, business intelligence, data management, and predictive analytics. You can use SAS software through both a graphical interface and the SAS programming language, or Base SAS. With SAS software, you can access data in almost any format, including